|
|
市場調査レポート
商品コード
1219888
フェイスバームの世界市場規模・シェア・産業動向分析レポート用途別(住宅、商業)、エンドユーザー別(女性、男性)、流通チャネル別(オフライン、オンライン)、地域別展望・予測、2022年~2028年版Global Face Balm Market Size, Share & Industry Trends Analysis Report By Application (Residential, and Commercial), By End Use (Women, and Men), By Distribution Channel (Offline, and Online), By Regional Outlook and Forecast, 2022 - 2028 |
||||||
|
|
|||||||


| フェイスバームの世界市場規模・シェア・産業動向分析レポート用途別(住宅、商業)、エンドユーザー別(女性、男性)、流通チャネル別(オフライン、オンライン)、地域別展望・予測、2022年~2028年版 |
|
出版日: 2023年01月31日
発行: KBV Research
ページ情報: 英文 162 Pages
納期: 即納可能
|
- 全表示
- 概要
- 図表
- 目次
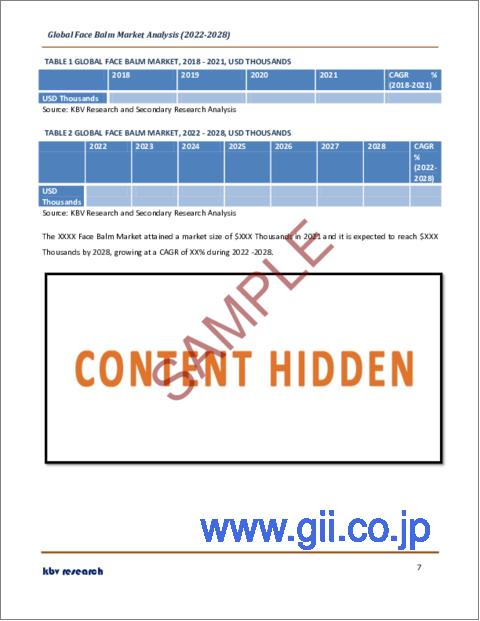
フェイスバームの世界市場規模は、予測期間中にCAGR8.7%で成長し、2028年には3億3450万米ドルに達すると予測されます。
フェイスバーム市場の成長予測は、世界規模での製品需要の拡散に起因するものです。さらに、水を使わない美容のトレンドが定着するにつれて、化粧品の売上が急増しています。独立系企業は、水を使わない化粧品のアイデアを前進させるために多くのことを行ってきました。消費者の好意的な反応は、高級品や大衆品に水なし美容のビジネスの幅を広げることをさらに促し、フェイスバーム業界の拡大に拍車をかけました。
さらに、魅力的なマーケティング戦略と新しいパッケージの動向が、フェイスバーム市場の需要を高める主な要因となっています。さらに、肌に安全な化粧品やフェイシャルケア製品の作成に天然成分を使用することは、より多くの顧客を引き付けるためにメーカーが頻繁に採用する戦略です。これは、この業界で動作する企業の収益を増加させるのに役立ちます。メーカーがこれらの技術を共同で採用することで、フェイスバームの市場動向は増加しています。
COVID-19インパクト分析
COVID-19の大流行により、世界各地でウイルスの蔓延を食い止めるため、工場や店舗などの営業が直ちに停止させられました。渡航制限や需給の激減により、必需品以外の市場にも打撃を与えました。世界の封鎖による人手不足のため、スキンケア製品メーカーが生産拠点の閉鎖を余儀なくされました。さらに、パンデミックの影響で、多くの化粧品店が閉店を余儀なくされました。厳しい封鎖措置による小売店の閉鎖は、売上高を大幅に減少させるという甚大な被害をもたらしました。消費者が化粧品やパーソナルケア用品への支出を減らす中、企業は生産能力の拡大や手指消毒剤、清掃用具の提供など、積極的に対応しました。
市場の成長要因
主要プレーヤーの支出増加
化粧品ビジネスの原動力となるのは、研究開発、広告宣伝、プロモーションなどです。主要企業は、顧客の購買行動に影響を与え、小売環境における製品アピールを高めるために、これらの要素に多大な投資を行っています。さらに、低開発国でのインターネット利用の拡大が、大手企業の広告予算編成のあり方に変化をもたらしています。社会の世界化に対応するため、主要プレーヤーが広告・宣伝費をより多く投入する「メジャーシフト」が起きているのです。これらにより、世界的に市場が拡大することが予想されます。
スキンケア製品構成成分の認知度向上
老化の兆候を治療または阻止するバームなどの局所治療薬は数多く存在します。レチノールは、加齢の影響を最小限に抑えるために非常に重要です。レチノールは、ビタミンAの活性型であり、検出可能な別のタイプです。レチノールとレチノイン酸は、体内のビタミンAを補充することで、細胞の再生を促進し、コラーゲンを生成し、シミやシワを軽減します。アンチエイジング・スキンケア製品のもうひとつの重要な成分である抗酸化物質は、老化した肌の治癒と修復をサポートします。しかし、アンチエイジングの主な効果は予防です。予測期間中は、これらすべてが世界各地での市場拡大を後押しするものと思われます。
市場の抑制要因
低級品の使用による副作用
まともなスキンケアクリームは、それなりに高価であることが多いが、特定の有名ブランドは、その優れた効果により、顔のスキンケア事業で長い間活躍してきました。また、「某有名ブランドのフェイスクリームは、優れた効果を発揮するため、長い間フェイススキンケアビジネスに携わってきました。フェイスバームの中には、水分の蒸発を止める油分が含まれているものがあり、これが毛穴を詰まらせてニキビにつながることがあります。このようなオイルには、ペトロラタムやラノリンなどが含まれます。こうしたことが、フェイスバームの使用を制限し、市場拡大を阻む可能性があります。
アプリケーションの展望
フェイスバーム市場は、用途によって商業用と住宅用に分類されます。2021年のフェイスバーム市場では、住宅用セグメントが最も高い収益シェアを占めています。フェイスバームを使用することの利点に対する人々の認識が高まるにつれ、個人使用のための化粧品の家庭での使用が増加しています。お客様は、ほこりや大気汚染、直射日光によるダメージから肌を守るために、毎日フェイスバームを使用するように促されています。世界的に見ても、個人によるパーソナルユースが化粧品業界の中で大きな割合を占めているのです。
最終用途の展望
フェイスバーム市場は、最終用途に基づいて、男性と女性に区分されます。2021年のフェイスバーム市場では、男性用セグメントが大きな収益シェアを記録しました。男性用スキンケア市場は、可処分所得の増加、製品の発売、著名人の推薦、男性消費者の個人の清潔さや定期的な身だしなみに対する意識の高まりなどを主な理由として拡大しています。その結果、男性は、デオドラント、カミソリ、洗顔などの一般的な身だしなみ用品に加え、アンチエイジングや日焼け止めクリームなどの特殊なスキンケア製品への関心を高めています。近い将来、日焼け止めやアンチエイジング製品に対する男性の需要は大幅に増加すると予想されます。
流通経路の展望
フェイスバーム市場は、流通チャネルによってオンラインとオフラインに分けられます。オフライン部門は、2021年にフェイスバーム市場で最大の収益シェアを生み出しました。メーカーは一貫して店頭での製品の視認性を高める努力をしており、その結果、主にオフラインでの販売に集中しています。その結果、フェイスバームやその他のフェイシャルケア製品は、オフラインでより多く入手できるようになっています。また、オフラインの化粧品店でもフェイスバームが手に入るようになったことで、市場は拡大しています。
地域別の概況
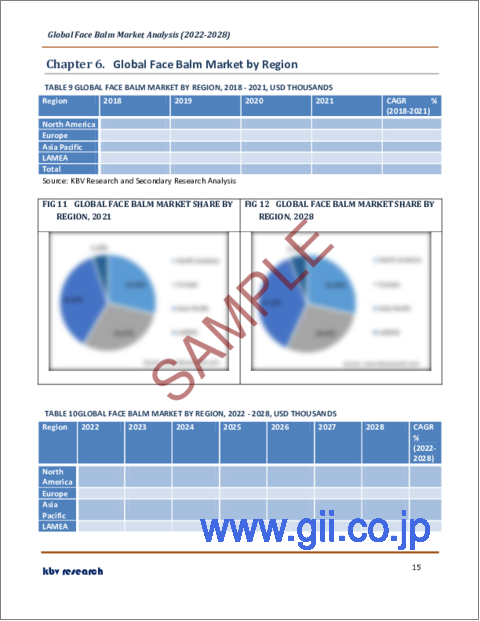
フェイスバーム市場を地域別に見ると、北米、欧州、アジア太平洋、LAMEAの4地域で分析されています。アジア太平洋地域は、2021年のフェイスバーム市場で最大の収益シェアを獲得し、フェイスバーム市場を牽引しました。高度に発達したインフラと充実した研究開発基盤を持つ同地域は、予測される期間、収益面で世界市場を独占することができると思われます。世界の化粧品産業は、最も多様で活発な市場の一つです。スキンケア、日焼け止め、保湿剤、各種フェイスバームなどは、この地域で最も人気のある化粧品製品カテゴリーです。
目次
第1章 市場の範囲と調査手法
- 市場の定義
- 目的
- 市場規模
- セグメンテーション
- フェイスバームの世界市場、用途別
- フェイスバームの世界市場、エンドユーザー別
- フェイスバームの世界市場、流通チャネル別
- フェイスバームの世界市場、地域別
- 調査手法
第2章 市場概要
- イントロダクション
- 概要説明
- 市場の構成とシナリオ
- 概要説明
- 市場に影響を与える主な要因
- 市場促進要因
- 市場の抑制要因
第3章 フェイスバームの世界市場:アプリケーション別
- 住宅用品の世界市場:地域別
- 商業用品の世界市場:地域別
第4章 フェイスバームの世界市場エンドユーザー別
- 女性の世界市場:地域別
- 男性用化粧品の世界市場:地域別
第5章 フェイスバームの世界市場流通チャネル別
- オフラインの世界市場:地域別
- オンラインバームの世界市場:地域別
第6章 フェイスバームの世界市場:地域別
- 北米
- 北米のフェイスバームの国別市場
- 米国
- カナダ
- メキシコ
- その他北米地域
- 北米のフェイスバームの国別市場
- 欧州
- 欧州のフェイスバーム市場:国別
- ドイツ
- 英国
- フランス
- ロシア
- スペイン
- イタリア
- その他欧州
- 欧州のフェイスバーム市場:国別
- アジア太平洋地域
- アジア太平洋地域のフェイスバームの国別市場
- 中国
- 日本
- インド
- 韓国
- シンガポール
- マレーシア
- その他アジア太平洋地域
- アジア太平洋地域のフェイスバームの国別市場
- LAMEA
- LAMEAフェイスバーム市場:国別
- ブラジル
- アルゼンチン
- UAE
- サウジアラビア
- 南アフリカ
- ナイジェリア
- その他のLAMEA
- LAMEAフェイスバーム市場:国別
第7章 企業プロファイル
- L'Oreal Group(CeraVe)
- Unilever PLC(REN Clean Skincare)
- Weleda AG
- Pangaea Holdings, Inc.
- Naturium
- Pinch of Colour LLC
- UpCircle Beauty
- W.S. Badger Company, Inc.
LIST OF TABLES
- TABLE 1 Global Face Balm Market, 2018 - 2021, USD Thousands
- TABLE 2 Global Face Balm Market, 2022 - 2028, USD Thousands
- TABLE 3 Global Face Balm Market by Application, 2018 - 2021, USD Thousands
- TABLE 4 Global Face Balm Market by Application, 2022 - 2028, USD Thousands
- TABLE 5 Global Residential Market by Region, 2018 - 2021, USD Thousands
- TABLE 6 Global Residential Market by Region, 2022 - 2028, USD Thousands
- TABLE 7 Global Commercial Market by Region, 2018 - 2021, USD Thousands
- TABLE 8 Global Commercial Market by Region, 2022 - 2028, USD Thousands
- TABLE 9 Global Face Balm Market by End Use, 2018 - 2021, USD Thousands
- TABLE 10 Global Face Balm Market by End Use, 2022 - 2028, USD Thousands
- TABLE 11 Global Women Market by Region, 2018 - 2021, USD Thousands
- TABLE 12 Global Women Market by Region, 2022 - 2028, USD Thousands
- TABLE 13 Global Men Market by Region, 2018 - 2021, USD Thousands
- TABLE 14 Global Men Market by Region, 2022 - 2028, USD Thousands
- TABLE 15 Global Face Balm Market by Distribution Channel, 2018 - 2021, USD Thousands
- TABLE 16 Global Face Balm Market by Distribution Channel, 2022 - 2028, USD Thousands
- TABLE 17 Global Offline Market by Region, 2018 - 2021, USD Thousands
- TABLE 18 Global Offline Market by Region, 2022 - 2028, USD Thousands
- TABLE 19 Global Online Market by Region, 2018 - 2021, USD Thousands
- TABLE 20 Global Online Market by Region, 2022 - 2028, USD Thousands
- TABLE 21 Global Face Balm Market by Region, 2018 - 2021, USD Thousands
- TABLE 22 Global Face Balm Market by Region, 2022 - 2028, USD Thousands
- TABLE 23 North America Face Balm Market, 2018 - 2021, USD Thousands
- TABLE 24 North America Face Balm Market, 2022 - 2028, USD Thousands
- TABLE 25 North America Face Balm Market by Application, 2018 - 2021, USD Thousands
- TABLE 26 North America Face Balm Market by Application, 2022 - 2028, USD Thousands
- TABLE 27 North America Residential Market by Country, 2018 - 2021, USD Thousands
- TABLE 28 North America Residential Market by Country, 2022 - 2028, USD Thousands
- TABLE 29 North America Commercial Market by Country, 2018 - 2021, USD Thousands
- TABLE 30 North America Commercial Market by Country, 2022 - 2028, USD Thousands
- TABLE 31 North America Face Balm Market by End Use, 2018 - 2021, USD Thousands
- TABLE 32 North America Face Balm Market by End Use, 2022 - 2028, USD Thousands
- TABLE 33 North America Women Market by Country, 2018 - 2021, USD Thousands
- TABLE 34 North America Women Market by Country, 2022 - 2028, USD Thousands
- TABLE 35 North America Men Market by Country, 2018 - 2021, USD Thousands
- TABLE 36 North America Men Market by Country, 2022 - 2028, USD Thousands
- TABLE 37 North America Face Balm Market by Distribution Channel, 2018 - 2021, USD Thousands
- TABLE 38 North America Face Balm Market by Distribution Channel, 2022 - 2028, USD Thousands
- TABLE 39 North America Offline Market by Country, 2018 - 2021, USD Thousands
- TABLE 40 North America Offline Market by Country, 2022 - 2028, USD Thousands
- TABLE 41 North America Online Market by Country, 2018 - 2021, USD Thousands
- TABLE 42 North America Online Market by Country, 2022 - 2028, USD Thousands
- TABLE 43 North America Face Balm Market by Country, 2018 - 2021, USD Thousands
- TABLE 44 North America Face Balm Market by Country, 2022 - 2028, USD Thousands
- TABLE 45 US Face Balm Market, 2018 - 2021, USD Thousands
- TABLE 46 US Face Balm Market, 2022 - 2028, USD Thousands
- TABLE 47 US Face Balm Market by Application, 2018 - 2021, USD Thousands
- TABLE 48 US Face Balm Market by Application, 2022 - 2028, USD Thousands
- TABLE 49 US Face Balm Market by End Use, 2018 - 2021, USD Thousands
- TABLE 50 US Face Balm Market by End Use, 2022 - 2028, USD Thousands
- TABLE 51 US Face Balm Market by Distribution Channel, 2018 - 2021, USD Thousands
- TABLE 52 US Face Balm Market by Distribution Channel, 2022 - 2028, USD Thousands
- TABLE 53 Canada Face Balm Market, 2018 - 2021, USD Thousands
- TABLE 54 Canada Face Balm Market, 2022 - 2028, USD Thousands
- TABLE 55 Canada Face Balm Market by Application, 2018 - 2021, USD Thousands
- TABLE 56 Canada Face Balm Market by Application, 2022 - 2028, USD Thousands
- TABLE 57 Canada Face Balm Market by End Use, 2018 - 2021, USD Thousands
- TABLE 58 Canada Face Balm Market by End Use, 2022 - 2028, USD Thousands
- TABLE 59 Canada Face Balm Market by Distribution Channel, 2018 - 2021, USD Thousands
- TABLE 60 Canada Face Balm Market by Distribution Channel, 2022 - 2028, USD Thousands
- TABLE 61 Mexico Face Balm Market, 2018 - 2021, USD Thousands
- TABLE 62 Mexico Face Balm Market, 2022 - 2028, USD Thousands
- TABLE 63 Mexico Face Balm Market by Application, 2018 - 2021, USD Thousands
- TABLE 64 Mexico Face Balm Market by Application, 2022 - 2028, USD Thousands
- TABLE 65 Mexico Face Balm Market by End Use, 2018 - 2021, USD Thousands
- TABLE 66 Mexico Face Balm Market by End Use, 2022 - 2028, USD Thousands
- TABLE 67 Mexico Face Balm Market by Distribution Channel, 2018 - 2021, USD Thousands
- TABLE 68 Mexico Face Balm Market by Distribution Channel, 2022 - 2028, USD Thousands
- TABLE 69 Rest of North America Face Balm Market, 2018 - 2021, USD Thousands
- TABLE 70 Rest of North America Face Balm Market, 2022 - 2028, USD Thousands
- TABLE 71 Rest of North America Face Balm Market by Application, 2018 - 2021, USD Thousands
- TABLE 72 Rest of North America Face Balm Market by Application, 2022 - 2028, USD Thousands
- TABLE 73 Rest of North America Face Balm Market by End Use, 2018 - 2021, USD Thousands
- TABLE 74 Rest of North America Face Balm Market by End Use, 2022 - 2028, USD Thousands
- TABLE 75 Rest of North America Face Balm Market by Distribution Channel, 2018 - 2021, USD Thousands
- TABLE 76 Rest of North America Face Balm Market by Distribution Channel, 2022 - 2028, USD Thousands
- TABLE 77 Europe Face Balm Market, 2018 - 2021, USD Thousands
- TABLE 78 Europe Face Balm Market, 2022 - 2028, USD Thousands
- TABLE 79 Europe Face Balm Market by Application, 2018 - 2021, USD Thousands
- TABLE 80 Europe Face Balm Market by Application, 2022 - 2028, USD Thousands
- TABLE 81 Europe Residential Market by Country, 2018 - 2021, USD Thousands
- TABLE 82 Europe Residential Market by Country, 2022 - 2028, USD Thousands
- TABLE 83 Europe Commercial Market by Country, 2018 - 2021, USD Thousands
- TABLE 84 Europe Commercial Market by Country, 2022 - 2028, USD Thousands
- TABLE 85 Europe Face Balm Market by End Use, 2018 - 2021, USD Thousands
- TABLE 86 Europe Face Balm Market by End Use, 2022 - 2028, USD Thousands
- TABLE 87 Europe Women Market by Country, 2018 - 2021, USD Thousands
- TABLE 88 Europe Women Market by Country, 2022 - 2028, USD Thousands
- TABLE 89 Europe Men Market by Country, 2018 - 2021, USD Thousands
- TABLE 90 Europe Men Market by Country, 2022 - 2028, USD Thousands
- TABLE 91 Europe Face Balm Market by Distribution Channel, 2018 - 2021, USD Thousands
- TABLE 92 Europe Face Balm Market by Distribution Channel, 2022 - 2028, USD Thousands
- TABLE 93 Europe Offline Market by Country, 2018 - 2021, USD Thousands
- TABLE 94 Europe Offline Market by Country, 2022 - 2028, USD Thousands
- TABLE 95 Europe Online Market by Country, 2018 - 2021, USD Thousands
- TABLE 96 Europe Online Market by Country, 2022 - 2028, USD Thousands
- TABLE 97 Europe Face Balm Market by Country, 2018 - 2021, USD Thousands
- TABLE 98 Europe Face Balm Market by Country, 2022 - 2028, USD Thousands
- TABLE 99 Germany Face Balm Market, 2018 - 2021, USD Thousands
- TABLE 100 Germany Face Balm Market, 2022 - 2028, USD Thousands
- TABLE 101 Germany Face Balm Market by Application, 2018 - 2021, USD Thousands
- TABLE 102 Germany Face Balm Market by Application, 2022 - 2028, USD Thousands
- TABLE 103 Germany Face Balm Market by End Use, 2018 - 2021, USD Thousands
- TABLE 104 Germany Face Balm Market by End Use, 2022 - 2028, USD Thousands
- TABLE 105 Germany Face Balm Market by Distribution Channel, 2018 - 2021, USD Thousands
- TABLE 106 Germany Face Balm Market by Distribution Channel, 2022 - 2028, USD Thousands
- TABLE 107 UK Face Balm Market, 2018 - 2021, USD Thousands
- TABLE 108 UK Face Balm Market, 2022 - 2028, USD Thousands
- TABLE 109 UK Face Balm Market by Application, 2018 - 2021, USD Thousands
- TABLE 110 UK Face Balm Market by Application, 2022 - 2028, USD Thousands
- TABLE 111 UK Face Balm Market by End Use, 2018 - 2021, USD Thousands
- TABLE 112 UK Face Balm Market by End Use, 2022 - 2028, USD Thousands
- TABLE 113 UK Face Balm Market by Distribution Channel, 2018 - 2021, USD Thousands
- TABLE 114 UK Face Balm Market by Distribution Channel, 2022 - 2028, USD Thousands
- TABLE 115 France Face Balm Market, 2018 - 2021, USD Thousands
- TABLE 116 France Face Balm Market, 2022 - 2028, USD Thousands
- TABLE 117 France Face Balm Market by Application, 2018 - 2021, USD Thousands
- TABLE 118 France Face Balm Market by Application, 2022 - 2028, USD Thousands
- TABLE 119 France Face Balm Market by End Use, 2018 - 2021, USD Thousands
- TABLE 120 France Face Balm Market by End Use, 2022 - 2028, USD Thousands
- TABLE 121 France Face Balm Market by Distribution Channel, 2018 - 2021, USD Thousands
- TABLE 122 France Face Balm Market by Distribution Channel, 2022 - 2028, USD Thousands
- TABLE 123 Russia Face Balm Market, 2018 - 2021, USD Thousands
- TABLE 124 Russia Face Balm Market, 2022 - 2028, USD Thousands
- TABLE 125 Russia Face Balm Market by Application, 2018 - 2021, USD Thousands
- TABLE 126 Russia Face Balm Market by Application, 2022 - 2028, USD Thousands
- TABLE 127 Russia Face Balm Market by End Use, 2018 - 2021, USD Thousands
- TABLE 128 Russia Face Balm Market by End Use, 2022 - 2028, USD Thousands
- TABLE 129 Russia Face Balm Market by Distribution Channel, 2018 - 2021, USD Thousands
- TABLE 130 Russia Face Balm Market by Distribution Channel, 2022 - 2028, USD Thousands
- TABLE 131 Spain Face Balm Market, 2018 - 2021, USD Thousands
- TABLE 132 Spain Face Balm Market, 2022 - 2028, USD Thousands
- TABLE 133 Spain Face Balm Market by Application, 2018 - 2021, USD Thousands
- TABLE 134 Spain Face Balm Market by Application, 2022 - 2028, USD Thousands
- TABLE 135 Spain Face Balm Market by End Use, 2018 - 2021, USD Thousands
- TABLE 136 Spain Face Balm Market by End Use, 2022 - 2028, USD Thousands
- TABLE 137 Spain Face Balm Market by Distribution Channel, 2018 - 2021, USD Thousands
- TABLE 138 Spain Face Balm Market by Distribution Channel, 2022 - 2028, USD Thousands
- TABLE 139 Italy Face Balm Market, 2018 - 2021, USD Thousands
- TABLE 140 Italy Face Balm Market, 2022 - 2028, USD Thousands
- TABLE 141 Italy Face Balm Market by Application, 2018 - 2021, USD Thousands
- TABLE 142 Italy Face Balm Market by Application, 2022 - 2028, USD Thousands
- TABLE 143 Italy Face Balm Market by End Use, 2018 - 2021, USD Thousands
- TABLE 144 Italy Face Balm Market by End Use, 2022 - 2028, USD Thousands
- TABLE 145 Italy Face Balm Market by Distribution Channel, 2018 - 2021, USD Thousands
- TABLE 146 Italy Face Balm Market by Distribution Channel, 2022 - 2028, USD Thousands
- TABLE 147 Rest of Europe Face Balm Market, 2018 - 2021, USD Thousands
- TABLE 148 Rest of Europe Face Balm Market, 2022 - 2028, USD Thousands
- TABLE 149 Rest of Europe Face Balm Market by Application, 2018 - 2021, USD Thousands
- TABLE 150 Rest of Europe Face Balm Market by Application, 2022 - 2028, USD Thousands
- TABLE 151 Rest of Europe Face Balm Market by End Use, 2018 - 2021, USD Thousands
- TABLE 152 Rest of Europe Face Balm Market by End Use, 2022 - 2028, USD Thousands
- TABLE 153 Rest of Europe Face Balm Market by Distribution Channel, 2018 - 2021, USD Thousands
- TABLE 154 Rest of Europe Face Balm Market by Distribution Channel, 2022 - 2028, USD Thousands
- TABLE 155 Asia Pacific Face Balm Market, 2018 - 2021, USD Thousands
- TABLE 156 Asia Pacific Face Balm Market, 2022 - 2028, USD Thousands
- TABLE 157 Asia Pacific Face Balm Market by Application, 2018 - 2021, USD Thousands
- TABLE 158 Asia Pacific Face Balm Market by Application, 2022 - 2028, USD Thousands
- TABLE 159 Asia Pacific Residential Market by Country, 2018 - 2021, USD Thousands
- TABLE 160 Asia Pacific Residential Market by Country, 2022 - 2028, USD Thousands
- TABLE 161 Asia Pacific Commercial Market by Country, 2018 - 2021, USD Thousands
- TABLE 162 Asia Pacific Commercial Market by Country, 2022 - 2028, USD Thousands
- TABLE 163 Asia Pacific Face Balm Market by End Use, 2018 - 2021, USD Thousands
- TABLE 164 Asia Pacific Face Balm Market by End Use, 2022 - 2028, USD Thousands
- TABLE 165 Asia Pacific Women Market by Country, 2018 - 2021, USD Thousands
- TABLE 166 Asia Pacific Women Market by Country, 2022 - 2028, USD Thousands
- TABLE 167 Asia Pacific Men Market by Country, 2018 - 2021, USD Thousands
- TABLE 168 Asia Pacific Men Market by Country, 2022 - 2028, USD Thousands
- TABLE 169 Asia Pacific Face Balm Market by Distribution Channel, 2018 - 2021, USD Thousands
- TABLE 170 Asia Pacific Face Balm Market by Distribution Channel, 2022 - 2028, USD Thousands
- TABLE 171 Asia Pacific Offline Market by Country, 2018 - 2021, USD Thousands
- TABLE 172 Asia Pacific Offline Market by Country, 2022 - 2028, USD Thousands
- TABLE 173 Asia Pacific Online Market by Country, 2018 - 2021, USD Thousands
- TABLE 174 Asia Pacific Online Market by Country, 2022 - 2028, USD Thousands
- TABLE 175 Asia Pacific Face Balm Market by Country, 2018 - 2021, USD Thousands
- TABLE 176 Asia Pacific Face Balm Market by Country, 2022 - 2028, USD Thousands
- TABLE 177 China Face Balm Market, 2018 - 2021, USD Thousands
- TABLE 178 China Face Balm Market, 2022 - 2028, USD Thousands
- TABLE 179 China Face Balm Market by Application, 2018 - 2021, USD Thousands
- TABLE 180 China Face Balm Market by Application, 2022 - 2028, USD Thousands
- TABLE 181 China Face Balm Market by End Use, 2018 - 2021, USD Thousands
- TABLE 182 China Face Balm Market by End Use, 2022 - 2028, USD Thousands
- TABLE 183 China Face Balm Market by Distribution Channel, 2018 - 2021, USD Thousands
- TABLE 184 China Face Balm Market by Distribution Channel, 2022 - 2028, USD Thousands
- TABLE 185 Japan Face Balm Market, 2018 - 2021, USD Thousands
- TABLE 186 Japan Face Balm Market, 2022 - 2028, USD Thousands
- TABLE 187 Japan Face Balm Market by Application, 2018 - 2021, USD Thousands
- TABLE 188 Japan Face Balm Market by Application, 2022 - 2028, USD Thousands
- TABLE 189 Japan Face Balm Market by End Use, 2018 - 2021, USD Thousands
- TABLE 190 Japan Face Balm Market by End Use, 2022 - 2028, USD Thousands
- TABLE 191 Japan Face Balm Market by Distribution Channel, 2018 - 2021, USD Thousands
- TABLE 192 Japan Face Balm Market by Distribution Channel, 2022 - 2028, USD Thousands
- TABLE 193 India Face Balm Market, 2018 - 2021, USD Thousands
- TABLE 194 India Face Balm Market, 2022 - 2028, USD Thousands
- TABLE 195 India Face Balm Market by Application, 2018 - 2021, USD Thousands
- TABLE 196 India Face Balm Market by Application, 2022 - 2028, USD Thousands
- TABLE 197 India Face Balm Market by End Use, 2018 - 2021, USD Thousands
- TABLE 198 India Face Balm Market by End Use, 2022 - 2028, USD Thousands
- TABLE 199 India Face Balm Market by Distribution Channel, 2018 - 2021, USD Thousands
- TABLE 200 India Face Balm Market by Distribution Channel, 2022 - 2028, USD Thousands
- TABLE 201 South Korea Face Balm Market, 2018 - 2021, USD Thousands
- TABLE 202 South Korea Face Balm Market, 2022 - 2028, USD Thousands
- TABLE 203 South Korea Face Balm Market by Application, 2018 - 2021, USD Thousands
- TABLE 204 South Korea Face Balm Market by Application, 2022 - 2028, USD Thousands
- TABLE 205 South Korea Face Balm Market by End Use, 2018 - 2021, USD Thousands
- TABLE 206 South Korea Face Balm Market by End Use, 2022 - 2028, USD Thousands
- TABLE 207 South Korea Face Balm Market by Distribution Channel, 2018 - 2021, USD Thousands
- TABLE 208 South Korea Face Balm Market by Distribution Channel, 2022 - 2028, USD Thousands
- TABLE 209 Singapore Face Balm Market, 2018 - 2021, USD Thousands
- TABLE 210 Singapore Face Balm Market, 2022 - 2028, USD Thousands
- TABLE 211 Singapore Face Balm Market by Application, 2018 - 2021, USD Thousands
- TABLE 212 Singapore Face Balm Market by Application, 2022 - 2028, USD Thousands
- TABLE 213 Singapore Face Balm Market by End Use, 2018 - 2021, USD Thousands
- TABLE 214 Singapore Face Balm Market by End Use, 2022 - 2028, USD Thousands
- TABLE 215 Singapore Face Balm Market by Distribution Channel, 2018 - 2021, USD Thousands
- TABLE 216 Singapore Face Balm Market by Distribution Channel, 2022 - 2028, USD Thousands
- TABLE 217 Malaysia Face Balm Market, 2018 - 2021, USD Thousands
- TABLE 218 Malaysia Face Balm Market, 2022 - 2028, USD Thousands
- TABLE 219 Malaysia Face Balm Market by Application, 2018 - 2021, USD Thousands
- TABLE 220 Malaysia Face Balm Market by Application, 2022 - 2028, USD Thousands
- TABLE 221 Malaysia Face Balm Market by End Use, 2018 - 2021, USD Thousands
- TABLE 222 Malaysia Face Balm Market by End Use, 2022 - 2028, USD Thousands
- TABLE 223 Malaysia Face Balm Market by Distribution Channel, 2018 - 2021, USD Thousands
- TABLE 224 Malaysia Face Balm Market by Distribution Channel, 2022 - 2028, USD Thousands
- TABLE 225 Rest of Asia Pacific Face Balm Market, 2018 - 2021, USD Thousands
- TABLE 226 Rest of Asia Pacific Face Balm Market, 2022 - 2028, USD Thousands
- TABLE 227 Rest of Asia Pacific Face Balm Market by Application, 2018 - 2021, USD Thousands
- TABLE 228 Rest of Asia Pacific Face Balm Market by Application, 2022 - 2028, USD Thousands
- TABLE 229 Rest of Asia Pacific Face Balm Market by End Use, 2018 - 2021, USD Thousands
- TABLE 230 Rest of Asia Pacific Face Balm Market by End Use, 2022 - 2028, USD Thousands
- TABLE 231 Rest of Asia Pacific Face Balm Market by Distribution Channel, 2018 - 2021, USD Thousands
- TABLE 232 Rest of Asia Pacific Face Balm Market by Distribution Channel, 2022 - 2028, USD Thousands
- TABLE 233 LAMEA Face Balm Market, 2018 - 2021, USD Thousands
- TABLE 234 LAMEA Face Balm Market, 2022 - 2028, USD Thousands
- TABLE 235 LAMEA Face Balm Market by Application, 2018 - 2021, USD Thousands
- TABLE 236 LAMEA Face Balm Market by Application, 2022 - 2028, USD Thousands
- TABLE 237 LAMEA Residential Market by Country, 2018 - 2021, USD Thousands
- TABLE 238 LAMEA Residential Market by Country, 2022 - 2028, USD Thousands
- TABLE 239 LAMEA Commercial Market by Country, 2018 - 2021, USD Thousands
- TABLE 240 LAMEA Commercial Market by Country, 2022 - 2028, USD Thousands
- TABLE 241 LAMEA Face Balm Market by End Use, 2018 - 2021, USD Thousands
- TABLE 242 LAMEA Face Balm Market by End Use, 2022 - 2028, USD Thousands
- TABLE 243 LAMEA Women Market by Country, 2018 - 2021, USD Thousands
- TABLE 244 LAMEA Women Market by Country, 2022 - 2028, USD Thousands
- TABLE 245 LAMEA Men Market by Country, 2018 - 2021, USD Thousands
- TABLE 246 LAMEA Men Market by Country, 2022 - 2028, USD Thousands
- TABLE 247 LAMEA Face Balm Market by Distribution Channel, 2018 - 2021, USD Thousands
- TABLE 248 LAMEA Face Balm Market by Distribution Channel, 2022 - 2028, USD Thousands
- TABLE 249 LAMEA Offline Market by Country, 2018 - 2021, USD Thousands
- TABLE 250 LAMEA Offline Market by Country, 2022 - 2028, USD Thousands
- TABLE 251 LAMEA Online Market by Country, 2018 - 2021, USD Thousands
- TABLE 252 LAMEA Online Market by Country, 2022 - 2028, USD Thousands
- TABLE 253 LAMEA Face Balm Market by Country, 2018 - 2021, USD Thousands
- TABLE 254 LAMEA Face Balm Market by Country, 2022 - 2028, USD Thousands
- TABLE 255 Brazil Face Balm Market, 2018 - 2021, USD Thousands
- TABLE 256 Brazil Face Balm Market, 2022 - 2028, USD Thousands
- TABLE 257 Brazil Face Balm Market by Application, 2018 - 2021, USD Thousands
- TABLE 258 Brazil Face Balm Market by Application, 2022 - 2028, USD Thousands
- TABLE 259 Brazil Face Balm Market by End Use, 2018 - 2021, USD Thousands
- TABLE 260 Brazil Face Balm Market by End Use, 2022 - 2028, USD Thousands
- TABLE 261 Brazil Face Balm Market by Distribution Channel, 2018 - 2021, USD Thousands
- TABLE 262 Brazil Face Balm Market by Distribution Channel, 2022 - 2028, USD Thousands
- TABLE 263 Argentina Face Balm Market, 2018 - 2021, USD Thousands
- TABLE 264 Argentina Face Balm Market, 2022 - 2028, USD Thousands
- TABLE 265 Argentina Face Balm Market by Application, 2018 - 2021, USD Thousands
- TABLE 266 Argentina Face Balm Market by Application, 2022 - 2028, USD Thousands
- TABLE 267 Argentina Face Balm Market by End Use, 2018 - 2021, USD Thousands
- TABLE 268 Argentina Face Balm Market by End Use, 2022 - 2028, USD Thousands
- TABLE 269 Argentina Face Balm Market by Distribution Channel, 2018 - 2021, USD Thousands
- TABLE 270 Argentina Face Balm Market by Distribution Channel, 2022 - 2028, USD Thousands
- TABLE 271 UAE Face Balm Market, 2018 - 2021, USD Thousands
- TABLE 272 UAE Face Balm Market, 2022 - 2028, USD Thousands
- TABLE 273 UAE Face Balm Market by Application, 2018 - 2021, USD Thousands
- TABLE 274 UAE Face Balm Market by Application, 2022 - 2028, USD Thousands
- TABLE 275 UAE Face Balm Market by End Use, 2018 - 2021, USD Thousands
- TABLE 276 UAE Face Balm Market by End Use, 2022 - 2028, USD Thousands
- TABLE 277 UAE Face Balm Market by Distribution Channel, 2018 - 2021, USD Thousands
- TABLE 278 UAE Face Balm Market by Distribution Channel, 2022 - 2028, USD Thousands
- TABLE 279 Saudi Arabia Face Balm Market, 2018 - 2021, USD Thousands
- TABLE 280 Saudi Arabia Face Balm Market, 2022 - 2028, USD Thousands
- TABLE 281 Saudi Arabia Face Balm Market by Application, 2018 - 2021, USD Thousands
- TABLE 282 Saudi Arabia Face Balm Market by Application, 2022 - 2028, USD Thousands
- TABLE 283 Saudi Arabia Face Balm Market by End Use, 2018 - 2021, USD Thousands
- TABLE 284 Saudi Arabia Face Balm Market by End Use, 2022 - 2028, USD Thousands
- TABLE 285 Saudi Arabia Face Balm Market by Distribution Channel, 2018 - 2021, USD Thousands
- TABLE 286 Saudi Arabia Face Balm Market by Distribution Channel, 2022 - 2028, USD Thousands
- TABLE 287 South Africa Face Balm Market, 2018 - 2021, USD Thousands
- TABLE 288 South Africa Face Balm Market, 2022 - 2028, USD Thousands
- TABLE 289 South Africa Face Balm Market by Application, 2018 - 2021, USD Thousands
- TABLE 290 South Africa Face Balm Market by Application, 2022 - 2028, USD Thousands
- TABLE 291 South Africa Face Balm Market by End Use, 2018 - 2021, USD Thousands
- TABLE 292 South Africa Face Balm Market by End Use, 2022 - 2028, USD Thousands
- TABLE 293 South Africa Face Balm Market by Distribution Channel, 2018 - 2021, USD Thousands
- TABLE 294 South Africa Face Balm Market by Distribution Channel, 2022 - 2028, USD Thousands
- TABLE 295 Nigeria Face Balm Market, 2018 - 2021, USD Thousands
- TABLE 296 Nigeria Face Balm Market, 2022 - 2028, USD Thousands
- TABLE 297 Nigeria Face Balm Market by Application, 2018 - 2021, USD Thousands
- TABLE 298 Nigeria Face Balm Market by Application, 2022 - 2028, USD Thousands
- TABLE 299 Nigeria Face Balm Market by End Use, 2018 - 2021, USD Thousands
- TABLE 300 Nigeria Face Balm Market by End Use, 2022 - 2028, USD Thousands
- TABLE 301 Nigeria Face Balm Market by Distribution Channel, 2018 - 2021, USD Thousands
- TABLE 302 Nigeria Face Balm Market by Distribution Channel, 2022 - 2028, USD Thousands
- TABLE 303 Rest of LAMEA Face Balm Market, 2018 - 2021, USD Thousands
- TABLE 304 Rest of LAMEA Face Balm Market, 2022 - 2028, USD Thousands
- TABLE 305 Rest of LAMEA Face Balm Market by Application, 2018 - 2021, USD Thousands
- TABLE 306 Rest of LAMEA Face Balm Market by Application, 2022 - 2028, USD Thousands
- TABLE 307 Rest of LAMEA Face Balm Market by End Use, 2018 - 2021, USD Thousands
- TABLE 308 Rest of LAMEA Face Balm Market by End Use, 2022 - 2028, USD Thousands
- TABLE 309 Rest of LAMEA Face Balm Market by Distribution Channel, 2018 - 2021, USD Thousands
- TABLE 310 Rest of LAMEA Face Balm Market by Distribution Channel, 2022 - 2028, USD Thousands
- TABLE 311 Key Information - L'Oreal Group
- TABLE 312 Key Information - Unilever PLC
- TABLE 313 Key Information - Weleda AG
- TABLE 314 Key Information - Pangaea Holdings, Inc.
- TABLE 315 Key Information - Naturium
- TABLE 316 Key Information - Pinch of Colour LLC
- TABLE 317 Key Information - UpCircle Beauty
- TABLE 318 Key Information - W.S. Badger Company, Inc.
List of Figures
- FIG 1 Methodology for the research
- FIG 2 Global Face Balm Market share by Application, 2021
- FIG 3 Global Face Balm Market share by Application, 2028
- FIG 4 Global Face Balm Market by Application, 2018 - 2028, USD Thousands
- FIG 5 Global Face Balm Market share by End Use, 2021
- FIG 6 Global Face Balm Market share by End Use, 2028
- FIG 7 Global Face Balm Market by End Use, 2018 - 2028, USD Thousands
- FIG 8 Global Face Balm Market share by Distribution Channel, 2021
- FIG 9 Global Face Balm Market share by Distribution Channel, 2028
- FIG 10 Global Face Balm Market by Distribution Channel, 2018 - 2028, USD Thousands
- FIG 11 Global Face Balm Market share by Region, 2021
- FIG 12 Global Face Balm Market share by Region, 2028
- FIG 13 Global Face Balm Market by Region, 2018 - 2028, USD Thousands
- FIG 14 SWOT Analysis: L'Oreal Group
The Global Face Balm Market size is expected to reach $334.5 Million by 2028, rising at a market growth of 8.7% CAGR during the forecast period.
Face balm is a type of thick balm that is used to nourish, heal, and protect the skin on the face. There are many different face balm formulations available to treat different skin types and skin issues. Face balms are frequently gender-neutral, but those that do contain fragrance are designed to appeal to both men and women who enjoy different kinds of scents. The weight and thickness of the face balm allow it to be identified from other forms of moisturizers.
The strongest moisturizer is usually a balm, which is made of wax or oil and normally doesn't include any water. In order to address blemishes, abrasions, and skin damage brought on by aging, exposure to the sun or weather, and other reasons, face balms are applied to the skin. In order to give the face a more beautiful appearance, face balms are also used as face cleaners. Face cleansing products help remove unwanted dead cells and impurity materials by clearing the cell pour as they are being used. To improve facial beauty, cleansing balms moisturize and nourish the skin.
The predicted growth of the face balm market is due to the proliferation of the product's demand on a global scale. Additionally, as the waterless beauty trend gains hold, sales of cosmetics have soared. Independent companies have done a lot to advance the idea of waterless cosmetics. Positive consumer reactions further encouraged luxury and mass-market businesses to broaden their business horizons in waterless beauty, which in turn fueled the face balm industry's expansion.
Additionally, appealing marketing strategies and new packaging trends are the main factors driving the face balm market demand. Additionally, using natural ingredients in the creation of skin-safe cosmetics and facial care products is a frequent strategy employed by manufacturers to attract more clients. This helps to increase the revenue of companies operating in this industry. The makers' collaborative employment of these techniques has led to an increase in market trends for face balm.
COVID-19 Impact Analysis
In many parts of the world, the COVID-19 pandemic compelled an immediate lockdown to stop the virus from spreading, leading to the swift shutdown of factories, stores, and other businesses. Travel restrictions and a sharp decline in demand and supply have hurt the market for non-essential goods. Due to a manpower scarcity brought on by the global lockdown, manufacturers of skincare products were forced to close their production facilities. Additionally, a lot of cosmetics stores had to close due to the pandemic. Retail store closures brought about by severe lockdown measures also had disastrous effects, with sales falling by a significant amount. As consumers spent less on cosmetics and personal care items, businesses positively addressed the situation by expanding their production capabilities and providing hand sanitizers and cleaning supplies.
Market Growth Factors
Rising expenditure from major market players
Research and development (R&D), as well as advertising and promotions, are what drives the whole cosmetics business. Key parties are making significant investments in these components to affect customer purchasing behavior and raise product appeal in the retail environment. Additionally, the growing use of the internet in underdeveloped countries has changed how major corporations approach their advertising budgeting. The "major shift" that the main players are undergoing is causing them to spend more on advertising and promotions in reaction to the globalization of society. During the projection period, all of this is expected to assist the market expansion around the world.
Rising awareness of skincare products constituents
There are many topical treatments like balms that treat or stop the signs of ageing. Retinol is crucial for minimizing the effects of ageing. Retinol, an active form of vitamin A, is another type that can be detected. By replenishing vitamin, A in the body, retinol and retinoic acid aid to improve cell regeneration, build collagen, lessen discoloration, and repair wrinkles. Another key ingredient in anti-aging skincare products, antioxidants support skin healing and repair in aged skin. However, prevention is the main anti-aging benefit. During the projection period, all of this is expected to assist the market expansion around the world.
Market Restraining Factors
Side effects of using low grade products
A decent face cream will often cost a little bit more, but certain well-known brands have been in the facial skincare business for a long time because of their excellent outcomes. The user may experience skin irritation and dryness when they use the wrong face balm or when it's difficult to discover one that's perfect for them. Some facial balms have oils in them that stop water from evaporating, which can clog pores and lead to acne. These oils include petrolatum and lanolin. All of this may limit the use of face balms and hence limit market expansion.
Application Outlook
Based on application, the face balm market is categorized as commercial and residential. The residential segment held the highest revenue share in the face balm market in 2021. As people become increasingly aware of the advantages of using face balms, household use of cosmetics for personal use is increasing. Customers have been urged to use face balm every day to shield their skin from damage caused by dust, air pollution, and direct sun exposure. Worldwide, the personal use of people by individuals dominates a sizeable percentage of the cosmetics industry.
End Use Outlook
On the basis of end use, the face balm market is segmented into men and women. The men segment recorded a significant revenue share in the face balm market in 2021. The market for men's skincare is expanding mostly due to rising disposable income, product releases, celebrity endorsements, and male consumers' increasing awareness of personal cleanliness and regular grooming. As a result, men are increasingly interested in specialty skincare products like anti-aging and sun protection creams in addition to more general grooming essentials like deodorants, razors, and face wash. In the near future, men's demand for sunscreen and anti-aging products is anticipated to increase significantly.
Distribution Channel Outlook
Based on distribution channel, the face balm market is divided into online and offline. The offline segment generated the maximum revenue share in the face balm market in 2021. Manufacturers consistently strive to increase the visibility of their products on store shelves; as a result, they concentrate primarily on offline sales. As a result, face balms and other facial care products are available offline in greater numbers. Additionally, the market is expanding as a result of the widespread accessibility of face balms at offline cosmetic stores.
Regional Outlook
On the basis of region, the face balm market is analyzed across North America, Europe, Asia Pacific, and LAMEA. The Asia-Pacific region led the face balm market by generating maximum revenue share in the face balm market in 2021. With a highly developed infrastructure and a sizable research and development base, the region will be able to control the global market in terms of revenue for the predicted amount of time. The worldwide cosmetics industry is one of the most diverse and active markets. Skin care, sun protection, moisturizers, and various types of face balms are some of the most popular cosmetic product categories in the region.
The market research report covers the analysis of key stake holders of the market. Key companies profiled in the report include Unilever PLC (REN Clean Skincare), L'Oreal Group (CeraVe), Weleda AG, Pangaea Holdings, Inc., Naturium, Pinch of Colour LLC, UpCircle Beauty, and W.S. Badger Company, Inc.
Scope of the Study
Market Segments covered in the Report:
By Application
- Residential
- Commercial
By End Use
- Women
- Men
By Distribution Channel
- Offline
- Online
By Geography
- North America
- US
- Canada
- Mexico
- Rest of North America
- Europe
- Germany
- UK
- France
- Russia
- Spain
- Italy
- Rest of Europe
- Asia Pacific
- China
- Japan
- India
- South Korea
- Singapore
- Malaysia
- Rest of Asia Pacific
- LAMEA
- Brazil
- Argentina
- UAE
- Saudi Arabia
- South Africa
- Nigeria
- Rest of LAMEA
Companies Profiled
- Unilever PLC (REN Clean Skincare)
- L'Oreal Group (CeraVe)
- Weleda AG
- Pangaea Holdings, Inc.
- Naturium
- Pinch of Colour LLC
- UpCircle Beauty
- W.S. Badger Company, Inc.
Unique Offerings from KBV Research
- Exhaustive coverage
- Highest number of market tables and figures
- Subscription based model available
- Guaranteed best price
- Assured post sales research support with 10% customization free
Table of Contents
Chapter 1. Market Scope & Methodology
- 1.1 Market Definition
- 1.2 Objectives
- 1.3 Market Scope
- 1.4 Segmentation
- 1.4.1 Global Face Balm Market, by Application
- 1.4.2 Global Face Balm Market, by End Use
- 1.4.3 Global Face Balm Market, by Distribution Channel
- 1.4.4 Global Face Balm Market, by Geography
- 1.5 Methodology for the research
Chapter 2. Market Overview
- 2.1 Introduction
- 2.1.1 Overview
- 2.1.1.1 Market Composition & Scenario
- 2.1.1 Overview
- 2.2 Key Factors Impacting the Market
- 2.2.1 Market Drivers
- 2.2.2 Market Restraints
Chapter 3. Global Face Balm Market by Application
- 3.1 Global Residential Market by Region
- 3.2 Global Commercial Market by Region
Chapter 4. Global Face Balm Market by End Use
- 4.1 Global Women Market by Region
- 4.2 Global Men Market by Region
Chapter 5. Global Face Balm Market by Distribution Channel
- 5.1 Global Offline Market by Region
- 5.2 Global Online Market by Region
Chapter 6. Global Face Balm Market by Region
- 6.1 North America Face Balm Market
- 6.1.1 North America Face Balm Market by Application
- 6.1.1.1 North America Residential Market by Country
- 6.1.1.2 North America Commercial Market by Country
- 6.1.2 North America Face Balm Market by End Use
- 6.1.2.1 North America Women Market by Country
- 6.1.2.2 North America Men Market by Country
- 6.1.3 North America Face Balm Market by Distribution Channel
- 6.1.3.1 North America Offline Market by Country
- 6.1.3.2 North America Online Market by Country
- 6.1.4 North America Face Balm Market by Country
- 6.1.4.1 US Face Balm Market
- 6.1.4.1.1 US Face Balm Market by Application
- 6.1.4.1.2 US Face Balm Market by End Use
- 6.1.4.1.3 US Face Balm Market by Distribution Channel
- 6.1.4.2 Canada Face Balm Market
- 6.1.4.2.1 Canada Face Balm Market by Application
- 6.1.4.2.2 Canada Face Balm Market by End Use
- 6.1.4.2.3 Canada Face Balm Market by Distribution Channel
- 6.1.4.3 Mexico Face Balm Market
- 6.1.4.3.1 Mexico Face Balm Market by Application
- 6.1.4.3.2 Mexico Face Balm Market by End Use
- 6.1.4.3.3 Mexico Face Balm Market by Distribution Channel
- 6.1.4.4 Rest of North America Face Balm Market
- 6.1.4.4.1 Rest of North America Face Balm Market by Application
- 6.1.4.4.2 Rest of North America Face Balm Market by End Use
- 6.1.4.4.3 Rest of North America Face Balm Market by Distribution Channel
- 6.1.4.1 US Face Balm Market
- 6.1.1 North America Face Balm Market by Application
- 6.2 Europe Face Balm Market
- 6.2.1 Europe Face Balm Market by Application
- 6.2.1.1 Europe Residential Market by Country
- 6.2.1.2 Europe Commercial Market by Country
- 6.2.2 Europe Face Balm Market by End Use
- 6.2.2.1 Europe Women Market by Country
- 6.2.2.2 Europe Men Market by Country
- 6.2.3 Europe Face Balm Market by Distribution Channel
- 6.2.3.1 Europe Offline Market by Country
- 6.2.3.2 Europe Online Market by Country
- 6.2.4 Europe Face Balm Market by Country
- 6.2.4.1 Germany Face Balm Market
- 6.2.4.1.1 Germany Face Balm Market by Application
- 6.2.4.1.2 Germany Face Balm Market by End Use
- 6.2.4.1.3 Germany Face Balm Market by Distribution Channel
- 6.2.4.2 UK Face Balm Market
- 6.2.4.2.1 UK Face Balm Market by Application
- 6.2.4.2.2 UK Face Balm Market by End Use
- 6.2.4.2.3 UK Face Balm Market by Distribution Channel
- 6.2.4.3 France Face Balm Market
- 6.2.4.3.1 France Face Balm Market by Application
- 6.2.4.3.2 France Face Balm Market by End Use
- 6.2.4.3.3 France Face Balm Market by Distribution Channel
- 6.2.4.4 Russia Face Balm Market
- 6.2.4.4.1 Russia Face Balm Market by Application
- 6.2.4.4.2 Russia Face Balm Market by End Use
- 6.2.4.4.3 Russia Face Balm Market by Distribution Channel
- 6.2.4.5 Spain Face Balm Market
- 6.2.4.5.1 Spain Face Balm Market by Application
- 6.2.4.5.2 Spain Face Balm Market by End Use
- 6.2.4.5.3 Spain Face Balm Market by Distribution Channel
- 6.2.4.6 Italy Face Balm Market
- 6.2.4.6.1 Italy Face Balm Market by Application
- 6.2.4.6.2 Italy Face Balm Market by End Use
- 6.2.4.6.3 Italy Face Balm Market by Distribution Channel
- 6.2.4.7 Rest of Europe Face Balm Market
- 6.2.4.7.1 Rest of Europe Face Balm Market by Application
- 6.2.4.7.2 Rest of Europe Face Balm Market by End Use
- 6.2.4.7.3 Rest of Europe Face Balm Market by Distribution Channel
- 6.2.4.1 Germany Face Balm Market
- 6.2.1 Europe Face Balm Market by Application
- 6.3 Asia Pacific Face Balm Market
- 6.3.1 Asia Pacific Face Balm Market by Application
- 6.3.1.1 Asia Pacific Residential Market by Country
- 6.3.1.2 Asia Pacific Commercial Market by Country
- 6.3.2 Asia Pacific Face Balm Market by End Use
- 6.3.2.1 Asia Pacific Women Market by Country
- 6.3.2.2 Asia Pacific Men Market by Country
- 6.3.3 Asia Pacific Face Balm Market by Distribution Channel
- 6.3.3.1 Asia Pacific Offline Market by Country
- 6.3.3.2 Asia Pacific Online Market by Country
- 6.3.4 Asia Pacific Face Balm Market by Country
- 6.3.4.1 China Face Balm Market
- 6.3.4.1.1 China Face Balm Market by Application
- 6.3.4.1.2 China Face Balm Market by End Use
- 6.3.4.1.3 China Face Balm Market by Distribution Channel
- 6.3.4.2 Japan Face Balm Market
- 6.3.4.2.1 Japan Face Balm Market by Application
- 6.3.4.2.2 Japan Face Balm Market by End Use
- 6.3.4.2.3 Japan Face Balm Market by Distribution Channel
- 6.3.4.3 India Face Balm Market
- 6.3.4.3.1 India Face Balm Market by Application
- 6.3.4.3.2 India Face Balm Market by End Use
- 6.3.4.3.3 India Face Balm Market by Distribution Channel
- 6.3.4.4 South Korea Face Balm Market
- 6.3.4.4.1 South Korea Face Balm Market by Application
- 6.3.4.4.2 South Korea Face Balm Market by End Use
- 6.3.4.4.3 South Korea Face Balm Market by Distribution Channel
- 6.3.4.5 Singapore Face Balm Market
- 6.3.4.5.1 Singapore Face Balm Market by Application
- 6.3.4.5.2 Singapore Face Balm Market by End Use
- 6.3.4.5.3 Singapore Face Balm Market by Distribution Channel
- 6.3.4.6 Malaysia Face Balm Market
- 6.3.4.6.1 Malaysia Face Balm Market by Application
- 6.3.4.6.2 Malaysia Face Balm Market by End Use
- 6.3.4.6.3 Malaysia Face Balm Market by Distribution Channel
- 6.3.4.7 Rest of Asia Pacific Face Balm Market
- 6.3.4.7.1 Rest of Asia Pacific Face Balm Market by Application
- 6.3.4.7.2 Rest of Asia Pacific Face Balm Market by End Use
- 6.3.4.7.3 Rest of Asia Pacific Face Balm Market by Distribution Channel
- 6.3.4.1 China Face Balm Market
- 6.3.1 Asia Pacific Face Balm Market by Application
- 6.4 LAMEA Face Balm Market
- 6.4.1 LAMEA Face Balm Market by Application
- 6.4.1.1 LAMEA Residential Market by Country
- 6.4.1.2 LAMEA Commercial Market by Country
- 6.4.2 LAMEA Face Balm Market by End Use
- 6.4.2.1 LAMEA Women Market by Country
- 6.4.2.2 LAMEA Men Market by Country
- 6.4.3 LAMEA Face Balm Market by Distribution Channel
- 6.4.3.1 LAMEA Offline Market by Country
- 6.4.3.2 LAMEA Online Market by Country
- 6.4.4 LAMEA Face Balm Market by Country
- 6.4.4.1 Brazil Face Balm Market
- 6.4.4.1.1 Brazil Face Balm Market by Application
- 6.4.4.1.2 Brazil Face Balm Market by End Use
- 6.4.4.1.3 Brazil Face Balm Market by Distribution Channel
- 6.4.4.2 Argentina Face Balm Market
- 6.4.4.2.1 Argentina Face Balm Market by Application
- 6.4.4.2.2 Argentina Face Balm Market by End Use
- 6.4.4.2.3 Argentina Face Balm Market by Distribution Channel
- 6.4.4.3 UAE Face Balm Market
- 6.4.4.3.1 UAE Face Balm Market by Application
- 6.4.4.3.2 UAE Face Balm Market by End Use
- 6.4.4.3.3 UAE Face Balm Market by Distribution Channel
- 6.4.4.4 Saudi Arabia Face Balm Market
- 6.4.4.4.1 Saudi Arabia Face Balm Market by Application
- 6.4.4.4.2 Saudi Arabia Face Balm Market by End Use
- 6.4.4.4.3 Saudi Arabia Face Balm Market by Distribution Channel
- 6.4.4.5 South Africa Face Balm Market
- 6.4.4.5.1 South Africa Face Balm Market by Application
- 6.4.4.5.2 South Africa Face Balm Market by End Use
- 6.4.4.5.3 South Africa Face Balm Market by Distribution Channel
- 6.4.4.6 Nigeria Face Balm Market
- 6.4.4.6.1 Nigeria Face Balm Market by Application
- 6.4.4.6.2 Nigeria Face Balm Market by End Use
- 6.4.4.6.3 Nigeria Face Balm Market by Distribution Channel
- 6.4.4.7 Rest of LAMEA Face Balm Market
- 6.4.4.7.1 Rest of LAMEA Face Balm Market by Application
- 6.4.4.7.2 Rest of LAMEA Face Balm Market by End Use
- 6.4.4.7.3 Rest of LAMEA Face Balm Market by Distribution Channel
- 6.4.4.1 Brazil Face Balm Market
- 6.4.1 LAMEA Face Balm Market by Application
Chapter 7. Company Profiles
- 7.1 L'Oreal Group (CeraVe)
- 7.1.1 Company Overview
- 7.1.2 Financial Analysis
- 7.1.3 Segmental and Regional Analysis
- 7.1.4 Recent strategies and developments:
- 7.1.4.1 Product Launches and Product Expansions:
- 7.1.5 SWOT Analysis
- 7.2 Unilever PLC (REN Clean Skincare)
- 7.2.1 Company Overview
- 7.2.2 Financial Analysis
- 7.2.3 Segmental and Regional Analysis
- 7.2.4 Research & Development Expense
- 7.3 Weleda AG
- 7.3.1 Company overview
- 7.3.2 Financial Analysis
- 7.3.3 Segmental and Regional Analysis
- 7.4 Pangaea Holdings, Inc.
- 7.4.1 Company Overview
- 7.5 Naturium
- 7.5.1 Company Overview
- 7.5.2 Recent strategies and developments:
- 7.5.2.1 Product Launches and Product Expansions:
- 7.6 Pinch of Colour LLC
- 7.6.1 Company Overview
- 7.7 UpCircle Beauty
- 7.7.1 Company Overview
- 7.8 W.S. Badger Company, Inc.
- 7.8.1 Company Overview