|
|
市場調査レポート
商品コード
1219666
ネットワークパフォーマンス監視の世界市場の規模、シェア、産業動向分析レポート:エンドユーザー別、企業規模別、コンポーネント別、地域別展望と予測、2022年~2028年Global Network Performance Monitoring Market Size, Share & Industry Trends Analysis Report By End User, By Enterprise Size, By Component, By Regional Outlook and Forecast, 2022 - 2028 |
||||||
|
|
|||||||


| ネットワークパフォーマンス監視の世界市場の規模、シェア、産業動向分析レポート:エンドユーザー別、企業規模別、コンポーネント別、地域別展望と予測、2022年~2028年 |
|
出版日: 2023年01月31日
発行: KBV Research
ページ情報: 英文 288 Pages
納期: 即納可能
|
- 全表示
- 概要
- 図表
- 目次
ネットワークパフォーマンス監視の世界市場規模は、予測期間中にCAGR6.9%で成長し、2028年には32億米ドルに達すると予想されています。
その結果、ほとんどの企業は信頼性の高いネットワークパフォーマンスモニタリングシステムを構築したいと考えています。企業の成功は、ネットワークの稼働率に左右されるからです。特に、ネットワークがほんの一瞬でもダウンした場合、企業は深刻な影響を受ける可能性があります。データの損失や盗難が発生した場合、ネットワーク監視はコンピューター・ネットワークの追跡と監視に使用される現代的な技術です。
データの損失や盗難が発生した場合、ネットワーク管理者に警告を発したり、警報を出したりします。欠陥のあるデバイスはネットワークのパフォーマンスに影響を与えるため、継続的なネットワーク監視は不可欠です。これらのシステムは、継続的に膨大な量のデータを収集し、ネットワーク監視ツールを使用してデータをフィルタリングして異常を発見することができます。その結果、企業やクラウドサービス、通信事業者は、これらの技術を活用しています。また、エレクトロニクス機器やシステム分野での技術革新により、ネットワーク監視システムの改善や近代化が進んでいます。
COVID-19の影響分析
ネットワーク監視企業は、COVID-19の危機から迅速に回復するために、効果的な危機管理戦略を策定しました。その戦略とは、次世代製品およびソリューションへの注力、ネットワーク監視ソリューションの研究開発予算の小幅削減、市場動向の常時監視、投資と売却の体系的アプローチ、マーケティングキャンペーンの慎重な開始、長期契約の強化などです。このように、企業はネットワークパフォーマンス監視ツールを活用し、ネットワークのリスクと脆弱性を判断した上で、さらなる変更を加えています。その結果、ネットワーク・パフォーマンス・モニタリングは、パンデミックの期間中に普及が進みました。その結果、COVID-19はネットワークパフォーマンス監視市場に好影響を与えました。
市場の成長要因
停電の問題に対処するための堅牢なネットワーク監視ツールへのニーズの高まり
ネットワーク機器に障害が発生すると、ダウンタイムや生産性の低下、さらにはセキュリティ上の問題が発生する可能性があります。ハードウェアの問題や故障によってネットワーク全体が完全に停止する場合もありますが、処理能力やネットワーク利用率が高くなると、業務が苦痛なほど遅くなることがあります。このような問題は、ネットワーク・パフォーマンス・モニタリング・ツールを使用することで、迅速に特定し、修正することができます。ネットワーク監視は、ダウンタイムを最小限に抑えることで、企業のコストを削減します。また、多くのネットワーク監視技術は、新しいデバイスの自動統合、ネットワークレイアウトの指定、悪意のある活動やセキュリティ侵害の可能性を明らかにすることで、付加価値を高めています。今後数年間、これらの要因によって、この業界は収益性の高い成長が見込まれます。
IOT(Internet of Things)の拡大とBYOD(Bring-Your-Own-Device)傾向の台頭
BYOD(Bring Your Own Device)と呼ばれる個人所有のモバイルアプリケーションやデバイスを支給され、個人とビジネスの両方で使用する従業員が増えてきています。企業がBYODをより積極的にサポートするようになった結果、モバイルデバイスの普及率が大幅に上昇しました。多くのサービス、アプリケーション、機能が利用可能になったことで、モバイル機器に大量のデータを保存、送信、受信することができるようになったのです。パスワード、クレジットカード番号、ユーザー名などは、モバイル機器に保存される機密データの1つです。したがって、予測期間中は、これらの要因がネットワークパフォーマンスモニタリング市場の成長を促進することになります。
市場抑制要因
ネットワーク監視に関連する法外なコスト
企業機能のオンライン化に伴い、企業はネットワークの更新を行い、容量や新機能を提供する必要があります。ネットワークは、標準的なITアプリケーションの管理に加え、ビデオ会議やテレフォニーなど、さまざまなビジネスサービスに対応する必要性が高まっており、ネットワーク帯域幅を追加する必要があります。さらに、共有ネットワークインフラ上に新しいサービスを展開するためには、マルチキャスティングプロトコル、自動設定プロトコル、新しいエンドポイントデバイス用のプロトコル、IP仮想化機能などが必要となります。その結果、NPMソリューションの導入コストが高いことが、ネットワークパフォーマンス監視の市場拡大を大きく妨げています。
コンポーネントの展望
ネットワークパフォーマンスモニタリング市場は、コンポーネントに基づいて、ハードウェアとサービスに分類されます。ハードウェアセグメントは、2021年のネットワークパフォーマンスモニタリング市場で最も高い収益シェアを獲得しました。ネットワークパフォーマンスのレポートと分析は、ネットワークの監視と最適化に不可欠です。ネットワークパフォーマンス監視用ハードウェアは、すべてのネットワークデータソースを取り込み、リアルタイムのパフォーマンスの可視性を提供できる設定可能なダッシュボード上で可視化とレポート作成の選択肢を提供します。
企業規模の展望
ネットワークパフォーマンス監視市場は、企業規模によって中小企業と大企業に分類されます。中小企業セグメントは、2021年のネットワークパフォーマンスモニタリング市場でかなりの収益シェアを獲得しました。SME(中小企業)は、一般的に1,000人以下の従業員を抱える企業として知られています。中小企業は、様々なサイズのネットワークデータセットを見つけ、管理し、規制するために、ネットワークパフォーマンスモニタリングを利用するようになってきています。多くの企業では、ネットワークインフラ全体のファイル共有を監視するための資金が不足しているため、NPMツールが提供できる最大の効率性とコスト削減は不可欠な要素であると考えられています。
エンドユーザーの展望
ネットワークパフォーマンスモニタリング市場は、エンドユーザーに基づき、IT・通信サービスプロバイダー、クラウドサービスプロバイダー、政府・公共機関、その他に区分されます。IT&通信サービスプロバイダー部門は、2021年にネットワークパフォーマンスモニタリング市場で最大の収益シェアを獲得しました。このセグメントの拡大を推進する主な要因の1つは、世界的に通信部門が大きく成長していることです。包括的なネットワークインフラの可視化に対する需要が、業界の拡大に拍車をかけています。過去数年間、データ接続への要求が高まる中、通信ネットワークは急速な変貌を遂げています。
地域別の展望
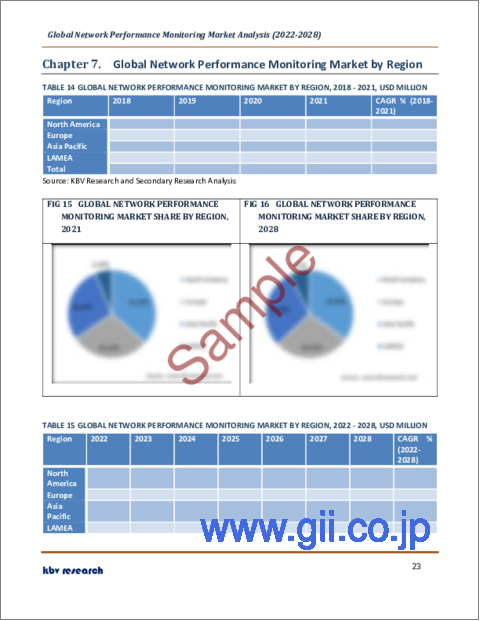
ネットワークパフォーマンスモニタリング市場を地域別に見ると、北米、欧州、アジア太平洋、LAMEAの4地域で分析されています。北米セグメントは、2021年のネットワークパフォーマンスモニタリング市場で最大の収益シェアを示しました。この地域のネットワークパフォーマンスモニタリング製品およびサービスを提供する事業者が豊富なことが成長の要因となっています。さらに、北米の堅牢な通信部門は、ネットワークパフォーマンスモニタリングツールの重要な顧客です。また、この地域では、クラウドベース技術などの最先端技術の採用率が高く、ネットワークパフォーマンスモニタリングの北米市場開拓を後押ししています。
市場参入企業がとっている主な戦略は買収です。カーディナルマトリックスで提示された分析によると、Microsoft Corporationはネットワークパフォーマンスモニタリング市場の先駆者です。Broadcom, Inc.、Keysight Technologies, Inc.、Cisco Systems, Inc.などの企業は、ネットワークパフォーマンスモニタリング市場における主要な革新者の一人です。
目次
第1章 市場の範囲と調査手法
- 市場の定義
- 目的
- 市場規模
- セグメンテーション
- ネットワークパフォーマンスモニタリングの世界市場、エンドユーザー別
- ネットワークパフォーマンスモニタリングの世界市場、企業規模別
- ネットワークパフォーマンスモニタリングの世界市場:コンポーネント別
- ネットワークパフォーマンス監視の世界市場、地域別
- 調査手法
第2章 市場概要
- イントロダクション
- 概要の説明
- 市場の構成とシナリオ
- 概要の説明
- 市場に影響を与える主な要因
- 市場促進要因
- 市場の抑制要因
第3章 競合分析-世界
- KBVカーディナルマトリックス
- 最近の業界全体の戦略的展開
- パートナーシップ、コラボレーション、契約
- 製品上市と製品拡張
- 買収と合併
- 市場シェア分析、2021年
- 主要成功戦略
- 主要なリーディング戦略:割合の分布(2018-2022年)
- 主要な戦略的動き:(買収・合併:2020年、10月~2023年、1月)主要なプレイヤーたち
第4章 ネットワークパフォーマンスモニタリングの世界市場:エンドユーザー別
- IT&テレコムサービスプロバイダーの世界市場:地域別
- クラウドサービスプロバイダーの世界市場:地域別
- 世界の政府・公共機関単位:地域別市場
- その他のエンドユーザーの世界市場:地域別
第5章 ネットワークパフォーマンス監視の世界市場:企業規模別
- 大企業の世界市場:地域別
- 世界の中小企業市場:地域別
第6章 ネットワークパフォーマンス監視の世界市場:コンポーネント別
- ハードウェアの世界市場:地域別
- ネットワークパフォーマンス監視の世界市場:ハードウェアタイプ別
- ネットワークパフォーマンスモニタリングプラットフォームの世界市場:地域別
- ネットワーク端末アクセスポイント(TAP)の世界市場:地域別
- ネットワークアクセスコントロール(NAC)アプライアンスの世界市場:地域別
- ネットワークパケットブローカー(NPBs)アプライアンスの世界市場:地域別
- 世界のサービス市場:地域別
第7章 ネットワークパフォーマンス監視の世界市場:地域別
- 北米
- 北米のネットワークパフォーマンス監視の国別市場
- 米国
- カナダ
- メキシコ
- その他北米地域
- 北米のネットワークパフォーマンス監視の国別市場
- 欧州
- 欧州ネットワークパフォーマンス監視市場:国別
- ドイツ
- 英国
- フランス
- ロシア
- スペイン
- イタリア
- その他欧州
- 欧州ネットワークパフォーマンス監視市場:国別
- アジア太平洋地域
- アジア太平洋地域のネットワークパフォーマンス監視の国別市場
- 中国
- 日本
- インド
- 韓国
- シンガポール
- マレーシア
- その他アジア太平洋地域
- アジア太平洋地域のネットワークパフォーマンス監視の国別市場
- LAMEA
- LAMEAのネットワークパフォーマンス監視の国別市場
- ブラジル
- アルゼンチン
- UAE
- サウジアラビア
- 南アフリカ
- ナイジェリア
- LAMEAの他の地域
- LAMEAのネットワークパフォーマンス監視の国別市場
第8章 企業プロファイル
- Broadcom, Inc.
- Microsoft Corporation
- Cisco Systems, Inc.
- SolarWinds Corporation
- Keysight Technologies, Inc.
- Juniper Networks, Inc.
- Logic Monitor, Inc.
- Paessler AG
- Profitap HQ B.V
- Nagios Enterprises LLC
LIST OF TABLES
- TABLE 1 Global Network Performance Monitoring Market, 2018 - 2021, USD Million
- TABLE 2 Global Network Performance Monitoring Market, 2022 - 2028, USD Million
- TABLE 3 Partnerships, Collaborations and Agreements- Network Performance Monitoring Market
- TABLE 4 Product Launches And Product Expansions- Network Performance Monitoring Market
- TABLE 5 Acquisition and Mergers- Network Performance Monitoring Market
- TABLE 6 Global Network Performance Monitoring Market by End User, 2018 - 2021, USD Million
- TABLE 7 Global Network Performance Monitoring Market by End User, 2022 - 2028, USD Million
- TABLE 8 Global IT & Telecom Service Providers Market by Region, 2018 - 2021, USD Million
- TABLE 9 Global IT & Telecom Service Providers Market by Region, 2022 - 2028, USD Million
- TABLE 10 Global Cloud Service Providers Market by Region, 2018 - 2021, USD Million
- TABLE 11 Global Cloud Service Providers Market by Region, 2022 - 2028, USD Million
- TABLE 12 Global Governments & Public Sector Units Market by Region, 2018 - 2021, USD Million
- TABLE 13 Global Governments & Public Sector Units Market by Region, 2022 - 2028, USD Million
- TABLE 14 Global Other End User Market by Region, 2018 - 2021, USD Million
- TABLE 15 Global Other End User Market by Region, 2022 - 2028, USD Million
- TABLE 16 Global Network Performance Monitoring Market by Enterprise Size, 2018 - 2021, USD Million
- TABLE 17 Global Network Performance Monitoring Market by Enterprise Size, 2022 - 2028, USD Million
- TABLE 18 Global Large Enterprises Market by Region, 2018 - 2021, USD Million
- TABLE 19 Global Large Enterprises Market by Region, 2022 - 2028, USD Million
- TABLE 20 Global Small & Medium Sized Enterprises Market by Region, 2018 - 2021, USD Million
- TABLE 21 Global Small & Medium Sized Enterprises Market by Region, 2022 - 2028, USD Million
- TABLE 22 Global Network Performance Monitoring Market by Component, 2018 - 2021, USD Million
- TABLE 23 Global Network Performance Monitoring Market by Component, 2022 - 2028, USD Million
- TABLE 24 Global Hardware Market by Region, 2018 - 2021, USD Million
- TABLE 25 Global Hardware Market by Region, 2022 - 2028, USD Million
- TABLE 26 Global Network Performance Monitoring Market by Hardware Type, 2018 - 2021, USD Million
- TABLE 27 Global Network Performance Monitoring Market by Hardware Type, 2022 - 2028, USD Million
- TABLE 28 Global Network Performance Monitoring Platforms Market by Region, 2018 - 2021, USD Million
- TABLE 29 Global Network Performance Monitoring Platforms Market by Region, 2022 - 2028, USD Million
- TABLE 30 Global Network Terminal Access Points (TAPs) Market by Region, 2018 - 2021, USD Million
- TABLE 31 Global Network Terminal Access Points (TAPs) Market by Region, 2022 - 2028, USD Million
- TABLE 32 Global Network Access Control (NAC) Appliances Market by Region, 2018 - 2021, USD Million
- TABLE 33 Global Network Access Control (NAC) Appliances Market by Region, 2022 - 2028, USD Million
- TABLE 34 Global Network Packet Brokers (NPBs) Appliances Market by Region, 2018 - 2021, USD Million
- TABLE 35 Global Network Packet Brokers (NPBs) Appliances Market by Region, 2022 - 2028, USD Million
- TABLE 36 Global Service Market by Region, 2018 - 2021, USD Million
- TABLE 37 Global Service Market by Region, 2022 - 2028, USD Million
- TABLE 38 Global Network Performance Monitoring Market by Region, 2018 - 2021, USD Million
- TABLE 39 Global Network Performance Monitoring Market by Region, 2022 - 2028, USD Million
- TABLE 40 North America Network Performance Monitoring Market, 2018 - 2021, USD Million
- TABLE 41 North America Network Performance Monitoring Market, 2022 - 2028, USD Million
- TABLE 42 North America Network Performance Monitoring Market by End User, 2018 - 2021, USD Million
- TABLE 43 North America Network Performance Monitoring Market by End User, 2022 - 2028, USD Million
- TABLE 44 North America IT & Telecom Service Providers Market by Country, 2018 - 2021, USD Million
- TABLE 45 North America IT & Telecom Service Providers Market by Country, 2022 - 2028, USD Million
- TABLE 46 North America Cloud Service Providers Market by Country, 2018 - 2021, USD Million
- TABLE 47 North America Cloud Service Providers Market by Country, 2022 - 2028, USD Million
- TABLE 48 North America Governments & Public Sector Units Market by Country, 2018 - 2021, USD Million
- TABLE 49 North America Governments & Public Sector Units Market by Country, 2022 - 2028, USD Million
- TABLE 50 North America Other End User Market by Country, 2018 - 2021, USD Million
- TABLE 51 North America Other End User Market by Country, 2022 - 2028, USD Million
- TABLE 52 North America Network Performance Monitoring Market by Enterprise Size, 2018 - 2021, USD Million
- TABLE 53 North America Network Performance Monitoring Market by Enterprise Size, 2022 - 2028, USD Million
- TABLE 54 North America Large Enterprises Market by Country, 2018 - 2021, USD Million
- TABLE 55 North America Large Enterprises Market by Country, 2022 - 2028, USD Million
- TABLE 56 North America Small & Medium Sized Enterprises Market by Country, 2018 - 2021, USD Million
- TABLE 57 North America Small & Medium Sized Enterprises Market by Country, 2022 - 2028, USD Million
- TABLE 58 North America Network Performance Monitoring Market by Component, 2018 - 2021, USD Million
- TABLE 59 North America Network Performance Monitoring Market by Component, 2022 - 2028, USD Million
- TABLE 60 North America Hardware Market by Country, 2018 - 2021, USD Million
- TABLE 61 North America Hardware Market by Country, 2022 - 2028, USD Million
- TABLE 62 North America Network Performance Monitoring Market by Hardware Type, 2018 - 2021, USD Million
- TABLE 63 North America Network Performance Monitoring Market by Hardware Type, 2022 - 2028, USD Million
- TABLE 64 North America Network Performance Monitoring Platforms Market by Country, 2018 - 2021, USD Million
- TABLE 65 North America Network Performance Monitoring Platforms Market by Country, 2022 - 2028, USD Million
- TABLE 66 North America Network Terminal Access Points (TAPs) Market by Country, 2018 - 2021, USD Million
- TABLE 67 North America Network Terminal Access Points (TAPs) Market by Country, 2022 - 2028, USD Million
- TABLE 68 North America Network Access Control (NAC) Appliances Market by Country, 2018 - 2021, USD Million
- TABLE 69 North America Network Access Control (NAC) Appliances Market by Country, 2022 - 2028, USD Million
- TABLE 70 North America Network Packet Brokers (NPBs) Appliances Market by Country, 2018 - 2021, USD Million
- TABLE 71 North America Network Packet Brokers (NPBs) Appliances Market by Country, 2022 - 2028, USD Million
- TABLE 72 North America Service Market by Country, 2018 - 2021, USD Million
- TABLE 73 North America Service Market by Country, 2022 - 2028, USD Million
- TABLE 74 North America Network Performance Monitoring Market by Country, 2018 - 2021, USD Million
- TABLE 75 North America Network Performance Monitoring Market by Country, 2022 - 2028, USD Million
- TABLE 76 US Network Performance Monitoring Market, 2018 - 2021, USD Million
- TABLE 77 US Network Performance Monitoring Market, 2022 - 2028, USD Million
- TABLE 78 US Network Performance Monitoring Market by End User, 2018 - 2021, USD Million
- TABLE 79 US Network Performance Monitoring Market by End User, 2022 - 2028, USD Million
- TABLE 80 US Network Performance Monitoring Market by Enterprise Size, 2018 - 2021, USD Million
- TABLE 81 US Network Performance Monitoring Market by Enterprise Size, 2022 - 2028, USD Million
- TABLE 82 US Network Performance Monitoring Market by Component, 2018 - 2021, USD Million
- TABLE 83 US Network Performance Monitoring Market by Component, 2022 - 2028, USD Million
- TABLE 84 US Network Performance Monitoring Market by Hardware Type, 2018 - 2021, USD Million
- TABLE 85 US Network Performance Monitoring Market by Hardware Type, 2022 - 2028, USD Million
- TABLE 86 Canada Network Performance Monitoring Market, 2018 - 2021, USD Million
- TABLE 87 Canada Network Performance Monitoring Market, 2022 - 2028, USD Million
- TABLE 88 Canada Network Performance Monitoring Market by End User, 2018 - 2021, USD Million
- TABLE 89 Canada Network Performance Monitoring Market by End User, 2022 - 2028, USD Million
- TABLE 90 Canada Network Performance Monitoring Market by Enterprise Size, 2018 - 2021, USD Million
- TABLE 91 Canada Network Performance Monitoring Market by Enterprise Size, 2022 - 2028, USD Million
- TABLE 92 Canada Network Performance Monitoring Market by Component, 2018 - 2021, USD Million
- TABLE 93 Canada Network Performance Monitoring Market by Component, 2022 - 2028, USD Million
- TABLE 94 Canada Network Performance Monitoring Market by Hardware Type, 2018 - 2021, USD Million
- TABLE 95 Canada Network Performance Monitoring Market by Hardware Type, 2022 - 2028, USD Million
- TABLE 96 Mexico Network Performance Monitoring Market, 2018 - 2021, USD Million
- TABLE 97 Mexico Network Performance Monitoring Market, 2022 - 2028, USD Million
- TABLE 98 Mexico Network Performance Monitoring Market by End User, 2018 - 2021, USD Million
- TABLE 99 Mexico Network Performance Monitoring Market by End User, 2022 - 2028, USD Million
- TABLE 100 Mexico Network Performance Monitoring Market by Enterprise Size, 2018 - 2021, USD Million
- TABLE 101 Mexico Network Performance Monitoring Market by Enterprise Size, 2022 - 2028, USD Million
- TABLE 102 Mexico Network Performance Monitoring Market by Component, 2018 - 2021, USD Million
- TABLE 103 Mexico Network Performance Monitoring Market by Component, 2022 - 2028, USD Million
- TABLE 104 Mexico Network Performance Monitoring Market by Hardware Type, 2018 - 2021, USD Million
- TABLE 105 Mexico Network Performance Monitoring Market by Hardware Type, 2022 - 2028, USD Million
- TABLE 106 Rest of North America Network Performance Monitoring Market, 2018 - 2021, USD Million
- TABLE 107 Rest of North America Network Performance Monitoring Market, 2022 - 2028, USD Million
- TABLE 108 Rest of North America Network Performance Monitoring Market by End User, 2018 - 2021, USD Million
- TABLE 109 Rest of North America Network Performance Monitoring Market by End User, 2022 - 2028, USD Million
- TABLE 110 Rest of North America Network Performance Monitoring Market by Enterprise Size, 2018 - 2021, USD Million
- TABLE 111 Rest of North America Network Performance Monitoring Market by Enterprise Size, 2022 - 2028, USD Million
- TABLE 112 Rest of North America Network Performance Monitoring Market by Component, 2018 - 2021, USD Million
- TABLE 113 Rest of North America Network Performance Monitoring Market by Component, 2022 - 2028, USD Million
- TABLE 114 Rest of North America Network Performance Monitoring Market by Hardware Type, 2018 - 2021, USD Million
- TABLE 115 Rest of North America Network Performance Monitoring Market by Hardware Type, 2022 - 2028, USD Million
- TABLE 116 Europe Network Performance Monitoring Market, 2018 - 2021, USD Million
- TABLE 117 Europe Network Performance Monitoring Market, 2022 - 2028, USD Million
- TABLE 118 Europe Network Performance Monitoring Market by End User, 2018 - 2021, USD Million
- TABLE 119 Europe Network Performance Monitoring Market by End User, 2022 - 2028, USD Million
- TABLE 120 Europe IT & Telecom Service Providers Market by Country, 2018 - 2021, USD Million
- TABLE 121 Europe IT & Telecom Service Providers Market by Country, 2022 - 2028, USD Million
- TABLE 122 Europe Cloud Service Providers Market by Country, 2018 - 2021, USD Million
- TABLE 123 Europe Cloud Service Providers Market by Country, 2022 - 2028, USD Million
- TABLE 124 Europe Governments & Public Sector Units Market by Country, 2018 - 2021, USD Million
- TABLE 125 Europe Governments & Public Sector Units Market by Country, 2022 - 2028, USD Million
- TABLE 126 Europe Other End User Market by Country, 2018 - 2021, USD Million
- TABLE 127 Europe Other End User Market by Country, 2022 - 2028, USD Million
- TABLE 128 Europe Network Performance Monitoring Market by Enterprise Size, 2018 - 2021, USD Million
- TABLE 129 Europe Network Performance Monitoring Market by Enterprise Size, 2022 - 2028, USD Million
- TABLE 130 Europe Large Enterprises Market by Country, 2018 - 2021, USD Million
- TABLE 131 Europe Large Enterprises Market by Country, 2022 - 2028, USD Million
- TABLE 132 Europe Small & Medium Sized Enterprises Market by Country, 2018 - 2021, USD Million
- TABLE 133 Europe Small & Medium Sized Enterprises Market by Country, 2022 - 2028, USD Million
- TABLE 134 Europe Network Performance Monitoring Market by Component, 2018 - 2021, USD Million
- TABLE 135 Europe Network Performance Monitoring Market by Component, 2022 - 2028, USD Million
- TABLE 136 Europe Hardware Market by Country, 2018 - 2021, USD Million
- TABLE 137 Europe Hardware Market by Country, 2022 - 2028, USD Million
- TABLE 138 Europe Network Performance Monitoring Market by Hardware Type, 2018 - 2021, USD Million
- TABLE 139 Europe Network Performance Monitoring Market by Hardware Type, 2022 - 2028, USD Million
- TABLE 140 Europe Network Performance Monitoring Platforms Market by Country, 2018 - 2021, USD Million
- TABLE 141 Europe Network Performance Monitoring Platforms Market by Country, 2022 - 2028, USD Million
- TABLE 142 Europe Network Terminal Access Points (TAPs) Market by Country, 2018 - 2021, USD Million
- TABLE 143 Europe Network Terminal Access Points (TAPs) Market by Country, 2022 - 2028, USD Million
- TABLE 144 Europe Network Access Control (NAC) Appliances Market by Country, 2018 - 2021, USD Million
- TABLE 145 Europe Network Access Control (NAC) Appliances Market by Country, 2022 - 2028, USD Million
- TABLE 146 Europe Network Packet Brokers (NPBs) Appliances Market by Country, 2018 - 2021, USD Million
- TABLE 147 Europe Network Packet Brokers (NPBs) Appliances Market by Country, 2022 - 2028, USD Million
- TABLE 148 Europe Service Market by Country, 2018 - 2021, USD Million
- TABLE 149 Europe Service Market by Country, 2022 - 2028, USD Million
- TABLE 150 Europe Network Performance Monitoring Market by Country, 2018 - 2021, USD Million
- TABLE 151 Europe Network Performance Monitoring Market by Country, 2022 - 2028, USD Million
- TABLE 152 Germany Network Performance Monitoring Market, 2018 - 2021, USD Million
- TABLE 153 Germany Network Performance Monitoring Market, 2022 - 2028, USD Million
- TABLE 154 Germany Network Performance Monitoring Market by End User, 2018 - 2021, USD Million
- TABLE 155 Germany Network Performance Monitoring Market by End User, 2022 - 2028, USD Million
- TABLE 156 Germany Network Performance Monitoring Market by Enterprise Size, 2018 - 2021, USD Million
- TABLE 157 Germany Network Performance Monitoring Market by Enterprise Size, 2022 - 2028, USD Million
- TABLE 158 Germany Network Performance Monitoring Market by Component, 2018 - 2021, USD Million
- TABLE 159 Germany Network Performance Monitoring Market by Component, 2022 - 2028, USD Million
- TABLE 160 Germany Network Performance Monitoring Market by Hardware Type, 2018 - 2021, USD Million
- TABLE 161 Germany Network Performance Monitoring Market by Hardware Type, 2022 - 2028, USD Million
- TABLE 162 UK Network Performance Monitoring Market, 2018 - 2021, USD Million
- TABLE 163 UK Network Performance Monitoring Market, 2022 - 2028, USD Million
- TABLE 164 UK Network Performance Monitoring Market by End User, 2018 - 2021, USD Million
- TABLE 165 UK Network Performance Monitoring Market by End User, 2022 - 2028, USD Million
- TABLE 166 UK Network Performance Monitoring Market by Enterprise Size, 2018 - 2021, USD Million
- TABLE 167 UK Network Performance Monitoring Market by Enterprise Size, 2022 - 2028, USD Million
- TABLE 168 UK Network Performance Monitoring Market by Component, 2018 - 2021, USD Million
- TABLE 169 UK Network Performance Monitoring Market by Component, 2022 - 2028, USD Million
- TABLE 170 UK Network Performance Monitoring Market by Hardware Type, 2018 - 2021, USD Million
- TABLE 171 UK Network Performance Monitoring Market by Hardware Type, 2022 - 2028, USD Million
- TABLE 172 France Network Performance Monitoring Market, 2018 - 2021, USD Million
- TABLE 173 France Network Performance Monitoring Market, 2022 - 2028, USD Million
- TABLE 174 France Network Performance Monitoring Market by End User, 2018 - 2021, USD Million
- TABLE 175 France Network Performance Monitoring Market by End User, 2022 - 2028, USD Million
- TABLE 176 France Network Performance Monitoring Market by Enterprise Size, 2018 - 2021, USD Million
- TABLE 177 France Network Performance Monitoring Market by Enterprise Size, 2022 - 2028, USD Million
- TABLE 178 France Network Performance Monitoring Market by Component, 2018 - 2021, USD Million
- TABLE 179 France Network Performance Monitoring Market by Component, 2022 - 2028, USD Million
- TABLE 180 France Network Performance Monitoring Market by Hardware Type, 2018 - 2021, USD Million
- TABLE 181 France Network Performance Monitoring Market by Hardware Type, 2022 - 2028, USD Million
- TABLE 182 Russia Network Performance Monitoring Market, 2018 - 2021, USD Million
- TABLE 183 Russia Network Performance Monitoring Market, 2022 - 2028, USD Million
- TABLE 184 Russia Network Performance Monitoring Market by End User, 2018 - 2021, USD Million
- TABLE 185 Russia Network Performance Monitoring Market by End User, 2022 - 2028, USD Million
- TABLE 186 Russia Network Performance Monitoring Market by Enterprise Size, 2018 - 2021, USD Million
- TABLE 187 Russia Network Performance Monitoring Market by Enterprise Size, 2022 - 2028, USD Million
- TABLE 188 Russia Network Performance Monitoring Market by Component, 2018 - 2021, USD Million
- TABLE 189 Russia Network Performance Monitoring Market by Component, 2022 - 2028, USD Million
- TABLE 190 Russia Network Performance Monitoring Market by Hardware Type, 2018 - 2021, USD Million
- TABLE 191 Russia Network Performance Monitoring Market by Hardware Type, 2022 - 2028, USD Million
- TABLE 192 Spain Network Performance Monitoring Market, 2018 - 2021, USD Million
- TABLE 193 Spain Network Performance Monitoring Market, 2022 - 2028, USD Million
- TABLE 194 Spain Network Performance Monitoring Market by End User, 2018 - 2021, USD Million
- TABLE 195 Spain Network Performance Monitoring Market by End User, 2022 - 2028, USD Million
- TABLE 196 Spain Network Performance Monitoring Market by Enterprise Size, 2018 - 2021, USD Million
- TABLE 197 Spain Network Performance Monitoring Market by Enterprise Size, 2022 - 2028, USD Million
- TABLE 198 Spain Network Performance Monitoring Market by Component, 2018 - 2021, USD Million
- TABLE 199 Spain Network Performance Monitoring Market by Component, 2022 - 2028, USD Million
- TABLE 200 Spain Network Performance Monitoring Market by Hardware Type, 2018 - 2021, USD Million
- TABLE 201 Spain Network Performance Monitoring Market by Hardware Type, 2022 - 2028, USD Million
- TABLE 202 Italy Network Performance Monitoring Market, 2018 - 2021, USD Million
- TABLE 203 Italy Network Performance Monitoring Market, 2022 - 2028, USD Million
- TABLE 204 Italy Network Performance Monitoring Market by End User, 2018 - 2021, USD Million
- TABLE 205 Italy Network Performance Monitoring Market by End User, 2022 - 2028, USD Million
- TABLE 206 Italy Network Performance Monitoring Market by Enterprise Size, 2018 - 2021, USD Million
- TABLE 207 Italy Network Performance Monitoring Market by Enterprise Size, 2022 - 2028, USD Million
- TABLE 208 Italy Network Performance Monitoring Market by Component, 2018 - 2021, USD Million
- TABLE 209 Italy Network Performance Monitoring Market by Component, 2022 - 2028, USD Million
- TABLE 210 Italy Network Performance Monitoring Market by Hardware Type, 2018 - 2021, USD Million
- TABLE 211 Italy Network Performance Monitoring Market by Hardware Type, 2022 - 2028, USD Million
- TABLE 212 Rest of Europe Network Performance Monitoring Market, 2018 - 2021, USD Million
- TABLE 213 Rest of Europe Network Performance Monitoring Market, 2022 - 2028, USD Million
- TABLE 214 Rest of Europe Network Performance Monitoring Market by End User, 2018 - 2021, USD Million
- TABLE 215 Rest of Europe Network Performance Monitoring Market by End User, 2022 - 2028, USD Million
- TABLE 216 Rest of Europe Network Performance Monitoring Market by Enterprise Size, 2018 - 2021, USD Million
- TABLE 217 Rest of Europe Network Performance Monitoring Market by Enterprise Size, 2022 - 2028, USD Million
- TABLE 218 Rest of Europe Network Performance Monitoring Market by Component, 2018 - 2021, USD Million
- TABLE 219 Rest of Europe Network Performance Monitoring Market by Component, 2022 - 2028, USD Million
- TABLE 220 Rest of Europe Network Performance Monitoring Market by Hardware Type, 2018 - 2021, USD Million
- TABLE 221 Rest of Europe Network Performance Monitoring Market by Hardware Type, 2022 - 2028, USD Million
- TABLE 222 Asia Pacific Network Performance Monitoring Market, 2018 - 2021, USD Million
- TABLE 223 Asia Pacific Network Performance Monitoring Market, 2022 - 2028, USD Million
- TABLE 224 Asia Pacific Network Performance Monitoring Market by End User, 2018 - 2021, USD Million
- TABLE 225 Asia Pacific Network Performance Monitoring Market by End User, 2022 - 2028, USD Million
- TABLE 226 Asia Pacific IT & Telecom Service Providers Market by Country, 2018 - 2021, USD Million
- TABLE 227 Asia Pacific IT & Telecom Service Providers Market by Country, 2022 - 2028, USD Million
- TABLE 228 Asia Pacific Cloud Service Providers Market by Country, 2018 - 2021, USD Million
- TABLE 229 Asia Pacific Cloud Service Providers Market by Country, 2022 - 2028, USD Million
- TABLE 230 Asia Pacific Governments & Public Sector Units Market by Country, 2018 - 2021, USD Million
- TABLE 231 Asia Pacific Governments & Public Sector Units Market by Country, 2022 - 2028, USD Million
- TABLE 232 Asia Pacific Other End User Market by Country, 2018 - 2021, USD Million
- TABLE 233 Asia Pacific Other End User Market by Country, 2022 - 2028, USD Million
- TABLE 234 Asia Pacific Network Performance Monitoring Market by Enterprise Size, 2018 - 2021, USD Million
- TABLE 235 Asia Pacific Network Performance Monitoring Market by Enterprise Size, 2022 - 2028, USD Million
- TABLE 236 Asia Pacific Large Enterprises Market by Country, 2018 - 2021, USD Million
- TABLE 237 Asia Pacific Large Enterprises Market by Country, 2022 - 2028, USD Million
- TABLE 238 Asia Pacific Small & Medium Sized Enterprises Market by Country, 2018 - 2021, USD Million
- TABLE 239 Asia Pacific Small & Medium Sized Enterprises Market by Country, 2022 - 2028, USD Million
- TABLE 240 Asia Pacific Network Performance Monitoring Market by Component, 2018 - 2021, USD Million
- TABLE 241 Asia Pacific Network Performance Monitoring Market by Component, 2022 - 2028, USD Million
- TABLE 242 Asia Pacific Hardware Market by Country, 2018 - 2021, USD Million
- TABLE 243 Asia Pacific Hardware Market by Country, 2022 - 2028, USD Million
- TABLE 244 Asia Pacific Network Performance Monitoring Market by Hardware Type, 2018 - 2021, USD Million
- TABLE 245 Asia Pacific Network Performance Monitoring Market by Hardware Type, 2022 - 2028, USD Million
- TABLE 246 Asia Pacific Network Performance Monitoring Platforms Market by Country, 2018 - 2021, USD Million
- TABLE 247 Asia Pacific Network Performance Monitoring Platforms Market by Country, 2022 - 2028, USD Million
- TABLE 248 Asia Pacific Network Terminal Access Points (TAPs) Market by Country, 2018 - 2021, USD Million
- TABLE 249 Asia Pacific Network Terminal Access Points (TAPs) Market by Country, 2022 - 2028, USD Million
- TABLE 250 Asia Pacific Network Access Control (NAC) Appliances Market by Country, 2018 - 2021, USD Million
- TABLE 251 Asia Pacific Network Access Control (NAC) Appliances Market by Country, 2022 - 2028, USD Million
- TABLE 252 Asia Pacific Network Packet Brokers (NPBs) Appliances Market by Country, 2018 - 2021, USD Million
- TABLE 253 Asia Pacific Network Packet Brokers (NPBs) Appliances Market by Country, 2022 - 2028, USD Million
- TABLE 254 Asia Pacific Service Market by Country, 2018 - 2021, USD Million
- TABLE 255 Asia Pacific Service Market by Country, 2022 - 2028, USD Million
- TABLE 256 Asia Pacific Network Performance Monitoring Market by Country, 2018 - 2021, USD Million
- TABLE 257 Asia Pacific Network Performance Monitoring Market by Country, 2022 - 2028, USD Million
- TABLE 258 China Network Performance Monitoring Market, 2018 - 2021, USD Million
- TABLE 259 China Network Performance Monitoring Market, 2022 - 2028, USD Million
- TABLE 260 China Network Performance Monitoring Market by End User, 2018 - 2021, USD Million
- TABLE 261 China Network Performance Monitoring Market by End User, 2022 - 2028, USD Million
- TABLE 262 China Network Performance Monitoring Market by Enterprise Size, 2018 - 2021, USD Million
- TABLE 263 China Network Performance Monitoring Market by Enterprise Size, 2022 - 2028, USD Million
- TABLE 264 China Network Performance Monitoring Market by Component, 2018 - 2021, USD Million
- TABLE 265 China Network Performance Monitoring Market by Component, 2022 - 2028, USD Million
- TABLE 266 China Network Performance Monitoring Market by Hardware Type, 2018 - 2021, USD Million
- TABLE 267 China Network Performance Monitoring Market by Hardware Type, 2022 - 2028, USD Million
- TABLE 268 Japan Network Performance Monitoring Market, 2018 - 2021, USD Million
- TABLE 269 Japan Network Performance Monitoring Market, 2022 - 2028, USD Million
- TABLE 270 Japan Network Performance Monitoring Market by End User, 2018 - 2021, USD Million
- TABLE 271 Japan Network Performance Monitoring Market by End User, 2022 - 2028, USD Million
- TABLE 272 Japan Network Performance Monitoring Market by Enterprise Size, 2018 - 2021, USD Million
- TABLE 273 Japan Network Performance Monitoring Market by Enterprise Size, 2022 - 2028, USD Million
- TABLE 274 Japan Network Performance Monitoring Market by Component, 2018 - 2021, USD Million
- TABLE 275 Japan Network Performance Monitoring Market by Component, 2022 - 2028, USD Million
- TABLE 276 Japan Network Performance Monitoring Market by Hardware Type, 2018 - 2021, USD Million
- TABLE 277 Japan Network Performance Monitoring Market by Hardware Type, 2022 - 2028, USD Million
- TABLE 278 India Network Performance Monitoring Market, 2018 - 2021, USD Million
- TABLE 279 India Network Performance Monitoring Market, 2022 - 2028, USD Million
- TABLE 280 India Network Performance Monitoring Market by End User, 2018 - 2021, USD Million
- TABLE 281 India Network Performance Monitoring Market by End User, 2022 - 2028, USD Million
- TABLE 282 India Network Performance Monitoring Market by Enterprise Size, 2018 - 2021, USD Million
- TABLE 283 India Network Performance Monitoring Market by Enterprise Size, 2022 - 2028, USD Million
- TABLE 284 India Network Performance Monitoring Market by Component, 2018 - 2021, USD Million
- TABLE 285 India Network Performance Monitoring Market by Component, 2022 - 2028, USD Million
- TABLE 286 India Network Performance Monitoring Market by Hardware Type, 2018 - 2021, USD Million
- TABLE 287 India Network Performance Monitoring Market by Hardware Type, 2022 - 2028, USD Million
- TABLE 288 South Korea Network Performance Monitoring Market, 2018 - 2021, USD Million
- TABLE 289 South Korea Network Performance Monitoring Market, 2022 - 2028, USD Million
- TABLE 290 South Korea Network Performance Monitoring Market by End User, 2018 - 2021, USD Million
- TABLE 291 South Korea Network Performance Monitoring Market by End User, 2022 - 2028, USD Million
- TABLE 292 South Korea Network Performance Monitoring Market by Enterprise Size, 2018 - 2021, USD Million
- TABLE 293 South Korea Network Performance Monitoring Market by Enterprise Size, 2022 - 2028, USD Million
- TABLE 294 South Korea Network Performance Monitoring Market by Component, 2018 - 2021, USD Million
- TABLE 295 South Korea Network Performance Monitoring Market by Component, 2022 - 2028, USD Million
- TABLE 296 South Korea Network Performance Monitoring Market by Hardware Type, 2018 - 2021, USD Million
- TABLE 297 South Korea Network Performance Monitoring Market by Hardware Type, 2022 - 2028, USD Million
- TABLE 298 Singapore Network Performance Monitoring Market, 2018 - 2021, USD Million
- TABLE 299 Singapore Network Performance Monitoring Market, 2022 - 2028, USD Million
- TABLE 300 Singapore Network Performance Monitoring Market by End User, 2018 - 2021, USD Million
- TABLE 301 Singapore Network Performance Monitoring Market by End User, 2022 - 2028, USD Million
- TABLE 302 Singapore Network Performance Monitoring Market by Enterprise Size, 2018 - 2021, USD Million
- TABLE 303 Singapore Network Performance Monitoring Market by Enterprise Size, 2022 - 2028, USD Million
- TABLE 304 Singapore Network Performance Monitoring Market by Component, 2018 - 2021, USD Million
- TABLE 305 Singapore Network Performance Monitoring Market by Component, 2022 - 2028, USD Million
- TABLE 306 Singapore Network Performance Monitoring Market by Hardware Type, 2018 - 2021, USD Million
- TABLE 307 Singapore Network Performance Monitoring Market by Hardware Type, 2022 - 2028, USD Million
- TABLE 308 Malaysia Network Performance Monitoring Market, 2018 - 2021, USD Million
- TABLE 309 Malaysia Network Performance Monitoring Market, 2022 - 2028, USD Million
- TABLE 310 Malaysia Network Performance Monitoring Market by End User, 2018 - 2021, USD Million
- TABLE 311 Malaysia Network Performance Monitoring Market by End User, 2022 - 2028, USD Million
- TABLE 312 Malaysia Network Performance Monitoring Market by Enterprise Size, 2018 - 2021, USD Million
- TABLE 313 Malaysia Network Performance Monitoring Market by Enterprise Size, 2022 - 2028, USD Million
- TABLE 314 Malaysia Network Performance Monitoring Market by Component, 2018 - 2021, USD Million
- TABLE 315 Malaysia Network Performance Monitoring Market by Component, 2022 - 2028, USD Million
- TABLE 316 Malaysia Network Performance Monitoring Market by Hardware Type, 2018 - 2021, USD Million
- TABLE 317 Malaysia Network Performance Monitoring Market by Hardware Type, 2022 - 2028, USD Million
- TABLE 318 Rest of Asia Pacific Network Performance Monitoring Market, 2018 - 2021, USD Million
- TABLE 319 Rest of Asia Pacific Network Performance Monitoring Market, 2022 - 2028, USD Million
- TABLE 320 Rest of Asia Pacific Network Performance Monitoring Market by End User, 2018 - 2021, USD Million
- TABLE 321 Rest of Asia Pacific Network Performance Monitoring Market by End User, 2022 - 2028, USD Million
- TABLE 322 Rest of Asia Pacific Network Performance Monitoring Market by Enterprise Size, 2018 - 2021, USD Million
- TABLE 323 Rest of Asia Pacific Network Performance Monitoring Market by Enterprise Size, 2022 - 2028, USD Million
- TABLE 324 Rest of Asia Pacific Network Performance Monitoring Market by Component, 2018 - 2021, USD Million
- TABLE 325 Rest of Asia Pacific Network Performance Monitoring Market by Component, 2022 - 2028, USD Million
- TABLE 326 Rest of Asia Pacific Network Performance Monitoring Market by Hardware Type, 2018 - 2021, USD Million
- TABLE 327 Rest of Asia Pacific Network Performance Monitoring Market by Hardware Type, 2022 - 2028, USD Million
- TABLE 328 LAMEA Network Performance Monitoring Market, 2018 - 2021, USD Million
- TABLE 329 LAMEA Network Performance Monitoring Market, 2022 - 2028, USD Million
- TABLE 330 LAMEA Network Performance Monitoring Market by End User, 2018 - 2021, USD Million
- TABLE 331 LAMEA Network Performance Monitoring Market by End User, 2022 - 2028, USD Million
- TABLE 332 LAMEA IT & Telecom Service Providers Market by Country, 2018 - 2021, USD Million
- TABLE 333 LAMEA IT & Telecom Service Providers Market by Country, 2022 - 2028, USD Million
- TABLE 334 LAMEA Cloud Service Providers Market by Country, 2018 - 2021, USD Million
- TABLE 335 LAMEA Cloud Service Providers Market by Country, 2022 - 2028, USD Million
- TABLE 336 LAMEA Governments & Public Sector Units Market by Country, 2018 - 2021, USD Million
- TABLE 337 LAMEA Governments & Public Sector Units Market by Country, 2022 - 2028, USD Million
- TABLE 338 LAMEA Other End User Market by Country, 2018 - 2021, USD Million
- TABLE 339 LAMEA Other End User Market by Country, 2022 - 2028, USD Million
- TABLE 340 LAMEA Network Performance Monitoring Market by Enterprise Size, 2018 - 2021, USD Million
- TABLE 341 LAMEA Network Performance Monitoring Market by Enterprise Size, 2022 - 2028, USD Million
- TABLE 342 LAMEA Large Enterprises Market by Country, 2018 - 2021, USD Million
- TABLE 343 LAMEA Large Enterprises Market by Country, 2022 - 2028, USD Million
- TABLE 344 LAMEA Small & Medium Sized Enterprises Market by Country, 2018 - 2021, USD Million
- TABLE 345 LAMEA Small & Medium Sized Enterprises Market by Country, 2022 - 2028, USD Million
- TABLE 346 LAMEA Network Performance Monitoring Market by Component, 2018 - 2021, USD Million
- TABLE 347 LAMEA Network Performance Monitoring Market by Component, 2022 - 2028, USD Million
- TABLE 348 LAMEA Hardware Market by Country, 2018 - 2021, USD Million
- TABLE 349 LAMEA Hardware Market by Country, 2022 - 2028, USD Million
- TABLE 350 LAMEA Network Performance Monitoring Market by Hardware Type, 2018 - 2021, USD Million
- TABLE 351 LAMEA Network Performance Monitoring Market by Hardware Type, 2022 - 2028, USD Million
- TABLE 352 LAMEA Network Performance Monitoring Platforms Market by Country, 2018 - 2021, USD Million
- TABLE 353 LAMEA Network Performance Monitoring Platforms Market by Country, 2022 - 2028, USD Million
- TABLE 354 LAMEA Network Terminal Access Points (TAPs) Market by Country, 2018 - 2021, USD Million
- TABLE 355 LAMEA Network Terminal Access Points (TAPs) Market by Country, 2022 - 2028, USD Million
- TABLE 356 LAMEA Network Access Control (NAC) Appliances Market by Country, 2018 - 2021, USD Million
- TABLE 357 LAMEA Network Access Control (NAC) Appliances Market by Country, 2022 - 2028, USD Million
- TABLE 358 LAMEA Network Packet Brokers (NPBs) Appliances Market by Country, 2018 - 2021, USD Million
- TABLE 359 LAMEA Network Packet Brokers (NPBs) Appliances Market by Country, 2022 - 2028, USD Million
- TABLE 360 LAMEA Service Market by Country, 2018 - 2021, USD Million
- TABLE 361 LAMEA Service Market by Country, 2022 - 2028, USD Million
- TABLE 362 LAMEA Network Performance Monitoring Market by Country, 2018 - 2021, USD Million
- TABLE 363 LAMEA Network Performance Monitoring Market by Country, 2022 - 2028, USD Million
- TABLE 364 Brazil Network Performance Monitoring Market, 2018 - 2021, USD Million
- TABLE 365 Brazil Network Performance Monitoring Market, 2022 - 2028, USD Million
- TABLE 366 Brazil Network Performance Monitoring Market by End User, 2018 - 2021, USD Million
- TABLE 367 Brazil Network Performance Monitoring Market by End User, 2022 - 2028, USD Million
- TABLE 368 Brazil Network Performance Monitoring Market by Enterprise Size, 2018 - 2021, USD Million
- TABLE 369 Brazil Network Performance Monitoring Market by Enterprise Size, 2022 - 2028, USD Million
- TABLE 370 Brazil Network Performance Monitoring Market by Component, 2018 - 2021, USD Million
- TABLE 371 Brazil Network Performance Monitoring Market by Component, 2022 - 2028, USD Million
- TABLE 372 Brazil Network Performance Monitoring Market by Hardware Type, 2018 - 2021, USD Million
- TABLE 373 Brazil Network Performance Monitoring Market by Hardware Type, 2022 - 2028, USD Million
- TABLE 374 Argentina Network Performance Monitoring Market, 2018 - 2021, USD Million
- TABLE 375 Argentina Network Performance Monitoring Market, 2022 - 2028, USD Million
- TABLE 376 Argentina Network Performance Monitoring Market by End User, 2018 - 2021, USD Million
- TABLE 377 Argentina Network Performance Monitoring Market by End User, 2022 - 2028, USD Million
- TABLE 378 Argentina Network Performance Monitoring Market by Enterprise Size, 2018 - 2021, USD Million
- TABLE 379 Argentina Network Performance Monitoring Market by Enterprise Size, 2022 - 2028, USD Million
- TABLE 380 Argentina Network Performance Monitoring Market by Component, 2018 - 2021, USD Million
- TABLE 381 Argentina Network Performance Monitoring Market by Component, 2022 - 2028, USD Million
- TABLE 382 Argentina Network Performance Monitoring Market by Hardware Type, 2018 - 2021, USD Million
- TABLE 383 Argentina Network Performance Monitoring Market by Hardware Type, 2022 - 2028, USD Million
- TABLE 384 UAE Network Performance Monitoring Market, 2018 - 2021, USD Million
- TABLE 385 UAE Network Performance Monitoring Market, 2022 - 2028, USD Million
- TABLE 386 UAE Network Performance Monitoring Market by End User, 2018 - 2021, USD Million
- TABLE 387 UAE Network Performance Monitoring Market by End User, 2022 - 2028, USD Million
- TABLE 388 UAE Network Performance Monitoring Market by Enterprise Size, 2018 - 2021, USD Million
- TABLE 389 UAE Network Performance Monitoring Market by Enterprise Size, 2022 - 2028, USD Million
- TABLE 390 UAE Network Performance Monitoring Market by Component, 2018 - 2021, USD Million
- TABLE 391 UAE Network Performance Monitoring Market by Component, 2022 - 2028, USD Million
- TABLE 392 UAE Network Performance Monitoring Market by Hardware Type, 2018 - 2021, USD Million
- TABLE 393 UAE Network Performance Monitoring Market by Hardware Type, 2022 - 2028, USD Million
- TABLE 394 Saudi Arabia Network Performance Monitoring Market, 2018 - 2021, USD Million
- TABLE 395 Saudi Arabia Network Performance Monitoring Market, 2022 - 2028, USD Million
- TABLE 396 Saudi Arabia Network Performance Monitoring Market by End User, 2018 - 2021, USD Million
- TABLE 397 Saudi Arabia Network Performance Monitoring Market by End User, 2022 - 2028, USD Million
- TABLE 398 Saudi Arabia Network Performance Monitoring Market by Enterprise Size, 2018 - 2021, USD Million
- TABLE 399 Saudi Arabia Network Performance Monitoring Market by Enterprise Size, 2022 - 2028, USD Million
- TABLE 400 Saudi Arabia Network Performance Monitoring Market by Component, 2018 - 2021, USD Million
- TABLE 401 Saudi Arabia Network Performance Monitoring Market by Component, 2022 - 2028, USD Million
- TABLE 402 Saudi Arabia Network Performance Monitoring Market by Hardware Type, 2018 - 2021, USD Million
- TABLE 403 Saudi Arabia Network Performance Monitoring Market by Hardware Type, 2022 - 2028, USD Million
- TABLE 404 South Africa Network Performance Monitoring Market, 2018 - 2021, USD Million
- TABLE 405 South Africa Network Performance Monitoring Market, 2022 - 2028, USD Million
- TABLE 406 South Africa Network Performance Monitoring Market by End User, 2018 - 2021, USD Million
- TABLE 407 South Africa Network Performance Monitoring Market by End User, 2022 - 2028, USD Million
- TABLE 408 South Africa Network Performance Monitoring Market by Enterprise Size, 2018 - 2021, USD Million
- TABLE 409 South Africa Network Performance Monitoring Market by Enterprise Size, 2022 - 2028, USD Million
- TABLE 410 South Africa Network Performance Monitoring Market by Component, 2018 - 2021, USD Million
- TABLE 411 South Africa Network Performance Monitoring Market by Component, 2022 - 2028, USD Million
- TABLE 412 South Africa Network Performance Monitoring Market by Hardware Type, 2018 - 2021, USD Million
- TABLE 413 South Africa Network Performance Monitoring Market by Hardware Type, 2022 - 2028, USD Million
- TABLE 414 Nigeria Network Performance Monitoring Market, 2018 - 2021, USD Million
- TABLE 415 Nigeria Network Performance Monitoring Market, 2022 - 2028, USD Million
- TABLE 416 Nigeria Network Performance Monitoring Market by End User, 2018 - 2021, USD Million
- TABLE 417 Nigeria Network Performance Monitoring Market by End User, 2022 - 2028, USD Million
- TABLE 418 Nigeria Network Performance Monitoring Market by Enterprise Size, 2018 - 2021, USD Million
- TABLE 419 Nigeria Network Performance Monitoring Market by Enterprise Size, 2022 - 2028, USD Million
- TABLE 420 Nigeria Network Performance Monitoring Market by Component, 2018 - 2021, USD Million
- TABLE 421 Nigeria Network Performance Monitoring Market by Component, 2022 - 2028, USD Million
- TABLE 422 Nigeria Network Performance Monitoring Market by Hardware Type, 2018 - 2021, USD Million
- TABLE 423 Nigeria Network Performance Monitoring Market by Hardware Type, 2022 - 2028, USD Million
- TABLE 424 Rest of LAMEA Network Performance Monitoring Market, 2018 - 2021, USD Million
- TABLE 425 Rest of LAMEA Network Performance Monitoring Market, 2022 - 2028, USD Million
- TABLE 426 Rest of LAMEA Network Performance Monitoring Market by End User, 2018 - 2021, USD Million
- TABLE 427 Rest of LAMEA Network Performance Monitoring Market by End User, 2022 - 2028, USD Million
- TABLE 428 Rest of LAMEA Network Performance Monitoring Market by Enterprise Size, 2018 - 2021, USD Million
- TABLE 429 Rest of LAMEA Network Performance Monitoring Market by Enterprise Size, 2022 - 2028, USD Million
- TABLE 430 Rest of LAMEA Network Performance Monitoring Market by Component, 2018 - 2021, USD Million
- TABLE 431 Rest of LAMEA Network Performance Monitoring Market by Component, 2022 - 2028, USD Million
- TABLE 432 Rest of LAMEA Network Performance Monitoring Market by Hardware Type, 2018 - 2021, USD Million
- TABLE 433 Rest of LAMEA Network Performance Monitoring Market by Hardware Type, 2022 - 2028, USD Million
- TABLE 434 Key Information - Broadcom, Inc.
- TABLE 435 key information - Microsoft Corporation
- TABLE 436 Key Information - Cisco Systems, Inc.
- TABLE 437 key information - SolarWinds Corporation
- TABLE 438 Key Information - Keysight Technologies, Inc.
- TABLE 439 Key Information - Juniper Networks, Inc.
- TABLE 440 Key Information - Logic Monitor, Inc.
- TABLE 441 Key Information - Paessler Ag
- TABLE 442 Key Information - Profitap hq b.v
- TABLE 443 Key Information - Nagios Enterprises llc
List of Figures
- FIG 1 Methodology for the research
- FIG 2 KBV Cardinal Matrix
- FIG 3 Market Share Analysis, 2021
- FIG 4 Key Leading Strategies: Percentage Distribution (2018-2022)
- FIG 5 Key Strategic Move: (Acquisition and Mergers: 2020, Oct - 2023, Jan) Leading Players
- FIG 6 Global Network Performance Monitoring Market Share by End User, 2021
- FIG 7 Global Network Performance Monitoring Market Share by End User, 2028
- FIG 8 Global Network Performance Monitoring Market by End User, 2018 - 2028, USD Million
- FIG 9 Global Network Performance Monitoring Market Share by Enterprise Size, 2021
- FIG 10 Global Network Performance Monitoring Market Share by Enterprise Size, 2028
- FIG 11 Global Network Performance Monitoring Market by Enterprise Size, 2018 - 2028, USD Million
- FIG 12 Global Network Performance Monitoring Market Share by Component, 2021
- FIG 13 Global Network Performance Monitoring Market Share by Component, 2028
- FIG 14 Global Network Performance Monitoring Market by Component, 2018 - 2028, USD Million
- FIG 15 Global Network Performance Monitoring Market Share by Region, 2021
- FIG 16 Global Network Performance Monitoring Market Share by Region, 2028
- FIG 17 Global Network Performance Monitoring Market by Region, 2018 - 2028, USD Million
- FIG 18 SWOT Analysis: Broadcom, Inc.
- FIG 19 SWOT Analysis: Microsoft Corporation
- FIG 20 SWOT Analysis: Cisco Systems, Inc.
- FIG 21 SWOT Analysis: SolarWinds Corporation
- FIG 22 Recent strategies and developments: Keysight Technologies, Inc.
The Global Network Performance Monitoring Market size is expected to reach $3.2 billion by 2028, rising at a market growth of 6.9% CAGR during the forecast period.
The process of visualizing, monitoring, optimizing, debugging, and reporting on the availability and health of the network as experienced by the users is known as network performance monitoring. Network performance monitoring (NPM) systems can use different types of telemetry, including network flow data, packed data, and device metrics, like SNMP, WMI, API, synthetic tests, CLI, and logs.
Additionally, packets are necessary for anything done on the network because they transport data between nodes. With the advancement in technology, the complexity of network management has increased. This is due to the prevalence of hybrid configurations among businesses today, which combine on-premise servers with cloud-based services.
Consequently, most companies want to establish a reliable network performance monitoring system. The company's success will depend on how well the network operates. In particular, if the network is down even for a few moments, the company could experience serious implications. In the event of data loss or theft, network monitoring is a modern technology that is used to trace and monitor computer networks.
It alerts or warns the network administrator in case of data loss and theft. Due to faulty devices' influence on network performance, ongoing network monitoring is essential. These systems continuously collect enormous amounts of data, which enables data to be filtered to find any anomalies using network monitoring tools. As a result, enterprises, cloud services, and telecommunications leverage these technologies. In addition, innovations in the electronics device and system sectors improve and modernize network monitoring systems.
COVID-19 Impact Analysis
Network monitoring companies created effective crisis-management strategies to help them recover quickly from the COVID-19 crisis. These strategies included focusing on next-generation products and solutions, a modest reduction in the R&D budget for network monitoring solutions, constant monitoring of market trends, systematic approaches to investment and divestment, cautiously launching marketing campaigns, and reinforcing long-term contracts. Businesses thus utilize network performance monitoring tools to determine their network risks and vulnerabilities before making further changes. As a result, network performance monitoring grew in popularity over the course of the pandemic. Consequently, COVID-19 had a positive impact on the network performance monitoring market.
Market Growth Factors
Growing need for robust network monitoring tools to address issues with outages
Downtime, lost productivity, and even security issues can occur when network equipment fails. While hardware issues and malfunctions might bring the entire network to a complete halt, high processing or network utilization can painfully slow down operations. These problems can be quickly identified and corrected with the help of network performance monitoring tools. Network monitoring saves costs for the company by minimizing downtime. Many network monitoring technologies also add value by automatically integrating new devices, specifying network layouts, and revealing malicious activities or potential security breaches. In the upcoming years, the industry will have profitable growth prospects as a result of these factors.
Rising internet of things (IOT) expansion and the bring-your-own-device (BYOD) trend
Employees are increasingly being provided personal mobile applications and devices to use for both personal and business purposes under the term "bring your own device" or BYOD. Mobile device adoption has significantly increased as a result of organizations' greater support for BYOD. The availability of a plethora of services, applications, and capabilities has increased the accessibility of storage, transmission, and receiving of large volumes of data on mobile devices. Passwords, credit card numbers, and usernames are among the sensitive data stored on mobile devices. Therefore, during the forecast period, these factors drive the growth of the network performance monitoring market.
Market Restraining Factors
Exorbitant costs related to network monitoring
As more corporate functions go online, businesses must update their networks to provide capacity and new features. In addition to managing standard IT applications, networks increasingly need to serve a variety of business services like video conferencing and telephony, which require additional network bandwidth. Additionally, multicasting protocols, autoconfiguration protocols, protocols for new endpoint devices, and IP virtualization capabilities are required to deploy new services on shared network infrastructure. As a result, the high implementation costs for NPM solutions are severely impeding the market's expansion for network performance monitoring.
Component Outlook
Based on component, the network performance monitoring market is categorized into hardware and services. The hardware segment garnered the highest revenue share in the network performance monitoring market in 2021. Network performance reporting and analytics are crucial for network monitoring and optimization. Hardware for network performance monitoring offers visualization and reporting alternatives on a configurable dashboard that can imbibe all network data sources and offer real-time performance visibility.
Enterprise Size Outlook
On the basis of enterprise size, the network performance monitoring market is divided into SMEs and large enterprises. The small and medium sized enterprises segment procured a substantial revenue share in the network performance monitoring market in 2021. SMEs, or small and medium-sized businesses, are typically known to employ under 1,000 people. SMEs are increasingly using network performance monitoring to locate, manage, and regulate network datasets of various sizes. As many businesses lack the funding to monitor file sharing throughout their network infrastructures, maximum efficiency and cost reduction are regarded as essential aspects which NPM tools can provide.
End User Outlook
Based on end user, the network performance monitoring market is segmented into IT & telecom service providers, cloud service providers, governments & public sector units, and others. The IT & telecom service providers segment acquired the largest revenue share in the network performance monitoring market in 2021. One of the main factors propelling the segment's expansion is the significant growth of the telecommunications sector globally. The demand for comprehensive network infrastructure visibility is fueling the industry's expansion. With the requirement for data connectivity growing over the past few years, telecommunications networks have undergone a rapid transformation.
Regional Outlook
On the basis of region, the network performance monitoring market is analyzed across North America, Europe, Asia Pacific, and LAMEA. The North America segment witnessed the maximum revenue share in the network performance monitoring market in 2021. Growth is attributable to the region's abundance of businesses providing network performance monitoring products and services. In addition, the robust telecom sector in North America is a significant customer of network performance monitoring tools. The region also experiences a high adoption rate of cutting-edge technologies, like cloud-based technologies, propelling the North American market development for network performance monitoring.
The major strategies followed by the market participants are Acquisitions. Based on the Analysis presented in the Cardinal matrix; Microsoft Corporation is the forerunner in the Network Performance Monitoring Market. Companies such as Broadcom, Inc., Keysight Technologies, Inc., Cisco Systems, Inc. are some of the key innovators in Network Performance Monitoring Market.
The market research report covers the analysis of key stake holders of the market. Key companies profiled in the report include Broadcom, Inc., Microsoft Corporation, Cisco Systems, Inc., Juniper Networks, Inc., Keysight Technologies, Inc., SolarWinds Worldwide, LLC, LogicMonitor, Inc., Paessler AG, Profitap HQ B.V., and Nagios Enterprises, LLC.
Recent Strategies Deployed in Network Performance Monitoring Market
Partnership, Collaboration and Agreements:
Feb-2022: Microsoft Corporation joined hands with Qualcomm Technologies, an American company that creates semiconductors, software, and services related to wireless technology. Through this collaboration, the company aimed at simplifying the deployment and management of intelligent 5G edges for a broad range of industries and use cases. Additionally, it would lower the operating costs and adoption barriers for high-speed 5G connectivity solutions for global enterprises.
Jun-2021: Keysight Technologies teamed up with Analog Devices, a manufacturer of integrated circuits used in analog and digital signal processing. Through this collaboration, the company aimed at accelerating development and interoperability testing with technology and test solution offered by both the companies.
May-2021: Paessler AG entered into a partnership with Rhebo, a simple and effective cybersecurity, and intrusion detection provider. The Industrial Protector of Rhebo complements the company's classic monitoring with innovative solutions for anomaly detection in industrial networks.
Product Launch and Product Expansions:
Jul-2021: Profitap unveiled XX-12800G, a new high-density Network Packet Broker, with a total throughput of 12.8 Tbps in a single 19" rack unit for network traffic management. With 32 QSFP-DD ports (40/100/400 Gbps), the XX-12800G allows various features including Aggregation of traffic coming from multiple incoming links and Balance traffic over multiple monitoring and security tools for high bandwidth port monitoring.
Feb-2020: LogicMonitor released updates to Network Traffic Flow Analysis capabilities with the release of a new LogicMonitor UI. Network Traffic Flow Analysis is for Jflow, NetFlow, and Sflow protocols. The new Network Traffic Flow allows determining where their network traffic comes from, allowing them to manage challenging network conditions, such as congestion and overuse of network resources.
Acquisitions and Mergers:
Jan-2023: Microsoft Corporation completed the acquisition of Fungible, a developer of composable infrastructure for accelerating the company's data center network and storage performance. The acquisition would enable the company to enhance its broad range of technologies and offerings in offloading, improving latency, increasing system density in data centers, and reducing expenses.
Jan-2022: SolarWinds took over Monalytic, a monitoring, analytics, and professional services provider. The acquisition would enable the company to provide support to its federal customers for optimizing and securing their dynamic IT environments by integrating Monalytic's expertise with its easy-to-use IT management products.
Dec-2021: Broadcom Inc. took over AppNeta, a leading SaaS-based network performance monitoring solution provider. DX NetOps solutions combined with AppNeta would enable the company to monitor and manage digital experiences for any user across any cloud, mobile, SaaS or remote work scenario.
Oct-2021: Keysight Technologies took over SCALABLE Network Technologies, a communications network simulation, and modeling solutions provider. With this acquisition, the company aimed at delivering new software-centric, digital twin solutions to address the challenges customers' communication challenges.
Feb-2021: Keysight Technologies acquired Sanjole, a wireless physical layer, and data-link layer testing solution provider. The acquisition of Sanjole would complement the wireless test products of the company which include base station testers, network emulators, OTA test equipment, and network analyzers.
Oct-2020: SolarWinds announced an agreement to acquire SentryOne, a database performance monitoring and DataOps solutions provider. Through the acquisition, the company aimed at enhancing its support for IT companies.
Scope of the Study
Market Segments covered in the Report:
By End User
- IT & Telecom Service Providers
- Cloud Service Providers
- Governments & Public Sector Units
- Others
By Enterprise Size
- Large Enterprises
- Small & Medium Sized Enterprises
By Component
- Hardware
- Network Performance Monitoring Platforms
- Network Terminal Access Points (TAPs)
- Network Access Control (NAC) Appliances
- Network Packet Brokers (NPBs) Appliances
- Service
By Geography
- North America
- US
- Canada
- Mexico
- Rest of North America
- Europe
- Germany
- UK
- France
- Russia
- Spain
- Italy
- Rest of Europe
- Asia Pacific
- China
- Japan
- India
- South Korea
- Singapore
- Malaysia
- Rest of Asia Pacific
- LAMEA
- Brazil
- Argentina
- UAE
- Saudi Arabia
- South Africa
- Nigeria
- Rest of LAMEA
Companies Profiled
- Broadcom, Inc.
- Microsoft Corporation
- Cisco Systems, Inc.
- Juniper Networks, Inc.
- Keysight Technologies, Inc.
- SolarWinds Worldwide, LLC
- LogicMonitor, Inc.
- Paessler AG
- Profitap HQ B.V.
- Nagios Enterprises, LLC
Unique Offerings from KBV Research
- Exhaustive coverage
- Highest number of market tables and figures
- Subscription based model available
- Guaranteed best price
- Assured post sales research support with 10% customization free
Table of Contents
Chapter 1. Market Scope & Methodology
- 1.1 Market Definition
- 1.2 Objectives
- 1.3 Market Scope
- 1.4 Segmentation
- 1.4.1 Global Network Performance Monitoring Market, by End User
- 1.4.2 Global Network Performance Monitoring Market, by Enterprise Size
- 1.4.3 Global Network Performance Monitoring Market, by Component
- 1.4.4 Global Network Performance Monitoring Market, by Geography
- 1.5 Methodology for the research
Chapter 2. Market Overview
- 2.1 Introduction
- 2.1.1 Overview
- 2.1.1.1 Market Composition and Scenario
- 2.1.1 Overview
- 2.2 Key Factors Impacting the Market
- 2.2.1 Market Drivers
- 2.2.2 Market Restraints
Chapter 3. Competition Analysis - Global
- 3.1 KBV Cardinal Matrix
- 3.2 Recent Industry Wide Strategic Developments
- 3.2.1 Partnerships, Collaborations and Agreements
- 3.2.2 Product Launches and Product Expansions
- 3.2.3 Acquisition and Mergers
- 3.3 Market Share Analysis, 2021
- 3.4 Top Winning Strategies
- 3.4.1 Key Leading Strategies: Percentage Distribution (2018-2022)
- 3.4.2 Key Strategic Move: (Acquisition and Mergers: 2020, Oct - 2023, Jan) Leading Players
Chapter 4. Global Network Performance Monitoring Market by End User
- 4.1 Global IT & Telecom Service Providers Market by Region
- 4.2 Global Cloud Service Providers Market by Region
- 4.3 Global Governments & Public Sector Units Market by Region
- 4.4 Global Other End User Market by Region
Chapter 5. Global Network Performance Monitoring Market by Enterprise Size
- 5.1 Global Large Enterprises Market by Region
- 5.2 Global Small & Medium Sized Enterprises Market by Region
Chapter 6. Global Network Performance Monitoring Market by Component
- 6.1 Global Hardware Market by Region
- 6.2 Global Network Performance Monitoring Market by Hardware Type
- 6.2.1 Global Network Performance Monitoring Platforms Market by Region
- 6.2.2 Global Network Terminal Access Points (TAPs) Market by Region
- 6.2.3 Global Network Access Control (NAC) Appliances Market by Region
- 6.2.4 Global Network Packet Brokers (NPBs) Appliances Market by Region
- 6.3 Global Service Market by Region
Chapter 7. Global Network Performance Monitoring Market by Region
- 7.1 North America Network Performance Monitoring Market
- 7.1.1 North America Network Performance Monitoring Market by End User
- 7.1.1.1 North America IT & Telecom Service Providers Market by Country
- 7.1.1.2 North America Cloud Service Providers Market by Country
- 7.1.1.3 North America Governments & Public Sector Units Market by Country
- 7.1.1.4 North America Other End User Market by Country
- 7.1.2 North America Network Performance Monitoring Market by Enterprise Size
- 7.1.2.1 North America Large Enterprises Market by Country
- 7.1.2.2 North America Small & Medium Sized Enterprises Market by Country
- 7.1.3 North America Network Performance Monitoring Market by Component
- 7.1.3.1 North America Hardware Market by Country
- 7.1.3.2 North America Network Performance Monitoring Market by Hardware Type
- 7.1.3.2.1 North America Network Performance Monitoring Platforms Market by Country
- 7.1.3.2.2 North America Network Terminal Access Points (TAPs) Market by Country
- 7.1.3.2.3 North America Network Access Control (NAC) Appliances Market by Country
- 7.1.3.2.4 North America Network Packet Brokers (NPBs) Appliances Market by Country
- 7.1.3.3 North America Service Market by Country
- 7.1.4 North America Network Performance Monitoring Market by Country
- 7.1.4.1 US Network Performance Monitoring Market
- 7.1.4.1.1 US Network Performance Monitoring Market by End User
- 7.1.4.1.2 US Network Performance Monitoring Market by Enterprise Size
- 7.1.4.1.3 US Network Performance Monitoring Market by Component
- 7.1.4.1.3.1 US Network Performance Monitoring Market by Hardware Type
- 7.1.4.2 Canada Network Performance Monitoring Market
- 7.1.4.2.1 Canada Network Performance Monitoring Market by End User
- 7.1.4.2.2 Canada Network Performance Monitoring Market by Enterprise Size
- 7.1.4.2.3 Canada Network Performance Monitoring Market by Component
- 7.1.4.2.3.1 Canada Network Performance Monitoring Market by Hardware Type
- 7.1.4.3 Mexico Network Performance Monitoring Market
- 7.1.4.3.1 Mexico Network Performance Monitoring Market by End User
- 7.1.4.3.2 Mexico Network Performance Monitoring Market by Enterprise Size
- 7.1.4.3.3 Mexico Network Performance Monitoring Market by Component
- 7.1.4.3.3.1 Mexico Network Performance Monitoring Market by Hardware Type
- 7.1.4.4 Rest of North America Network Performance Monitoring Market
- 7.1.4.4.1 Rest of North America Network Performance Monitoring Market by End User
- 7.1.4.4.2 Rest of North America Network Performance Monitoring Market by Enterprise Size
- 7.1.4.4.3 Rest of North America Network Performance Monitoring Market by Component
- 7.1.4.4.3.1 Rest of North America Network Performance Monitoring Market by Hardware Type
- 7.1.4.1 US Network Performance Monitoring Market
- 7.1.1 North America Network Performance Monitoring Market by End User
- 7.2 Europe Network Performance Monitoring Market
- 7.2.1 Europe Network Performance Monitoring Market by End User
- 7.2.1.1 Europe IT & Telecom Service Providers Market by Country
- 7.2.1.2 Europe Cloud Service Providers Market by Country
- 7.2.1.3 Europe Governments & Public Sector Units Market by Country
- 7.2.1.4 Europe Other End User Market by Country
- 7.2.2 Europe Network Performance Monitoring Market by Enterprise Size
- 7.2.2.1 Europe Large Enterprises Market by Country
- 7.2.2.2 Europe Small & Medium Sized Enterprises Market by Country
- 7.2.3 Europe Network Performance Monitoring Market by Component
- 7.2.3.1 Europe Hardware Market by Country
- 7.2.3.2 Europe Network Performance Monitoring Market by Hardware Type
- 7.2.3.2.1 Europe Network Performance Monitoring Platforms Market by Country
- 7.2.3.2.2 Europe Network Terminal Access Points (TAPs) Market by Country
- 7.2.3.2.3 Europe Network Access Control (NAC) Appliances Market by Country
- 7.2.3.2.4 Europe Network Packet Brokers (NPBs) Appliances Market by Country
- 7.2.3.3 Europe Service Market by Country
- 7.2.4 Europe Network Performance Monitoring Market by Country
- 7.2.4.1 Germany Network Performance Monitoring Market
- 7.2.4.1.1 Germany Network Performance Monitoring Market by End User
- 7.2.4.1.2 Germany Network Performance Monitoring Market by Enterprise Size
- 7.2.4.1.3 Germany Network Performance Monitoring Market by Component
- 7.2.4.1.3.1 Germany Network Performance Monitoring Market by Hardware Type
- 7.2.4.2 UK Network Performance Monitoring Market
- 7.2.4.2.1 UK Network Performance Monitoring Market by End User
- 7.2.4.2.2 UK Network Performance Monitoring Market by Enterprise Size
- 7.2.4.2.3 UK Network Performance Monitoring Market by Component
- 7.2.4.2.3.1 UK Network Performance Monitoring Market by Hardware Type
- 7.2.4.3 France Network Performance Monitoring Market
- 7.2.4.3.1 France Network Performance Monitoring Market by End User
- 7.2.4.3.2 France Network Performance Monitoring Market by Enterprise Size
- 7.2.4.3.3 France Network Performance Monitoring Market by Component
- 7.2.4.3.3.1 France Network Performance Monitoring Market by Hardware Type
- 7.2.4.4 Russia Network Performance Monitoring Market
- 7.2.4.4.1 Russia Network Performance Monitoring Market by End User
- 7.2.4.4.2 Russia Network Performance Monitoring Market by Enterprise Size
- 7.2.4.4.3 Russia Network Performance Monitoring Market by Component
- 7.2.4.4.3.1 Russia Network Performance Monitoring Market by Hardware Type
- 7.2.4.5 Spain Network Performance Monitoring Market
- 7.2.4.5.1 Spain Network Performance Monitoring Market by End User
- 7.2.4.5.2 Spain Network Performance Monitoring Market by Enterprise Size
- 7.2.4.5.3 Spain Network Performance Monitoring Market by Component
- 7.2.4.5.3.1 Spain Network Performance Monitoring Market by Hardware Type
- 7.2.4.6 Italy Network Performance Monitoring Market
- 7.2.4.6.1 Italy Network Performance Monitoring Market by End User
- 7.2.4.6.2 Italy Network Performance Monitoring Market by Enterprise Size
- 7.2.4.6.3 Italy Network Performance Monitoring Market by Component
- 7.2.4.6.3.1 Italy Network Performance Monitoring Market by Hardware Type
- 7.2.4.7 Rest of Europe Network Performance Monitoring Market
- 7.2.4.7.1 Rest of Europe Network Performance Monitoring Market by End User
- 7.2.4.7.2 Rest of Europe Network Performance Monitoring Market by Enterprise Size
- 7.2.4.7.3 Rest of Europe Network Performance Monitoring Market by Component
- 7.2.4.7.3.1 Rest of Europe Network Performance Monitoring Market by Hardware Type
- 7.2.4.1 Germany Network Performance Monitoring Market
- 7.2.1 Europe Network Performance Monitoring Market by End User
- 7.3 Asia Pacific Network Performance Monitoring Market
- 7.3.1 Asia Pacific Network Performance Monitoring Market by End User
- 7.3.1.1 Asia Pacific IT & Telecom Service Providers Market by Country
- 7.3.1.2 Asia Pacific Cloud Service Providers Market by Country
- 7.3.1.3 Asia Pacific Governments & Public Sector Units Market by Country
- 7.3.1.4 Asia Pacific Other End User Market by Country
- 7.3.2 Asia Pacific Network Performance Monitoring Market by Enterprise Size
- 7.3.2.1 Asia Pacific Large Enterprises Market by Country
- 7.3.2.2 Asia Pacific Small & Medium Sized Enterprises Market by Country
- 7.3.3 Asia Pacific Network Performance Monitoring Market by Component
- 7.3.3.1 Asia Pacific Hardware Market by Country
- 7.3.3.2 Asia Pacific Network Performance Monitoring Market by Hardware Type
- 7.3.3.2.1 Asia Pacific Network Performance Monitoring Platforms Market by Country
- 7.3.3.2.2 Asia Pacific Network Terminal Access Points (TAPs) Market by Country
- 7.3.3.2.3 Asia Pacific Network Access Control (NAC) Appliances Market by Country
- 7.3.3.2.4 Asia Pacific Network Packet Brokers (NPBs) Appliances Market by Country
- 7.3.3.3 Asia Pacific Service Market by Country
- 7.3.4 Asia Pacific Network Performance Monitoring Market by Country
- 7.3.4.1 China Network Performance Monitoring Market
- 7.3.4.1.1 China Network Performance Monitoring Market by End User
- 7.3.4.1.2 China Network Performance Monitoring Market by Enterprise Size
- 7.3.4.1.3 China Network Performance Monitoring Market by Component
- 7.3.4.1.3.1 China Network Performance Monitoring Market by Hardware Type
- 7.3.4.2 Japan Network Performance Monitoring Market
- 7.3.4.2.1 Japan Network Performance Monitoring Market by End User
- 7.3.4.2.2 Japan Network Performance Monitoring Market by Enterprise Size
- 7.3.4.2.3 Japan Network Performance Monitoring Market by Component
- 7.3.4.2.3.1 Japan Network Performance Monitoring Market by Hardware Type
- 7.3.4.3 India Network Performance Monitoring Market
- 7.3.4.3.1 India Network Performance Monitoring Market by End User
- 7.3.4.3.2 India Network Performance Monitoring Market by Enterprise Size
- 7.3.4.3.3 India Network Performance Monitoring Market by Component
- 7.3.4.3.3.1 India Network Performance Monitoring Market by Hardware Type
- 7.3.4.4 South Korea Network Performance Monitoring Market
- 7.3.4.4.1 South Korea Network Performance Monitoring Market by End User
- 7.3.4.4.2 South Korea Network Performance Monitoring Market by Enterprise Size
- 7.3.4.4.3 South Korea Network Performance Monitoring Market by Component
- 7.3.4.4.3.1 South Korea Network Performance Monitoring Market by Hardware Type
- 7.3.4.5 Singapore Network Performance Monitoring Market
- 7.3.4.5.1 Singapore Network Performance Monitoring Market by End User
- 7.3.4.5.2 Singapore Network Performance Monitoring Market by Enterprise Size
- 7.3.4.5.3 Singapore Network Performance Monitoring Market by Component
- 7.3.4.5.3.1 Singapore Network Performance Monitoring Market by Hardware Type
- 7.3.4.6 Malaysia Network Performance Monitoring Market
- 7.3.4.6.1 Malaysia Network Performance Monitoring Market by End User
- 7.3.4.6.2 Malaysia Network Performance Monitoring Market by Enterprise Size
- 7.3.4.6.3 Malaysia Network Performance Monitoring Market by Component
- 7.3.4.6.3.1 Malaysia Network Performance Monitoring Market by Hardware Type
- 7.3.4.7 Rest of Asia Pacific Network Performance Monitoring Market
- 7.3.4.7.1 Rest of Asia Pacific Network Performance Monitoring Market by End User
- 7.3.4.7.2 Rest of Asia Pacific Network Performance Monitoring Market by Enterprise Size
- 7.3.4.7.3 Rest of Asia Pacific Network Performance Monitoring Market by Component
- 7.3.4.7.3.1 Rest of Asia Pacific Network Performance Monitoring Market by Hardware Type
- 7.3.4.1 China Network Performance Monitoring Market
- 7.3.1 Asia Pacific Network Performance Monitoring Market by End User
- 7.4 LAMEA Network Performance Monitoring Market
- 7.4.1 LAMEA Network Performance Monitoring Market by End User
- 7.4.1.1 LAMEA IT & Telecom Service Providers Market by Country
- 7.4.1.2 LAMEA Cloud Service Providers Market by Country
- 7.4.1.3 LAMEA Governments & Public Sector Units Market by Country
- 7.4.1.4 LAMEA Other End User Market by Country
- 7.4.2 LAMEA Network Performance Monitoring Market by Enterprise Size
- 7.4.2.1 LAMEA Large Enterprises Market by Country
- 7.4.2.2 LAMEA Small & Medium Sized Enterprises Market by Country
- 7.4.3 LAMEA Network Performance Monitoring Market by Component
- 7.4.3.1 LAMEA Hardware Market by Country
- 7.4.3.2 LAMEA Network Performance Monitoring Market by Hardware Type
- 7.4.3.2.1 LAMEA Network Performance Monitoring Platforms Market by Country
- 7.4.3.2.2 LAMEA Network Terminal Access Points (TAPs) Market by Country
- 7.4.3.2.3 LAMEA Network Access Control (NAC) Appliances Market by Country
- 7.4.3.2.4 LAMEA Network Packet Brokers (NPBs) Appliances Market by Country
- 7.4.3.3 LAMEA Service Market by Country
- 7.4.4 LAMEA Network Performance Monitoring Market by Country
- 7.4.4.1 Brazil Network Performance Monitoring Market
- 7.4.4.1.1 Brazil Network Performance Monitoring Market by End User
- 7.4.4.1.2 Brazil Network Performance Monitoring Market by Enterprise Size
- 7.4.4.1.3 Brazil Network Performance Monitoring Market by Component
- 7.4.4.1.3.1 Brazil Network Performance Monitoring Market by Hardware Type
- 7.4.4.2 Argentina Network Performance Monitoring Market
- 7.4.4.2.1 Argentina Network Performance Monitoring Market by End User
- 7.4.4.2.2 Argentina Network Performance Monitoring Market by Enterprise Size
- 7.4.4.2.3 Argentina Network Performance Monitoring Market by Component
- 7.4.4.2.3.1 Argentina Network Performance Monitoring Market by Hardware Type
- 7.4.4.3 UAE Network Performance Monitoring Market
- 7.4.4.3.1 UAE Network Performance Monitoring Market by End User
- 7.4.4.3.2 UAE Network Performance Monitoring Market by Enterprise Size
- 7.4.4.3.3 UAE Network Performance Monitoring Market by Component
- 7.4.4.3.3.1 UAE Network Performance Monitoring Market by Hardware Type
- 7.4.4.4 Saudi Arabia Network Performance Monitoring Market
- 7.4.4.4.1 Saudi Arabia Network Performance Monitoring Market by End User
- 7.4.4.4.2 Saudi Arabia Network Performance Monitoring Market by Enterprise Size
- 7.4.4.4.3 Saudi Arabia Network Performance Monitoring Market by Component
- 7.4.4.4.3.1 Saudi Arabia Network Performance Monitoring Market by Hardware Type
- 7.4.4.5 South Africa Network Performance Monitoring Market
- 7.4.4.5.1 South Africa Network Performance Monitoring Market by End User
- 7.4.4.5.2 South Africa Network Performance Monitoring Market by Enterprise Size
- 7.4.4.5.3 South Africa Network Performance Monitoring Market by Component
- 7.4.4.5.3.1 South Africa Network Performance Monitoring Market by Hardware Type
- 7.4.4.6 Nigeria Network Performance Monitoring Market
- 7.4.4.6.1 Nigeria Network Performance Monitoring Market by End User
- 7.4.4.6.2 Nigeria Network Performance Monitoring Market by Enterprise Size
- 7.4.4.6.3 Nigeria Network Performance Monitoring Market by Component
- 7.4.4.6.3.1 Nigeria Network Performance Monitoring Market by Hardware Type
- 7.4.4.7 Rest of LAMEA Network Performance Monitoring Market
- 7.4.4.7.1 Rest of LAMEA Network Performance Monitoring Market by End User
- 7.4.4.7.2 Rest of LAMEA Network Performance Monitoring Market by Enterprise Size
- 7.4.4.7.3 Rest of LAMEA Network Performance Monitoring Market by Component
- 7.4.4.7.3.1 Rest of LAMEA Network Performance Monitoring Market by Hardware Type
- 7.4.4.1 Brazil Network Performance Monitoring Market
- 7.4.1 LAMEA Network Performance Monitoring Market by End User
Chapter 8. Company Profiles
- 8.1 Broadcom, Inc.
- 8.1.1 Company Overview
- 8.1.2 Financial Analysis
- 8.1.3 Segmental and Regional Analysis
- 8.1.4 Research & Development Expense
- 8.1.5 Recent strategies and developments:
- 8.1.5.1 Acquisition and Mergers:
- 8.1.6 SWOT Analysis
- 8.2 Microsoft Corporation
- 8.2.1 Company Overview
- 8.2.2 Financial Analysis
- 8.2.3 Segmental and Regional Analysis
- 8.2.4 Research & Development Expenses
- 8.2.5 Recent strategies and developments:
- 8.2.5.1 Partnerships, Collaborations, and Agreements:
- 8.2.5.2 Acquisition and Mergers:
- 8.2.6 SWOT Analysis
- 8.3 Cisco Systems, Inc.
- 8.3.1 Company Overview
- 8.3.2 Financial Analysis
- 8.3.3 Regional Analysis
- 8.3.4 Research & Development Expense
- 8.3.5 SWOT Analysis
- 8.4 SolarWinds Corporation
- 8.4.1 Company Overview
- 8.4.2 Financial Analysis
- 8.4.3 Regional Analysis
- 8.4.4 Research and Development Expenses
- 8.4.5 Recent strategies and developments:
- 8.4.5.1 Acquisition and Mergers:
- 8.4.6 SWOT Analysis
- 8.5 Keysight Technologies, Inc.
- 8.5.1 Company Overview
- 8.5.2 Financial Analysis
- 8.5.3 Segmental and Regional Analysis
- 8.5.4 Research & Development Expense
- 8.5.5 Recent strategies and developments:
- 8.5.5.1 Partnerships, Collaborations, and Agreements:
- 8.5.5.2 Acquisition and Mergers:
- 8.6 Juniper Networks, Inc.
- 8.6.1 Company Overview
- 8.6.2 Financial Analysis
- 8.6.3 Regional Analysis
- 8.6.4 Research & Development Expenses
- 8.7 Logic Monitor, Inc.
- 8.7.1 Company Overview
- 8.7.2 Recent strategies and developments:
- 8.7.2.1 Product Launches and Product Expansions:
- 8.8 Paessler AG
- 8.8.1 Company Overview
- 8.8.2 Recent strategies and developments:
- 8.8.2.1 Partnerships, Collaborations, and Agreements:
- 8.8.2.2 Product Launches and Product Expansions:
- 8.9 Profitap HQ B.V
- 8.9.1 Company Overview
- 8.9.2 Recent strategies and developments:
- 8.9.2.1 Product Launches and Product Expansions:
- 8.10. Nagios Enterprises LLC
- 8.10.1 Company Overview