|
|
市場調査レポート
商品コード
1184296
パッシブ認証の世界市場規模、シェア、産業動向分析レポート:コンポーネント別(ソリューション、サービス)、機能別、展開別(オンプレミス、クラウド)、組織規模別、業種別、地域別展望・予測、2022年~2028年Global Passive Authentication Market Size, Share & Industry Trends Analysis Report By Component (Solution and Services), By Function, By Deployment (On-Premise and Cloud), By Organization Size, By Vertical, By Regional Outlook and Forecast, 2022 - 2028 |
||||||
|
|
|||||||


| パッシブ認証の世界市場規模、シェア、産業動向分析レポート:コンポーネント別(ソリューション、サービス)、機能別、展開別(オンプレミス、クラウド)、組織規模別、業種別、地域別展望・予測、2022年~2028年 |
|
出版日: 2022年12月30日
発行: KBV Research
ページ情報: 英文 306 Pages
納期: 即納可能
|
- 全表示
- 概要
- 図表
- 目次
パッシブ認証の世界市場規模は、2028年までに39億米ドルに達し、予測期間中にCAGR20.4%の市場成長率で上昇すると予測されています。
デジタル技術が普及して以来、顧客満足度とセキュリティを維持するための要件も増えています。企業は、顧客に喜んでもらうために創意工夫を凝らし、ユニークな体験を提供することでライバルの先を行くようになったのです。今日、消費者はより知的で、より高い期待を持っています。
インターネットがすべてを根本的に変えたため、顧客はデータや製品にすぐにアクセスすることを求めるようになりました。スムーズなショッピング体験、迅速な配達、シンプルな支払い方法などを求めているのです。
COVID-19の影響分析
COVID-19の大流行により世界経済は大きく減速し、現在の危機は世界経済のインターネットへの依存パターンを悪化させるだけであり、インターネットは引き続き重要な戦略的世界ビジネスエンジンです。世界経済フォーラムの「Global Risks Report 2020」によると、データ盗難、サイバー脅威、サイバーセキュリティリスクはすべて増加傾向にあります。パッシブ認証の市場は、前述のような側面から成長すると予測されています。今日のビジネス環境では、顧客やユーザーを適切に識別することは、重要な資産のセキュリティとプライバシーを確保するために不可欠です。パッシブ認証の主要な市場参入企業は、これらの企業を支援するために強力な戦略を打ち出しています。
市場成長の要因
現代企業におけるパッシブ認証の必要性の高まり
パスワード保護方式に代わる技術として、パッシブ認証システムがあります。パッシブ認証は、追加のセキュリティ対策の必要性を排除することができます。パッシブバイオメトリクス認証は、ハッキングが困難なため、ユーザーのクレデンシャルを安全に保護することができます。組織は、パッシブ認証技術のおかげで、新しい機能を統合し、顧客に多くの機会を与えることで、その働きかけを拡大しています。その結果、ユーザー認証は大幅にスピードアップし、よりシンプルになり、パッシブ認証の市場にも影響を及ぼしています。
時間の節約とユーザーアクセシビリティの向上
パッシブバイオメトリクスと行動分析の目的は、ユーザーの特徴的な行動パターンによってユーザーを認識することです。ユーザーは、すでに作成されたデジタルIDからデジタル署名を提出するだけでよいため、パッシブ認証は優れたユーザー体験の創造に貢献し、時間と労力の大幅な節約を実現します。アクセシビリティの向上と時間短縮が期待できることから、今後も継続的な拡大が見込まれています。
市場の抑制要因
データのセキュリティやプライバシーに関する懸念が高まっています。
パッシブ攻撃は、システムリソースを消費するのではなく、システムからデータを取得・利用しようとするものです。パッシブ攻撃は、情報を収集するためにトラフィックを監視または記録します。相手は情報を得るために通信を盗聴することを望んでいます。ビッグデータサーバーやその解析手法に対する数々の巧妙なサイバー脅威や攻撃が世界中で示されて以来、データセキュリティの重要性が高まり、政府や関係規制当局が機密データを保護するために導入している厳しい規制とコンプライアンスポリシーの導入が必須となっているのです。
コンポーネント別の展望
コンポーネントに基づいて、パッシブ認証市場はソリューションとサービスに分けられます。ソリューションカテゴリは2021年にパッシブ認証の最大の市場シェアを占めましたが、これは主にこの技術が急速に開拓され、市場拡大の魅力的な可能性が開かれたためです。音声バイオメトリクスは、PIN、パスワード、セキュリティ質問に対する回答などの従来の古めかしいセキュリティ手段に代わり、電話やオンライン取引の際に本人確認を行う、より安全で摩擦の少ない方法を提供します。
展開の展望
パッシブ認証市場は、デプロイメントに基づき、オンプレミスとクラウドに分けられます。2021年の市場貢献度が最も高いのは、オンプレミスのカテゴリーです。オンサイトでホストされるアプリケーションは、セキュリティ、適応性、パーソナライゼーションから大きな利益を得ることができます。これらの原因により、オンプレミス市場は拡大しています。また、予測期間中は、クラウドベースのサービスにおける技術開拓や中小企業間の熾烈な競争により、市場拡大の可能性が高まっています。
組織規模の展望
組織規模に基づき、パッシブ認証市場は、大企業と中小企業に分類されます。2021年の市場では、中小企業が実質的な収益シェアを占めています。新しく独創的なパッシブ認証ソリューションの採用により、世界規模でパッシブ認証の市場が活況を呈しています。さらに、世界中の中小企業によるパッシブ認証ソリューションの利用が増加することで、業界全体の成長が早まることが予想されます。
機能別の展望
パッシブ認証市場は、機能別に、コンプライアンス管理、マーケティング管理、リスク管理、その他に分けられます。2021年の第2位はマーケティングマネジメントです。企業が使用するマーケティング管理プラットフォームへのサイバー攻撃が急増し、データの窃取や新たなマーケティング戦略の実施に伴うパッシブ認証ソリューションの必要性が高まっています。マーケティング管理ソリューションのセキュアデータは、慎重に許可される必要があります。
業界別展望
パッシブ認証市場は、業界別では、BFSI、政府、IT・通信、小売・消費財、ヘルスケア、メディア・エンターテインメント、その他に分類されます。IT・通信は、2021年の市場において2番目に大きなセグメントを構成しています。クラウドベースのサービスを提供するには、クラウドで提供されるネットワーク接続を使用します。これらのサービスは、クラウド技術プロバイダーがホストする情報技術(IT)インフラを通じて、パッシブ認証ソリューションへの柔軟で拡張性の高いアクセスを提供しながら、総コストの削減を支援するものです。
地域別の展望
地域別に見ると、パッシブ認証市場は、北米、欧州、アジア太平洋、LAMEAに分けられます。欧州は、パッシブ認証ソリューションの認知度向上により、予測期間中に大きな成長を遂げると予想されます。パッシブ認証市場は、サイバー犯罪の増加やデータセキュリティに対する世界の需要によって、予測期間中に拡大することが予測されています。個人情報の盗難、データ漏洩、ハッキングなどのサイバー犯罪が頻発する中、パッシブ認証システムおよびソリューションの需要は、近い将来増加すると予測されています。
目次
第1章 市場の範囲と調査手法
- 市場の定義
- 目的
- 市場規模
- セグメンテーション
- パッシブ認証の世界市場:コンポーネント別
- パッシブ認証の世界市場、機能別
- パッシブ認証の世界市場、デプロイメント別
- パッシブ認証の世界市場、組織規模別
- パッシブ認証の世界市場、業界別
- パッシブ認証の世界市場、地域別
- 調査手法
第2章 市場概要
- イントロダクション
- 概要の説明
- 市場の構成とシナリオ
- 概要の説明
- 市場に影響を与える主な要因
- 市場促進要因
- 市場の抑制要因
第3章 パッシブ認証の世界市場:コンポーネント別
- ソリューションの世界市場:地域別
- サービスの世界市場:地域別
第4章 パッシブ認証の世界市場:機能別
- コンプライアンスマネジメントの世界市場:地域別
- マーケティング管理の世界市場:地域別
- リスクマネジメントの世界市場:地域別
- 世界のその他の市場:地域別
第5章 パッシブ認証の世界市場:デプロイメント別
- オンプレミスの世界市場:地域別
- クラウドの世界市場:地域別
第6章 パッシブ認証の世界市場:組織規模別
- 大企業の世界市場:地域別
- 世界の中小企業市場:地域別
第7章 パッシブ認証の世界市場:業界別市場
- BFSIの世界市場:地域別
- 世界のヘルスケア市場:地域別
- 政府機関の世界市場:地域別
- 小売・消費財の世界市場:地域別
- メディア&エンターテインメントの世界市場:地域別
- IT・通信の世界市場:地域別
- 地域別その他市場の世界市場
第8章 パッシブ認証の世界市場:地域別
- 北米
- 北米のパッシブ認証の国別市場
- 米国
- カナダ
- メキシコ
- その他北米地域
- 北米のパッシブ認証の国別市場
- 欧州
- 欧州パッシブ認証市場:国別
- ドイツ
- 英国
- フランス
- ロシア
- スペイン
- イタリア
- その他欧州
- 欧州パッシブ認証市場:国別
- アジア太平洋地域
- アジア太平洋地域のパッシブ認証の国別市場
- 中国
- 日本
- インド
- 韓国
- シンガポール
- マレーシア
- その他アジア太平洋地域
- アジア太平洋地域のパッシブ認証の国別市場
- LAMEA
- LAMEAのパッシブ認証市場:国別
- ブラジル
- アルゼンチン
- UAE
- サウジアラビア
- 南アフリカ共和国
- ナイジェリア
- LAMEAの他の地域
- LAMEAのパッシブ認証市場:国別
第9章 企業プロファイル
- Cisco Systems, Inc.
- IBM Corporation
- Nuance Communications, Inc.(Microsoft Corporation)
- NEC Corporation
- Fair Isaac Corporation(FICO)
- Experian PLC
- Equifax, Inc.
- RSA Security LLC(Symphony Technology Group)
- BioCatch Ltd.
LIST OF TABLES
- TABLE 1 Global Passive Authentication Market, 2018 - 2021, USD Million
- TABLE 2 Global Passive Authentication Market, 2022 - 2028, USD Million
- TABLE 3 Global Passive Authentication Market by Component, 2018 - 2021, USD Million
- TABLE 4 Global Passive Authentication Market by Component, 2022 - 2028, USD Million
- TABLE 5 Global Solution Market by Region, 2018 - 2021, USD Million
- TABLE 6 Global Solution Market by Region, 2022 - 2028, USD Million
- TABLE 7 Global Services Market by Region, 2018 - 2021, USD Million
- TABLE 8 Global Services Market by Region, 2022 - 2028, USD Million
- TABLE 9 Global Passive Authentication Market by Function, 2018 - 2021, USD Million
- TABLE 10 Global Passive Authentication Market by Function, 2022 - 2028, USD Million
- TABLE 11 Global Compliance Management Market by Region, 2018 - 2021, USD Million
- TABLE 12 Global Compliance Management Market by Region, 2022 - 2028, USD Million
- TABLE 13 Global Marketing Management Market by Region, 2018 - 2021, USD Million
- TABLE 14 Global Marketing Management Market by Region, 2022 - 2028, USD Million
- TABLE 15 Global Risk Management Market by Region, 2018 - 2021, USD Million
- TABLE 16 Global Risk Management Market by Region, 2022 - 2028, USD Million
- TABLE 17 Global Others Market by Region, 2018 - 2021, USD Million
- TABLE 18 Global Others Market by Region, 2022 - 2028, USD Million
- TABLE 19 Global Passive Authentication Market by Deployment, 2018 - 2021, USD Million
- TABLE 20 Global Passive Authentication Market by Deployment, 2022 - 2028, USD Million
- TABLE 21 Global On-Premise Market by Region, 2018 - 2021, USD Million
- TABLE 22 Global On-Premise Market by Region, 2022 - 2028, USD Million
- TABLE 23 Global Cloud Market by Region, 2018 - 2021, USD Million
- TABLE 24 Global Cloud Market by Region, 2022 - 2028, USD Million
- TABLE 25 Global Passive Authentication Market by Organization Size, 2018 - 2021, USD Million
- TABLE 26 Global Passive Authentication Market by Organization Size, 2022 - 2028, USD Million
- TABLE 27 Global Large Enterprises Market by Region, 2018 - 2021, USD Million
- TABLE 28 Global Large Enterprises Market by Region, 2022 - 2028, USD Million
- TABLE 29 Global Small & Medium Enterprises Market by Region, 2018 - 2021, USD Million
- TABLE 30 Global Small & Medium Enterprises Market by Region, 2022 - 2028, USD Million
- TABLE 31 Global Passive Authentication Market by Vertical, 2018 - 2021, USD Million
- TABLE 32 Global Passive Authentication Market by Vertical, 2022 - 2028, USD Million
- TABLE 33 Global BFSI Market by Region, 2018 - 2021, USD Million
- TABLE 34 Global BFSI Market by Region, 2022 - 2028, USD Million
- TABLE 35 Global Healthcare Market by Region, 2018 - 2021, USD Million
- TABLE 36 Global Healthcare Market by Region, 2022 - 2028, USD Million
- TABLE 37 Global Government Market by Region, 2018 - 2021, USD Million
- TABLE 38 Global Government Market by Region, 2022 - 2028, USD Million
- TABLE 39 Global Retail & Consumer Goods Market by Region, 2018 - 2021, USD Million
- TABLE 40 Global Retail & Consumer Goods Market by Region, 2022 - 2028, USD Million
- TABLE 41 Global Media & Entertainment Market by Region, 2018 - 2021, USD Million
- TABLE 42 Global Media & Entertainment Market by Region, 2022 - 2028, USD Million
- TABLE 43 Global IT & Telecom Market by Region, 2018 - 2021, USD Million
- TABLE 44 Global IT & Telecom Market by Region, 2022 - 2028, USD Million
- TABLE 45 Global Others Market by Region, 2018 - 2021, USD Million
- TABLE 46 Global Others Market by Region, 2022 - 2028, USD Million
- TABLE 47 Global Passive Authentication Market by Region, 2018 - 2021, USD Million
- TABLE 48 Global Passive Authentication Market by Region, 2022 - 2028, USD Million
- TABLE 49 North America Passive Authentication Market, 2018 - 2021, USD Million
- TABLE 50 North America Passive Authentication Market, 2022 - 2028, USD Million
- TABLE 51 North America Passive Authentication Market by Component, 2018 - 2021, USD Million
- TABLE 52 North America Passive Authentication Market by Component, 2022 - 2028, USD Million
- TABLE 53 North America Solution Market by Country, 2018 - 2021, USD Million
- TABLE 54 North America Solution Market by Country, 2022 - 2028, USD Million
- TABLE 55 North America Services Market by Country, 2018 - 2021, USD Million
- TABLE 56 North America Services Market by Country, 2022 - 2028, USD Million
- TABLE 57 North America Passive Authentication Market by Function, 2018 - 2021, USD Million
- TABLE 58 North America Passive Authentication Market by Function, 2022 - 2028, USD Million
- TABLE 59 North America Compliance Management Market by Country, 2018 - 2021, USD Million
- TABLE 60 North America Compliance Management Market by Country, 2022 - 2028, USD Million
- TABLE 61 North America Marketing Management Market by Country, 2018 - 2021, USD Million
- TABLE 62 North America Marketing Management Market by Country, 2022 - 2028, USD Million
- TABLE 63 North America Risk Management Market by Country, 2018 - 2021, USD Million
- TABLE 64 North America Risk Management Market by Country, 2022 - 2028, USD Million
- TABLE 65 North America Others Market by Country, 2018 - 2021, USD Million
- TABLE 66 North America Others Market by Country, 2022 - 2028, USD Million
- TABLE 67 North America Passive Authentication Market by Deployment, 2018 - 2021, USD Million
- TABLE 68 North America Passive Authentication Market by Deployment, 2022 - 2028, USD Million
- TABLE 69 North America On-Premise Market by Country, 2018 - 2021, USD Million
- TABLE 70 North America On-Premise Market by Country, 2022 - 2028, USD Million
- TABLE 71 North America Cloud Market by Country, 2018 - 2021, USD Million
- TABLE 72 North America Cloud Market by Country, 2022 - 2028, USD Million
- TABLE 73 North America Passive Authentication Market by Organization Size, 2018 - 2021, USD Million
- TABLE 74 North America Passive Authentication Market by Organization Size, 2022 - 2028, USD Million
- TABLE 75 North America Large Enterprises Market by Country, 2018 - 2021, USD Million
- TABLE 76 North America Large Enterprises Market by Country, 2022 - 2028, USD Million
- TABLE 77 North America Small & Medium Enterprises Market by Country, 2018 - 2021, USD Million
- TABLE 78 North America Small & Medium Enterprises Market by Country, 2022 - 2028, USD Million
- TABLE 79 North America Passive Authentication Market by Vertical, 2018 - 2021, USD Million
- TABLE 80 North America Passive Authentication Market by Vertical, 2022 - 2028, USD Million
- TABLE 81 North America BFSI Market by Country, 2018 - 2021, USD Million
- TABLE 82 North America BFSI Market by Country, 2022 - 2028, USD Million
- TABLE 83 North America Healthcare Market by Country, 2018 - 2021, USD Million
- TABLE 84 North America Healthcare Market by Country, 2022 - 2028, USD Million
- TABLE 85 North America Government Market by Country, 2018 - 2021, USD Million
- TABLE 86 North America Government Market by Country, 2022 - 2028, USD Million
- TABLE 87 North America Retail & Consumer Goods Market by Country, 2018 - 2021, USD Million
- TABLE 88 North America Retail & Consumer Goods Market by Country, 2022 - 2028, USD Million
- TABLE 89 North America Media & Entertainment Market by Country, 2018 - 2021, USD Million
- TABLE 90 North America Media & Entertainment Market by Country, 2022 - 2028, USD Million
- TABLE 91 North America IT & Telecom Market by Country, 2018 - 2021, USD Million
- TABLE 92 North America IT & Telecom Market by Country, 2022 - 2028, USD Million
- TABLE 93 North America Others Market by Country, 2018 - 2021, USD Million
- TABLE 94 North America Others Market by Country, 2022 - 2028, USD Million
- TABLE 95 North America Passive Authentication Market by Country, 2018 - 2021, USD Million
- TABLE 96 North America Passive Authentication Market by Country, 2022 - 2028, USD Million
- TABLE 97 US Passive Authentication Market, 2018 - 2021, USD Million
- TABLE 98 US Passive Authentication Market, 2022 - 2028, USD Million
- TABLE 99 US Passive Authentication Market by Component, 2018 - 2021, USD Million
- TABLE 100 US Passive Authentication Market by Component, 2022 - 2028, USD Million
- TABLE 101 US Passive Authentication Market by Function, 2018 - 2021, USD Million
- TABLE 102 US Passive Authentication Market by Function, 2022 - 2028, USD Million
- TABLE 103 US Passive Authentication Market by Deployment, 2018 - 2021, USD Million
- TABLE 104 US Passive Authentication Market by Deployment, 2022 - 2028, USD Million
- TABLE 105 US Passive Authentication Market by Organization Size, 2018 - 2021, USD Million
- TABLE 106 US Passive Authentication Market by Organization Size, 2022 - 2028, USD Million
- TABLE 107 US Passive Authentication Market by Vertical, 2018 - 2021, USD Million
- TABLE 108 US Passive Authentication Market by Vertical, 2022 - 2028, USD Million
- TABLE 109 Canada Passive Authentication Market, 2018 - 2021, USD Million
- TABLE 110 Canada Passive Authentication Market, 2022 - 2028, USD Million
- TABLE 111 Canada Passive Authentication Market by Component, 2018 - 2021, USD Million
- TABLE 112 Canada Passive Authentication Market by Component, 2022 - 2028, USD Million
- TABLE 113 Canada Passive Authentication Market by Function, 2018 - 2021, USD Million
- TABLE 114 Canada Passive Authentication Market by Function, 2022 - 2028, USD Million
- TABLE 115 Canada Passive Authentication Market by Deployment, 2018 - 2021, USD Million
- TABLE 116 Canada Passive Authentication Market by Deployment, 2022 - 2028, USD Million
- TABLE 117 Canada Passive Authentication Market by Organization Size, 2018 - 2021, USD Million
- TABLE 118 Canada Passive Authentication Market by Organization Size, 2022 - 2028, USD Million
- TABLE 119 Canada Passive Authentication Market by Vertical, 2018 - 2021, USD Million
- TABLE 120 Canada Passive Authentication Market by Vertical, 2022 - 2028, USD Million
- TABLE 121 Mexico Passive Authentication Market, 2018 - 2021, USD Million
- TABLE 122 Mexico Passive Authentication Market, 2022 - 2028, USD Million
- TABLE 123 Mexico Passive Authentication Market by Component, 2018 - 2021, USD Million
- TABLE 124 Mexico Passive Authentication Market by Component, 2022 - 2028, USD Million
- TABLE 125 Mexico Passive Authentication Market by Function, 2018 - 2021, USD Million
- TABLE 126 Mexico Passive Authentication Market by Function, 2022 - 2028, USD Million
- TABLE 127 Mexico Passive Authentication Market by Deployment, 2018 - 2021, USD Million
- TABLE 128 Mexico Passive Authentication Market by Deployment, 2022 - 2028, USD Million
- TABLE 129 Mexico Passive Authentication Market by Organization Size, 2018 - 2021, USD Million
- TABLE 130 Mexico Passive Authentication Market by Organization Size, 2022 - 2028, USD Million
- TABLE 131 Mexico Passive Authentication Market by Vertical, 2018 - 2021, USD Million
- TABLE 132 Mexico Passive Authentication Market by Vertical, 2022 - 2028, USD Million
- TABLE 133 Rest of North America Passive Authentication Market, 2018 - 2021, USD Million
- TABLE 134 Rest of North America Passive Authentication Market, 2022 - 2028, USD Million
- TABLE 135 Rest of North America Passive Authentication Market by Component, 2018 - 2021, USD Million
- TABLE 136 Rest of North America Passive Authentication Market by Component, 2022 - 2028, USD Million
- TABLE 137 Rest of North America Passive Authentication Market by Function, 2018 - 2021, USD Million
- TABLE 138 Rest of North America Passive Authentication Market by Function, 2022 - 2028, USD Million
- TABLE 139 Rest of North America Passive Authentication Market by Deployment, 2018 - 2021, USD Million
- TABLE 140 Rest of North America Passive Authentication Market by Deployment, 2022 - 2028, USD Million
- TABLE 141 Rest of North America Passive Authentication Market by Organization Size, 2018 - 2021, USD Million
- TABLE 142 Rest of North America Passive Authentication Market by Organization Size, 2022 - 2028, USD Million
- TABLE 143 Rest of North America Passive Authentication Market by Vertical, 2018 - 2021, USD Million
- TABLE 144 Rest of North America Passive Authentication Market by Vertical, 2022 - 2028, USD Million
- TABLE 145 Europe Passive Authentication Market, 2018 - 2021, USD Million
- TABLE 146 Europe Passive Authentication Market, 2022 - 2028, USD Million
- TABLE 147 Europe Passive Authentication Market by Component, 2018 - 2021, USD Million
- TABLE 148 Europe Passive Authentication Market by Component, 2022 - 2028, USD Million
- TABLE 149 Europe Solution Market by Country, 2018 - 2021, USD Million
- TABLE 150 Europe Solution Market by Country, 2022 - 2028, USD Million
- TABLE 151 Europe Services Market by Country, 2018 - 2021, USD Million
- TABLE 152 Europe Services Market by Country, 2022 - 2028, USD Million
- TABLE 153 Europe Passive Authentication Market by Function, 2018 - 2021, USD Million
- TABLE 154 Europe Passive Authentication Market by Function, 2022 - 2028, USD Million
- TABLE 155 Europe Compliance Management Market by Country, 2018 - 2021, USD Million
- TABLE 156 Europe Compliance Management Market by Country, 2022 - 2028, USD Million
- TABLE 157 Europe Marketing Management Market by Country, 2018 - 2021, USD Million
- TABLE 158 Europe Marketing Management Market by Country, 2022 - 2028, USD Million
- TABLE 159 Europe Risk Management Market by Country, 2018 - 2021, USD Million
- TABLE 160 Europe Risk Management Market by Country, 2022 - 2028, USD Million
- TABLE 161 Europe Others Market by Country, 2018 - 2021, USD Million
- TABLE 162 Europe Others Market by Country, 2022 - 2028, USD Million
- TABLE 163 Europe Passive Authentication Market by Deployment, 2018 - 2021, USD Million
- TABLE 164 Europe Passive Authentication Market by Deployment, 2022 - 2028, USD Million
- TABLE 165 Europe On-Premise Market by Country, 2018 - 2021, USD Million
- TABLE 166 Europe On-Premise Market by Country, 2022 - 2028, USD Million
- TABLE 167 Europe Cloud Market by Country, 2018 - 2021, USD Million
- TABLE 168 Europe Cloud Market by Country, 2022 - 2028, USD Million
- TABLE 169 Europe Passive Authentication Market by Organization Size, 2018 - 2021, USD Million
- TABLE 170 Europe Passive Authentication Market by Organization Size, 2022 - 2028, USD Million
- TABLE 171 Europe Large Enterprises Market by Country, 2018 - 2021, USD Million
- TABLE 172 Europe Large Enterprises Market by Country, 2022 - 2028, USD Million
- TABLE 173 Europe Small & Medium Enterprises Market by Country, 2018 - 2021, USD Million
- TABLE 174 Europe Small & Medium Enterprises Market by Country, 2022 - 2028, USD Million
- TABLE 175 Europe Passive Authentication Market by Vertical, 2018 - 2021, USD Million
- TABLE 176 Europe Passive Authentication Market by Vertical, 2022 - 2028, USD Million
- TABLE 177 Europe BFSI Market by Country, 2018 - 2021, USD Million
- TABLE 178 Europe BFSI Market by Country, 2022 - 2028, USD Million
- TABLE 179 Europe Healthcare Market by Country, 2018 - 2021, USD Million
- TABLE 180 Europe Healthcare Market by Country, 2022 - 2028, USD Million
- TABLE 181 Europe Government Market by Country, 2018 - 2021, USD Million
- TABLE 182 Europe Government Market by Country, 2022 - 2028, USD Million
- TABLE 183 Europe Retail & Consumer Goods Market by Country, 2018 - 2021, USD Million
- TABLE 184 Europe Retail & Consumer Goods Market by Country, 2022 - 2028, USD Million
- TABLE 185 Europe Media & Entertainment Market by Country, 2018 - 2021, USD Million
- TABLE 186 Europe Media & Entertainment Market by Country, 2022 - 2028, USD Million
- TABLE 187 Europe IT & Telecom Market by Country, 2018 - 2021, USD Million
- TABLE 188 Europe IT & Telecom Market by Country, 2022 - 2028, USD Million
- TABLE 189 Europe Others Market by Country, 2018 - 2021, USD Million
- TABLE 190 Europe Others Market by Country, 2022 - 2028, USD Million
- TABLE 191 Europe Passive Authentication Market by Country, 2018 - 2021, USD Million
- TABLE 192 Europe Passive Authentication Market by Country, 2022 - 2028, USD Million
- TABLE 193 Germany Passive Authentication Market, 2018 - 2021, USD Million
- TABLE 194 Germany Passive Authentication Market, 2022 - 2028, USD Million
- TABLE 195 Germany Passive Authentication Market by Component, 2018 - 2021, USD Million
- TABLE 196 Germany Passive Authentication Market by Component, 2022 - 2028, USD Million
- TABLE 197 Germany Passive Authentication Market by Function, 2018 - 2021, USD Million
- TABLE 198 Germany Passive Authentication Market by Function, 2022 - 2028, USD Million
- TABLE 199 Germany Passive Authentication Market by Deployment, 2018 - 2021, USD Million
- TABLE 200 Germany Passive Authentication Market by Deployment, 2022 - 2028, USD Million
- TABLE 201 Germany Passive Authentication Market by Organization Size, 2018 - 2021, USD Million
- TABLE 202 Germany Passive Authentication Market by Organization Size, 2022 - 2028, USD Million
- TABLE 203 Germany Passive Authentication Market by Vertical, 2018 - 2021, USD Million
- TABLE 204 Germany Passive Authentication Market by Vertical, 2022 - 2028, USD Million
- TABLE 205 UK Passive Authentication Market, 2018 - 2021, USD Million
- TABLE 206 UK Passive Authentication Market, 2022 - 2028, USD Million
- TABLE 207 UK Passive Authentication Market by Component, 2018 - 2021, USD Million
- TABLE 208 UK Passive Authentication Market by Component, 2022 - 2028, USD Million
- TABLE 209 UK Passive Authentication Market by Function, 2018 - 2021, USD Million
- TABLE 210 UK Passive Authentication Market by Function, 2022 - 2028, USD Million
- TABLE 211 UK Passive Authentication Market by Deployment, 2018 - 2021, USD Million
- TABLE 212 UK Passive Authentication Market by Deployment, 2022 - 2028, USD Million
- TABLE 213 UK Passive Authentication Market by Organization Size, 2018 - 2021, USD Million
- TABLE 214 UK Passive Authentication Market by Organization Size, 2022 - 2028, USD Million
- TABLE 215 UK Passive Authentication Market by Vertical, 2018 - 2021, USD Million
- TABLE 216 UK Passive Authentication Market by Vertical, 2022 - 2028, USD Million
- TABLE 217 France Passive Authentication Market, 2018 - 2021, USD Million
- TABLE 218 France Passive Authentication Market, 2022 - 2028, USD Million
- TABLE 219 France Passive Authentication Market by Component, 2018 - 2021, USD Million
- TABLE 220 France Passive Authentication Market by Component, 2022 - 2028, USD Million
- TABLE 221 France Passive Authentication Market by Function, 2018 - 2021, USD Million
- TABLE 222 France Passive Authentication Market by Function, 2022 - 2028, USD Million
- TABLE 223 France Passive Authentication Market by Deployment, 2018 - 2021, USD Million
- TABLE 224 France Passive Authentication Market by Deployment, 2022 - 2028, USD Million
- TABLE 225 France Passive Authentication Market by Organization Size, 2018 - 2021, USD Million
- TABLE 226 France Passive Authentication Market by Organization Size, 2022 - 2028, USD Million
- TABLE 227 France Passive Authentication Market by Vertical, 2018 - 2021, USD Million
- TABLE 228 France Passive Authentication Market by Vertical, 2022 - 2028, USD Million
- TABLE 229 Russia Passive Authentication Market, 2018 - 2021, USD Million
- TABLE 230 Russia Passive Authentication Market, 2022 - 2028, USD Million
- TABLE 231 Russia Passive Authentication Market by Component, 2018 - 2021, USD Million
- TABLE 232 Russia Passive Authentication Market by Component, 2022 - 2028, USD Million
- TABLE 233 Russia Passive Authentication Market by Function, 2018 - 2021, USD Million
- TABLE 234 Russia Passive Authentication Market by Function, 2022 - 2028, USD Million
- TABLE 235 Russia Passive Authentication Market by Deployment, 2018 - 2021, USD Million
- TABLE 236 Russia Passive Authentication Market by Deployment, 2022 - 2028, USD Million
- TABLE 237 Russia Passive Authentication Market by Organization Size, 2018 - 2021, USD Million
- TABLE 238 Russia Passive Authentication Market by Organization Size, 2022 - 2028, USD Million
- TABLE 239 Russia Passive Authentication Market by Vertical, 2018 - 2021, USD Million
- TABLE 240 Russia Passive Authentication Market by Vertical, 2022 - 2028, USD Million
- TABLE 241 Spain Passive Authentication Market, 2018 - 2021, USD Million
- TABLE 242 Spain Passive Authentication Market, 2022 - 2028, USD Million
- TABLE 243 Spain Passive Authentication Market by Component, 2018 - 2021, USD Million
- TABLE 244 Spain Passive Authentication Market by Component, 2022 - 2028, USD Million
- TABLE 245 Spain Passive Authentication Market by Function, 2018 - 2021, USD Million
- TABLE 246 Spain Passive Authentication Market by Function, 2022 - 2028, USD Million
- TABLE 247 Spain Passive Authentication Market by Deployment, 2018 - 2021, USD Million
- TABLE 248 Spain Passive Authentication Market by Deployment, 2022 - 2028, USD Million
- TABLE 249 Spain Passive Authentication Market by Organization Size, 2018 - 2021, USD Million
- TABLE 250 Spain Passive Authentication Market by Organization Size, 2022 - 2028, USD Million
- TABLE 251 Spain Passive Authentication Market by Vertical, 2018 - 2021, USD Million
- TABLE 252 Spain Passive Authentication Market by Vertical, 2022 - 2028, USD Million
- TABLE 253 Italy Passive Authentication Market, 2018 - 2021, USD Million
- TABLE 254 Italy Passive Authentication Market, 2022 - 2028, USD Million
- TABLE 255 Italy Passive Authentication Market by Component, 2018 - 2021, USD Million
- TABLE 256 Italy Passive Authentication Market by Component, 2022 - 2028, USD Million
- TABLE 257 Italy Passive Authentication Market by Function, 2018 - 2021, USD Million
- TABLE 258 Italy Passive Authentication Market by Function, 2022 - 2028, USD Million
- TABLE 259 Italy Passive Authentication Market by Deployment, 2018 - 2021, USD Million
- TABLE 260 Italy Passive Authentication Market by Deployment, 2022 - 2028, USD Million
- TABLE 261 Italy Passive Authentication Market by Organization Size, 2018 - 2021, USD Million
- TABLE 262 Italy Passive Authentication Market by Organization Size, 2022 - 2028, USD Million
- TABLE 263 Italy Passive Authentication Market by Vertical, 2018 - 2021, USD Million
- TABLE 264 Italy Passive Authentication Market by Vertical, 2022 - 2028, USD Million
- TABLE 265 Rest of Europe Passive Authentication Market, 2018 - 2021, USD Million
- TABLE 266 Rest of Europe Passive Authentication Market, 2022 - 2028, USD Million
- TABLE 267 Rest of Europe Passive Authentication Market by Component, 2018 - 2021, USD Million
- TABLE 268 Rest of Europe Passive Authentication Market by Component, 2022 - 2028, USD Million
- TABLE 269 Rest of Europe Passive Authentication Market by Function, 2018 - 2021, USD Million
- TABLE 270 Rest of Europe Passive Authentication Market by Function, 2022 - 2028, USD Million
- TABLE 271 Rest of Europe Passive Authentication Market by Deployment, 2018 - 2021, USD Million
- TABLE 272 Rest of Europe Passive Authentication Market by Deployment, 2022 - 2028, USD Million
- TABLE 273 Rest of Europe Passive Authentication Market by Organization Size, 2018 - 2021, USD Million
- TABLE 274 Rest of Europe Passive Authentication Market by Organization Size, 2022 - 2028, USD Million
- TABLE 275 Rest of Europe Passive Authentication Market by Vertical, 2018 - 2021, USD Million
- TABLE 276 Rest of Europe Passive Authentication Market by Vertical, 2022 - 2028, USD Million
- TABLE 277 Asia Pacific Passive Authentication Market, 2018 - 2021, USD Million
- TABLE 278 Asia Pacific Passive Authentication Market, 2022 - 2028, USD Million
- TABLE 279 Asia Pacific Passive Authentication Market by Component, 2018 - 2021, USD Million
- TABLE 280 Asia Pacific Passive Authentication Market by Component, 2022 - 2028, USD Million
- TABLE 281 Asia Pacific Solution Market by Country, 2018 - 2021, USD Million
- TABLE 282 Asia Pacific Solution Market by Country, 2022 - 2028, USD Million
- TABLE 283 Asia Pacific Services Market by Country, 2018 - 2021, USD Million
- TABLE 284 Asia Pacific Services Market by Country, 2022 - 2028, USD Million
- TABLE 285 Asia Pacific Passive Authentication Market by Function, 2018 - 2021, USD Million
- TABLE 286 Asia Pacific Passive Authentication Market by Function, 2022 - 2028, USD Million
- TABLE 287 Asia Pacific Compliance Management Market by Country, 2018 - 2021, USD Million
- TABLE 288 Asia Pacific Compliance Management Market by Country, 2022 - 2028, USD Million
- TABLE 289 Asia Pacific Marketing Management Market by Country, 2018 - 2021, USD Million
- TABLE 290 Asia Pacific Marketing Management Market by Country, 2022 - 2028, USD Million
- TABLE 291 Asia Pacific Risk Management Market by Country, 2018 - 2021, USD Million
- TABLE 292 Asia Pacific Risk Management Market by Country, 2022 - 2028, USD Million
- TABLE 293 Asia Pacific Others Market by Country, 2018 - 2021, USD Million
- TABLE 294 Asia Pacific Others Market by Country, 2022 - 2028, USD Million
- TABLE 295 Asia Pacific Passive Authentication Market by Deployment, 2018 - 2021, USD Million
- TABLE 296 Asia Pacific Passive Authentication Market by Deployment, 2022 - 2028, USD Million
- TABLE 297 Asia Pacific On-Premise Market by Country, 2018 - 2021, USD Million
- TABLE 298 Asia Pacific On-Premise Market by Country, 2022 - 2028, USD Million
- TABLE 299 Asia Pacific Cloud Market by Country, 2018 - 2021, USD Million
- TABLE 300 Asia Pacific Cloud Market by Country, 2022 - 2028, USD Million
- TABLE 301 Asia Pacific Passive Authentication Market by Organization Size, 2018 - 2021, USD Million
- TABLE 302 Asia Pacific Passive Authentication Market by Organization Size, 2022 - 2028, USD Million
- TABLE 303 Asia Pacific Large Enterprises Market by Country, 2018 - 2021, USD Million
- TABLE 304 Asia Pacific Large Enterprises Market by Country, 2022 - 2028, USD Million
- TABLE 305 Asia Pacific Small & Medium Enterprises Market by Country, 2018 - 2021, USD Million
- TABLE 306 Asia Pacific Small & Medium Enterprises Market by Country, 2022 - 2028, USD Million
- TABLE 307 Asia Pacific Passive Authentication Market by Vertical, 2018 - 2021, USD Million
- TABLE 308 Asia Pacific Passive Authentication Market by Vertical, 2022 - 2028, USD Million
- TABLE 309 Asia Pacific BFSI Market by Country, 2018 - 2021, USD Million
- TABLE 310 Asia Pacific BFSI Market by Country, 2022 - 2028, USD Million
- TABLE 311 Asia Pacific Healthcare Market by Country, 2018 - 2021, USD Million
- TABLE 312 Asia Pacific Healthcare Market by Country, 2022 - 2028, USD Million
- TABLE 313 Asia Pacific Government Market by Country, 2018 - 2021, USD Million
- TABLE 314 Asia Pacific Government Market by Country, 2022 - 2028, USD Million
- TABLE 315 Asia Pacific Retail & Consumer Goods Market by Country, 2018 - 2021, USD Million
- TABLE 316 Asia Pacific Retail & Consumer Goods Market by Country, 2022 - 2028, USD Million
- TABLE 317 Asia Pacific Media & Entertainment Market by Country, 2018 - 2021, USD Million
- TABLE 318 Asia Pacific Media & Entertainment Market by Country, 2022 - 2028, USD Million
- TABLE 319 Asia Pacific IT & Telecom Market by Country, 2018 - 2021, USD Million
- TABLE 320 Asia Pacific IT & Telecom Market by Country, 2022 - 2028, USD Million
- TABLE 321 Asia Pacific Others Market by Country, 2018 - 2021, USD Million
- TABLE 322 Asia Pacific Others Market by Country, 2022 - 2028, USD Million
- TABLE 323 Asia Pacific Passive Authentication Market by Country, 2018 - 2021, USD Million
- TABLE 324 Asia Pacific Passive Authentication Market by Country, 2022 - 2028, USD Million
- TABLE 325 China Passive Authentication Market, 2018 - 2021, USD Million
- TABLE 326 China Passive Authentication Market, 2022 - 2028, USD Million
- TABLE 327 China Passive Authentication Market by Component, 2018 - 2021, USD Million
- TABLE 328 China Passive Authentication Market by Component, 2022 - 2028, USD Million
- TABLE 329 China Passive Authentication Market by Function, 2018 - 2021, USD Million
- TABLE 330 China Passive Authentication Market by Function, 2022 - 2028, USD Million
- TABLE 331 China Passive Authentication Market by Deployment, 2018 - 2021, USD Million
- TABLE 332 China Passive Authentication Market by Deployment, 2022 - 2028, USD Million
- TABLE 333 China Passive Authentication Market by Organization Size, 2018 - 2021, USD Million
- TABLE 334 China Passive Authentication Market by Organization Size, 2022 - 2028, USD Million
- TABLE 335 China Passive Authentication Market by Vertical, 2018 - 2021, USD Million
- TABLE 336 China Passive Authentication Market by Vertical, 2022 - 2028, USD Million
- TABLE 337 Japan Passive Authentication Market, 2018 - 2021, USD Million
- TABLE 338 Japan Passive Authentication Market, 2022 - 2028, USD Million
- TABLE 339 Japan Passive Authentication Market by Component, 2018 - 2021, USD Million
- TABLE 340 Japan Passive Authentication Market by Component, 2022 - 2028, USD Million
- TABLE 341 Japan Passive Authentication Market by Function, 2018 - 2021, USD Million
- TABLE 342 Japan Passive Authentication Market by Function, 2022 - 2028, USD Million
- TABLE 343 Japan Passive Authentication Market by Deployment, 2018 - 2021, USD Million
- TABLE 344 Japan Passive Authentication Market by Deployment, 2022 - 2028, USD Million
- TABLE 345 Japan Passive Authentication Market by Organization Size, 2018 - 2021, USD Million
- TABLE 346 Japan Passive Authentication Market by Organization Size, 2022 - 2028, USD Million
- TABLE 347 Japan Passive Authentication Market by Vertical, 2018 - 2021, USD Million
- TABLE 348 Japan Passive Authentication Market by Vertical, 2022 - 2028, USD Million
- TABLE 349 India Passive Authentication Market, 2018 - 2021, USD Million
- TABLE 350 India Passive Authentication Market, 2022 - 2028, USD Million
- TABLE 351 India Passive Authentication Market by Component, 2018 - 2021, USD Million
- TABLE 352 India Passive Authentication Market by Component, 2022 - 2028, USD Million
- TABLE 353 India Passive Authentication Market by Function, 2018 - 2021, USD Million
- TABLE 354 India Passive Authentication Market by Function, 2022 - 2028, USD Million
- TABLE 355 India Passive Authentication Market by Deployment, 2018 - 2021, USD Million
- TABLE 356 India Passive Authentication Market by Deployment, 2022 - 2028, USD Million
- TABLE 357 India Passive Authentication Market by Organization Size, 2018 - 2021, USD Million
- TABLE 358 India Passive Authentication Market by Organization Size, 2022 - 2028, USD Million
- TABLE 359 India Passive Authentication Market by Vertical, 2018 - 2021, USD Million
- TABLE 360 India Passive Authentication Market by Vertical, 2022 - 2028, USD Million
- TABLE 361 South Korea Passive Authentication Market, 2018 - 2021, USD Million
- TABLE 362 South Korea Passive Authentication Market, 2022 - 2028, USD Million
- TABLE 363 South Korea Passive Authentication Market by Component, 2018 - 2021, USD Million
- TABLE 364 South Korea Passive Authentication Market by Component, 2022 - 2028, USD Million
- TABLE 365 South Korea Passive Authentication Market by Function, 2018 - 2021, USD Million
- TABLE 366 South Korea Passive Authentication Market by Function, 2022 - 2028, USD Million
- TABLE 367 South Korea Passive Authentication Market by Deployment, 2018 - 2021, USD Million
- TABLE 368 South Korea Passive Authentication Market by Deployment, 2022 - 2028, USD Million
- TABLE 369 South Korea Passive Authentication Market by Organization Size, 2018 - 2021, USD Million
- TABLE 370 South Korea Passive Authentication Market by Organization Size, 2022 - 2028, USD Million
- TABLE 371 South Korea Passive Authentication Market by Vertical, 2018 - 2021, USD Million
- TABLE 372 South Korea Passive Authentication Market by Vertical, 2022 - 2028, USD Million
- TABLE 373 Singapore Passive Authentication Market, 2018 - 2021, USD Million
- TABLE 374 Singapore Passive Authentication Market, 2022 - 2028, USD Million
- TABLE 375 Singapore Passive Authentication Market by Component, 2018 - 2021, USD Million
- TABLE 376 Singapore Passive Authentication Market by Component, 2022 - 2028, USD Million
- TABLE 377 Singapore Passive Authentication Market by Function, 2018 - 2021, USD Million
- TABLE 378 Singapore Passive Authentication Market by Function, 2022 - 2028, USD Million
- TABLE 379 Singapore Passive Authentication Market by Deployment, 2018 - 2021, USD Million
- TABLE 380 Singapore Passive Authentication Market by Deployment, 2022 - 2028, USD Million
- TABLE 381 Singapore Passive Authentication Market by Organization Size, 2018 - 2021, USD Million
- TABLE 382 Singapore Passive Authentication Market by Organization Size, 2022 - 2028, USD Million
- TABLE 383 Singapore Passive Authentication Market by Vertical, 2018 - 2021, USD Million
- TABLE 384 Singapore Passive Authentication Market by Vertical, 2022 - 2028, USD Million
- TABLE 385 Malaysia Passive Authentication Market, 2018 - 2021, USD Million
- TABLE 386 Malaysia Passive Authentication Market, 2022 - 2028, USD Million
- TABLE 387 Malaysia Passive Authentication Market by Component, 2018 - 2021, USD Million
- TABLE 388 Malaysia Passive Authentication Market by Component, 2022 - 2028, USD Million
- TABLE 389 Malaysia Passive Authentication Market by Function, 2018 - 2021, USD Million
- TABLE 390 Malaysia Passive Authentication Market by Function, 2022 - 2028, USD Million
- TABLE 391 Malaysia Passive Authentication Market by Deployment, 2018 - 2021, USD Million
- TABLE 392 Malaysia Passive Authentication Market by Deployment, 2022 - 2028, USD Million
- TABLE 393 Malaysia Passive Authentication Market by Organization Size, 2018 - 2021, USD Million
- TABLE 394 Malaysia Passive Authentication Market by Organization Size, 2022 - 2028, USD Million
- TABLE 395 Malaysia Passive Authentication Market by Vertical, 2018 - 2021, USD Million
- TABLE 396 Malaysia Passive Authentication Market by Vertical, 2022 - 2028, USD Million
- TABLE 397 Rest of Asia Pacific Passive Authentication Market, 2018 - 2021, USD Million
- TABLE 398 Rest of Asia Pacific Passive Authentication Market, 2022 - 2028, USD Million
- TABLE 399 Rest of Asia Pacific Passive Authentication Market by Component, 2018 - 2021, USD Million
- TABLE 400 Rest of Asia Pacific Passive Authentication Market by Component, 2022 - 2028, USD Million
- TABLE 401 Rest of Asia Pacific Passive Authentication Market by Function, 2018 - 2021, USD Million
- TABLE 402 Rest of Asia Pacific Passive Authentication Market by Function, 2022 - 2028, USD Million
- TABLE 403 Rest of Asia Pacific Passive Authentication Market by Deployment, 2018 - 2021, USD Million
- TABLE 404 Rest of Asia Pacific Passive Authentication Market by Deployment, 2022 - 2028, USD Million
- TABLE 405 Rest of Asia Pacific Passive Authentication Market by Organization Size, 2018 - 2021, USD Million
- TABLE 406 Rest of Asia Pacific Passive Authentication Market by Organization Size, 2022 - 2028, USD Million
- TABLE 407 Rest of Asia Pacific Passive Authentication Market by Vertical, 2018 - 2021, USD Million
- TABLE 408 Rest of Asia Pacific Passive Authentication Market by Vertical, 2022 - 2028, USD Million
- TABLE 409 LAMEA Passive Authentication Market, 2018 - 2021, USD Million
- TABLE 410 LAMEA Passive Authentication Market, 2022 - 2028, USD Million
- TABLE 411 LAMEA Passive Authentication Market by Component, 2018 - 2021, USD Million
- TABLE 412 LAMEA Passive Authentication Market by Component, 2022 - 2028, USD Million
- TABLE 413 LAMEA Solution Market by Country, 2018 - 2021, USD Million
- TABLE 414 LAMEA Solution Market by Country, 2022 - 2028, USD Million
- TABLE 415 LAMEA Services Market by Country, 2018 - 2021, USD Million
- TABLE 416 LAMEA Services Market by Country, 2022 - 2028, USD Million
- TABLE 417 LAMEA Passive Authentication Market by Function, 2018 - 2021, USD Million
- TABLE 418 LAMEA Passive Authentication Market by Function, 2022 - 2028, USD Million
- TABLE 419 LAMEA Compliance Management Market by Country, 2018 - 2021, USD Million
- TABLE 420 LAMEA Compliance Management Market by Country, 2022 - 2028, USD Million
- TABLE 421 LAMEA Marketing Management Market by Country, 2018 - 2021, USD Million
- TABLE 422 LAMEA Marketing Management Market by Country, 2022 - 2028, USD Million
- TABLE 423 LAMEA Risk Management Market by Country, 2018 - 2021, USD Million
- TABLE 424 LAMEA Risk Management Market by Country, 2022 - 2028, USD Million
- TABLE 425 LAMEA Others Market by Country, 2018 - 2021, USD Million
- TABLE 426 LAMEA Others Market by Country, 2022 - 2028, USD Million
- TABLE 427 LAMEA Passive Authentication Market by Deployment, 2018 - 2021, USD Million
- TABLE 428 LAMEA Passive Authentication Market by Deployment, 2022 - 2028, USD Million
- TABLE 429 LAMEA On-Premise Market by Country, 2018 - 2021, USD Million
- TABLE 430 LAMEA On-Premise Market by Country, 2022 - 2028, USD Million
- TABLE 431 LAMEA Cloud Market by Country, 2018 - 2021, USD Million
- TABLE 432 LAMEA Cloud Market by Country, 2022 - 2028, USD Million
- TABLE 433 LAMEA Passive Authentication Market by Organization Size, 2018 - 2021, USD Million
- TABLE 434 LAMEA Passive Authentication Market by Organization Size, 2022 - 2028, USD Million
- TABLE 435 LAMEA Large Enterprises Market by Country, 2018 - 2021, USD Million
- TABLE 436 LAMEA Large Enterprises Market by Country, 2022 - 2028, USD Million
- TABLE 437 LAMEA Small & Medium Enterprises Market by Country, 2018 - 2021, USD Million
- TABLE 438 LAMEA Small & Medium Enterprises Market by Country, 2022 - 2028, USD Million
- TABLE 439 LAMEA Passive Authentication Market by Vertical, 2018 - 2021, USD Million
- TABLE 440 LAMEA Passive Authentication Market by Vertical, 2022 - 2028, USD Million
- TABLE 441 LAMEA BFSI Market by Country, 2018 - 2021, USD Million
- TABLE 442 LAMEA BFSI Market by Country, 2022 - 2028, USD Million
- TABLE 443 LAMEA Healthcare Market by Country, 2018 - 2021, USD Million
- TABLE 444 LAMEA Healthcare Market by Country, 2022 - 2028, USD Million
- TABLE 445 LAMEA Government Market by Country, 2018 - 2021, USD Million
- TABLE 446 LAMEA Government Market by Country, 2022 - 2028, USD Million
- TABLE 447 LAMEA Retail & Consumer Goods Market by Country, 2018 - 2021, USD Million
- TABLE 448 LAMEA Retail & Consumer Goods Market by Country, 2022 - 2028, USD Million
- TABLE 449 LAMEA Media & Entertainment Market by Country, 2018 - 2021, USD Million
- TABLE 450 LAMEA Media & Entertainment Market by Country, 2022 - 2028, USD Million
- TABLE 451 LAMEA IT & Telecom Market by Country, 2018 - 2021, USD Million
- TABLE 452 LAMEA IT & Telecom Market by Country, 2022 - 2028, USD Million
- TABLE 453 LAMEA Others Market by Country, 2018 - 2021, USD Million
- TABLE 454 LAMEA Others Market by Country, 2022 - 2028, USD Million
- TABLE 455 LAMEA Passive Authentication Market by Country, 2018 - 2021, USD Million
- TABLE 456 LAMEA Passive Authentication Market by Country, 2022 - 2028, USD Million
- TABLE 457 Brazil Passive Authentication Market, 2018 - 2021, USD Million
- TABLE 458 Brazil Passive Authentication Market, 2022 - 2028, USD Million
- TABLE 459 Brazil Passive Authentication Market by Component, 2018 - 2021, USD Million
- TABLE 460 Brazil Passive Authentication Market by Component, 2022 - 2028, USD Million
- TABLE 461 Brazil Passive Authentication Market by Function, 2018 - 2021, USD Million
- TABLE 462 Brazil Passive Authentication Market by Function, 2022 - 2028, USD Million
- TABLE 463 Brazil Passive Authentication Market by Deployment, 2018 - 2021, USD Million
- TABLE 464 Brazil Passive Authentication Market by Deployment, 2022 - 2028, USD Million
- TABLE 465 Brazil Passive Authentication Market by Organization Size, 2018 - 2021, USD Million
- TABLE 466 Brazil Passive Authentication Market by Organization Size, 2022 - 2028, USD Million
- TABLE 467 Brazil Passive Authentication Market by Vertical, 2018 - 2021, USD Million
- TABLE 468 Brazil Passive Authentication Market by Vertical, 2022 - 2028, USD Million
- TABLE 469 Argentina Passive Authentication Market, 2018 - 2021, USD Million
- TABLE 470 Argentina Passive Authentication Market, 2022 - 2028, USD Million
- TABLE 471 Argentina Passive Authentication Market by Component, 2018 - 2021, USD Million
- TABLE 472 Argentina Passive Authentication Market by Component, 2022 - 2028, USD Million
- TABLE 473 Argentina Passive Authentication Market by Function, 2018 - 2021, USD Million
- TABLE 474 Argentina Passive Authentication Market by Function, 2022 - 2028, USD Million
- TABLE 475 Argentina Passive Authentication Market by Deployment, 2018 - 2021, USD Million
- TABLE 476 Argentina Passive Authentication Market by Deployment, 2022 - 2028, USD Million
- TABLE 477 Argentina Passive Authentication Market by Organization Size, 2018 - 2021, USD Million
- TABLE 478 Argentina Passive Authentication Market by Organization Size, 2022 - 2028, USD Million
- TABLE 479 Argentina Passive Authentication Market by Vertical, 2018 - 2021, USD Million
- TABLE 480 Argentina Passive Authentication Market by Vertical, 2022 - 2028, USD Million
- TABLE 481 UAE Passive Authentication Market, 2018 - 2021, USD Million
- TABLE 482 UAE Passive Authentication Market, 2022 - 2028, USD Million
- TABLE 483 UAE Passive Authentication Market by Component, 2018 - 2021, USD Million
- TABLE 484 UAE Passive Authentication Market by Component, 2022 - 2028, USD Million
- TABLE 485 UAE Passive Authentication Market by Function, 2018 - 2021, USD Million
- TABLE 486 UAE Passive Authentication Market by Function, 2022 - 2028, USD Million
- TABLE 487 UAE Passive Authentication Market by Deployment, 2018 - 2021, USD Million
- TABLE 488 UAE Passive Authentication Market by Deployment, 2022 - 2028, USD Million
- TABLE 489 UAE Passive Authentication Market by Organization Size, 2018 - 2021, USD Million
- TABLE 490 UAE Passive Authentication Market by Organization Size, 2022 - 2028, USD Million
- TABLE 491 UAE Passive Authentication Market by Vertical, 2018 - 2021, USD Million
- TABLE 492 UAE Passive Authentication Market by Vertical, 2022 - 2028, USD Million
- TABLE 493 Saudi Arabia Passive Authentication Market, 2018 - 2021, USD Million
- TABLE 494 Saudi Arabia Passive Authentication Market, 2022 - 2028, USD Million
- TABLE 495 Saudi Arabia Passive Authentication Market by Component, 2018 - 2021, USD Million
- TABLE 496 Saudi Arabia Passive Authentication Market by Component, 2022 - 2028, USD Million
- TABLE 497 Saudi Arabia Passive Authentication Market by Function, 2018 - 2021, USD Million
- TABLE 498 Saudi Arabia Passive Authentication Market by Function, 2022 - 2028, USD Million
- TABLE 499 Saudi Arabia Passive Authentication Market by Deployment, 2018 - 2021, USD Million
- TABLE 500 Saudi Arabia Passive Authentication Market by Deployment, 2022 - 2028, USD Million
- TABLE 501 Saudi Arabia Passive Authentication Market by Organization Size, 2018 - 2021, USD Million
- TABLE 502 Saudi Arabia Passive Authentication Market by Organization Size, 2022 - 2028, USD Million
- TABLE 503 Saudi Arabia Passive Authentication Market by Vertical, 2018 - 2021, USD Million
- TABLE 504 Saudi Arabia Passive Authentication Market by Vertical, 2022 - 2028, USD Million
- TABLE 505 South Africa Passive Authentication Market, 2018 - 2021, USD Million
- TABLE 506 South Africa Passive Authentication Market, 2022 - 2028, USD Million
- TABLE 507 South Africa Passive Authentication Market by Component, 2018 - 2021, USD Million
- TABLE 508 South Africa Passive Authentication Market by Component, 2022 - 2028, USD Million
- TABLE 509 South Africa Passive Authentication Market by Function, 2018 - 2021, USD Million
- TABLE 510 South Africa Passive Authentication Market by Function, 2022 - 2028, USD Million
- TABLE 511 South Africa Passive Authentication Market by Deployment, 2018 - 2021, USD Million
- TABLE 512 South Africa Passive Authentication Market by Deployment, 2022 - 2028, USD Million
- TABLE 513 South Africa Passive Authentication Market by Organization Size, 2018 - 2021, USD Million
- TABLE 514 South Africa Passive Authentication Market by Organization Size, 2022 - 2028, USD Million
- TABLE 515 South Africa Passive Authentication Market by Vertical, 2018 - 2021, USD Million
- TABLE 516 South Africa Passive Authentication Market by Vertical, 2022 - 2028, USD Million
- TABLE 517 Nigeria Passive Authentication Market, 2018 - 2021, USD Million
- TABLE 518 Nigeria Passive Authentication Market, 2022 - 2028, USD Million
- TABLE 519 Nigeria Passive Authentication Market by Component, 2018 - 2021, USD Million
- TABLE 520 Nigeria Passive Authentication Market by Component, 2022 - 2028, USD Million
- TABLE 521 Nigeria Passive Authentication Market by Function, 2018 - 2021, USD Million
- TABLE 522 Nigeria Passive Authentication Market by Function, 2022 - 2028, USD Million
- TABLE 523 Nigeria Passive Authentication Market by Deployment, 2018 - 2021, USD Million
- TABLE 524 Nigeria Passive Authentication Market by Deployment, 2022 - 2028, USD Million
- TABLE 525 Nigeria Passive Authentication Market by Organization Size, 2018 - 2021, USD Million
- TABLE 526 Nigeria Passive Authentication Market by Organization Size, 2022 - 2028, USD Million
- TABLE 527 Nigeria Passive Authentication Market by Vertical, 2018 - 2021, USD Million
- TABLE 528 Nigeria Passive Authentication Market by Vertical, 2022 - 2028, USD Million
- TABLE 529 Rest of LAMEA Passive Authentication Market, 2018 - 2021, USD Million
- TABLE 530 Rest of LAMEA Passive Authentication Market, 2022 - 2028, USD Million
- TABLE 531 Rest of LAMEA Passive Authentication Market by Component, 2018 - 2021, USD Million
- TABLE 532 Rest of LAMEA Passive Authentication Market by Component, 2022 - 2028, USD Million
- TABLE 533 Rest of LAMEA Passive Authentication Market by Function, 2018 - 2021, USD Million
- TABLE 534 Rest of LAMEA Passive Authentication Market by Function, 2022 - 2028, USD Million
- TABLE 535 Rest of LAMEA Passive Authentication Market by Deployment, 2018 - 2021, USD Million
- TABLE 536 Rest of LAMEA Passive Authentication Market by Deployment, 2022 - 2028, USD Million
- TABLE 537 Rest of LAMEA Passive Authentication Market by Organization Size, 2018 - 2021, USD Million
- TABLE 538 Rest of LAMEA Passive Authentication Market by Organization Size, 2022 - 2028, USD Million
- TABLE 539 Rest of LAMEA Passive Authentication Market by Vertical, 2018 - 2021, USD Million
- TABLE 540 Rest of LAMEA Passive Authentication Market by Vertical, 2022 - 2028, USD Million
- TABLE 541 Key Information - Cisco Systems, Inc.
- TABLE 542 Key information - IBM Corporation
- TABLE 543 Key Information - Nuance Communications, Inc.
- TABLE 544 KEY INFORMATION - NEC Corporation
- TABLE 545 Key Information - Fair Isaac Corporation
- TABLE 546 key information - Experian PLC
- TABLE 547 key information - Equifax, Inc.
- TABLE 548 Key Information - RSA Security LLC
- TABLE 549 Key Information - BioCatch Ltd.
List of Figures
- FIG 1 Methodology for the research
- FIG 2 Global Passive Authentication Market Share by Component, 2021
- FIG 3 Global Passive Authentication Market Share by Component, 2028
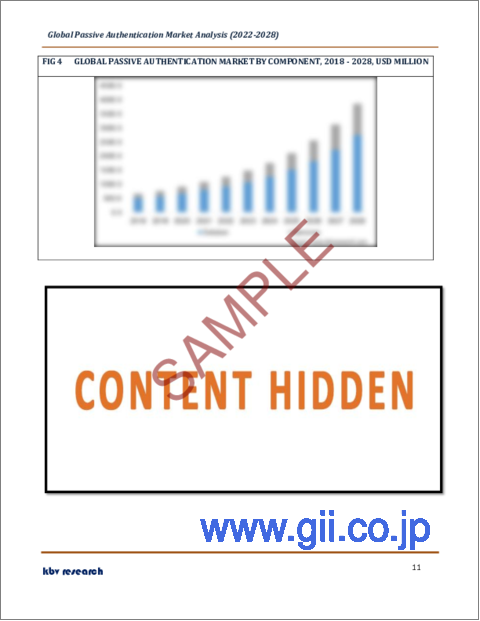
- FIG 4 Global Passive Authentication Market by Component, 2018 - 2028, USD Million
- FIG 5 Global Passive Authentication Market Share by Function, 2021
- FIG 6 Global Passive Authentication Market Share by Function, 2028
- FIG 7 Global Passive Authentication Market by Function, 2018 - 2028, USD Million
- FIG 8 Global Passive Authentication Market Share by Deployment, 2021
- FIG 9 Global Passive Authentication Market Share by Deployment, 2028
- FIG 10 Global Passive Authentication Market by Deployment, 2018 - 2028, USD Million
- FIG 11 Global Passive Authentication Market Share by Organization Size, 2021
- FIG 12 Global Passive Authentication Market Share by Organization Size, 2028
- FIG 13 Global Passive Authentication Market by Organization Size, 2018 - 2028, USD Million
- FIG 14 Global Passive Authentication Market Share by Vertical, 2021
- FIG 15 Global Passive Authentication Market Share by Vertical, 2028
- FIG 16 Global Passive Authentication Market by Vertical, 2018 - 2028, USD Million
- FIG 17 Global Passive Authentication Market Share by Region, 2021
- FIG 18 Global Passive Authentication Market Share by Region, 2028
- FIG 19 Global Passive Authentication Market by Region, 2018 - 2028, USD Million
- FIG 20 SWOT Analysis: Cisco Systems, Inc.
- FIG 21 Swot analysis: IBM Corporation
- FIG 22 SWOT Analysis: Microsoft Corporation
The Global Passive Authentication Market size is expected to reach $3.9 billion by 2028, rising at a market growth of 20.4% CAGR during the forecast period.
Passive authentication is a type of authentication that verifies a user's identity without requiring them to do any further specified steps for the objective of authentication. The user does not need to perform any further activities in order for this type of authentication to be considered frictionless; nonetheless, the user's behavior or other observable data are acquired and examined for evidence of identification without further user involvement.
More and more, internet services are offering secure access to users of all ages and abilities through the use of biometric verification technologies. Applications for the public sector and the government must be accessible to the widest audience feasible, whereas in the business world, creating a system that excludes people restricts the system's appeal and success.
Since digital technologies have grown in number, so has the requirement to maintain customer satisfaction and security. Businesses have been coming up with inventive ways to please their clients and remain ahead of their rivals by giving them a unique experience. Nowadays, consumers are much more intelligent, and they have far higher expectations.
Customers now demand immediate access to data and products because of the Internet, which has fundamentally transformed everything. They want a smooth shopping experience, lightning-quick deliveries, and simple payment methods.
COVID-19 Impact Analysis
The COVID-19 pandemic has resulted in a significant slowdown in the global economy, and the current crisis is only aggravating the pattern of global economic dependence on the Internet, which continues to be a vital strategic global business engine. Data theft, cyber threats, and cybersecurity risks are all on the rise, as per the World Economic Forum's Global Risks Report 2020. The market for passive authentication is predicted to grow as a result of the aforementioned aspect. In today's business climate, proper identification of customers and users is critical to ensuring the security and privacy of vital assets. Strong strategies have been put in place by major market participants in passive authentication to help these firms.
Market Growth Factors
The Rise in Passive Authentication Requirements for Modern Enterprises
A technologically advanced alternative to password protection schemes is a passive authentication system. The strength of passive authentication negates the need for additional security measures. The user credential is safe with passive biometric authentications since they are more difficult to hack. Organizations are expanding their outreach by integrating new capabilities and giving their customers more opportunities thanks to passive authentication techniques. As a result, user authentication is significantly sped up and made simpler, which has an effect on the market for passive authentication.
Time Savings and Improved User Accessibility
The goal of passive biometrics and behavioral analytics is to recognize users by their distinctive patterns of activity. Because users only need to submit their digital signatures from already created digital identities, passive authentication contributes to the creation of excellent user experiences, resulting in significant time and effort savings. Because of the market's increased accessibility and time-saving features, sustained expansion is expected.
Market Restraining Factors
Concerns about data security and privacy are growing.
A passive attack attempts to obtain or use data from the system rather than consuming system resources. Passive attacks monitor or record traffic in order to gather information. The opponent wants to eavesdrop on communications in order to get information. After the world witnessed numerous sophisticated cyber threats and attacks on big data servers and their analysis methods, the importance of data security has increased, making it mandatory to introduce strict regulations and compliance policies that governments and other concerned regulatory authorities have introduced to safeguard sensitive data.
Component Outlook
Based on Component, the Passive Authentication Market is divided into Solutions and Services. The solution category held the largest market share for passive authentication in 2021, mostly because of the technology's rapid development, which opened up an attractive potential for market expansion. Voice biometrics offers a more secure and frictionless method of authenticating identification during phone calls and online transactions in place of conventional and antiquated security measures like PINs, passwords, and responses to security questions.
Deployment Outlook
Based on Deployment, the Passive Authentication Market is divided into On-premise and Cloud. The market's largest contributor in 2021 was the on-premise category. Applications that are hosted on-site benefit greatly from security, adaptability, and personalization. The on-premise market is expanding as a result of these causes. Additionally, during the projection period, technical developments in cloud-based services and fierce rivalry among SMEs are offering good potential for market expansion.
Organization Size Outlook
Based on organization size, the Passive Authentication Market is classified into Large Enterprises and Small & Medium Enterprises. Small and medium-sized businesses had the substantial revenue share in the market in 2021. The adoption of new and inventive passive authentication solutions has led to a boom in the market for passive authentication on a global scale. Additionally, it is anticipated that the increased usage of passive authentication solutions by small and medium organizations around the world will hasten the growth of the industry as a whole.
Function Outlook
Based on function, the Passive Authentication Market is divided into Compliance Management, Marketing Management, Risk Management, and Others. The second-largest segment is marketing management in 2021. The necessity for passive authentication solutions for the company is increased by the surge in cyberattacks on marketing management platforms used by businesses to steal data and implement new marketing strategies. The secure data in the marketing management solutions need to be carefully permitted.
Vertical Outlook
Based on Vertical, the Passive Authentication Market is classified into the BFSI, Government, IT & Telecom, Retail & Consumer Goods, Healthcare, Media & Entertainment, and Others. IT and telecommunications make up the second-largest segment in the market in 2021. Delivering cloud-based services makes use of a network connection provided in the cloud. These services assist in reducing total costs while providing incredibly flexible and scalable access to passive authentication solutions via information technology (IT) infrastructure hosted by cloud technology providers.
Regional Outlook
Based on geography, the Passive Authentication Market is divided into North America, Europe, Asia Pacific, and LAMEA. Owing to increased authentication and awareness of passive authentication solutions, Europe is anticipated to experience considerable growth during the forecast period. Passive authentication market expansion is predicted to be fueled by the rising prevalence of cybercrimes and global demand for data security during the forecast period. The demand for passive authentication systems and solutions is anticipated to increase in the near future as cybercrimes, including identity theft, data breaches, and hacking, increase in frequency.
The market research report covers the analysis of key stake holders of the market. Key companies profiled in the report include Cisco Systems, Inc., IBM Corporation, NEC Corporation, Fair Isaac Corporation (FICO), Experian PLC, Nuance Communications, Inc. (Microsoft Corporation), Equifax Inc., RSA Security LLC (Symphony Technology Group), and BioCatch Ltd.
Scope of the Study
Market Segments covered in the Report:
By Component
- Solution
- Services
By Function
- Compliance Management
- Marketing Management
- Risk Management
- Others
By Deployment
- On-Premise
- Cloud
By Organization Size
- Large Enterprises
- Small & Medium Enterprises
By Vertical
- BFSI
- Healthcare
- Government
- Retail & Consumer Goods
- Media & Entertainment
- IT & Telecom
- Others
By Geography
- North America
- US
- Canada
- Mexico
- Rest of North America
- Europe
- Germany
- UK
- France
- Russia
- Spain
- Italy
- Rest of Europe
- Asia Pacific
- China
- Japan
- India
- South Korea
- Singapore
- Malaysia
- Rest of Asia Pacific
- LAMEA
- Brazil
- Argentina
- UAE
- Saudi Arabia
- South Africa
- Nigeria
- Rest of LAMEA
Companies Profiled
- Cisco Systems, Inc.
- IBM Corporation
- NEC Corporation
- Fair Isaac Corporation (FICO)
- Experian PLC
- Nuance Communications, Inc. (Microsoft Corporation)
- Equifax Inc.
- RSA Security LLC (Symphony Technology Group)
- BioCatch Ltd.
Unique Offerings from KBV Research
- Exhaustive coverage
- Highest number of market tables and figures
- Subscription based model available
- Guaranteed best price
- Assured post sales research support with 10% customization free
Table of Contents
Chapter 1. Market Scope & Methodology
- 1.1 Market Definition
- 1.2 Objectives
- 1.3 Market Scope
- 1.4 Segmentation
- 1.4.1 Global Passive Authentication Market, by Component
- 1.4.2 Global Passive Authentication Market, by Function
- 1.4.3 Global Passive Authentication Market, by Deployment
- 1.4.4 Global Passive Authentication Market, by Organization Size
- 1.4.5 Global Passive Authentication Market, by Vertical
- 1.4.6 Global Passive Authentication Market, by Geography
- 1.5 Methodology for the research
Chapter 2. Market Overview
- 2.1 Introduction
- 2.1.1 Overview
- 2.1.1.1 Market Composition and Scenario
- 2.1.1 Overview
- 2.2 Key Factors Impacting the Market
- 2.2.1 Market Drivers
- 2.2.2 Market Restraints
Chapter 3. Global Passive Authentication Market by Component
- 3.1 Global Solution Market by Region
- 3.2 Global Services Market by Region
Chapter 4. Global Passive Authentication Market by Function
- 4.1 Global Compliance Management Market by Region
- 4.2 Global Marketing Management Market by Region
- 4.3 Global Risk Management Market by Region
- 4.4 Global Others Market by Region
Chapter 5. Global Passive Authentication Market by Deployment
- 5.1 Global On-Premise Market by Region
- 5.2 Global Cloud Market by Region
Chapter 6. Global Passive Authentication Market by Organization Size
- 6.1 Global Large Enterprises Market by Region
- 6.2 Global Small & Medium Enterprises Market by Region
Chapter 7. Global Passive Authentication Market by Vertical
- 7.1 Global BFSI Market by Region
- 7.2 Global Healthcare Market by Region
- 7.3 Global Government Market by Region
- 7.4 Global Retail & Consumer Goods Market by Region
- 7.5 Global Media & Entertainment Market by Region
- 7.6 Global IT & Telecom Market by Region
- 7.7 Global Others Market by Region
Chapter 8. Global Passive Authentication Market by Region
- 8.1 North America Passive Authentication Market
- 8.1.1 North America Passive Authentication Market by Component
- 8.1.1.1 North America Solution Market by Country
- 8.1.1.2 North America Services Market by Country
- 8.1.2 North America Passive Authentication Market by Function
- 8.1.2.1 North America Compliance Management Market by Country
- 8.1.2.2 North America Marketing Management Market by Country
- 8.1.2.3 North America Risk Management Market by Country
- 8.1.2.4 North America Others Market by Country
- 8.1.3 North America Passive Authentication Market by Deployment
- 8.1.3.1 North America On-Premise Market by Country
- 8.1.3.2 North America Cloud Market by Country
- 8.1.4 North America Passive Authentication Market by Organization Size
- 8.1.4.1 North America Large Enterprises Market by Country
- 8.1.4.2 North America Small & Medium Enterprises Market by Country
- 8.1.5 North America Passive Authentication Market by Vertical
- 8.1.5.1 North America BFSI Market by Country
- 8.1.5.2 North America Healthcare Market by Country
- 8.1.5.3 North America Government Market by Country
- 8.1.5.4 North America Retail & Consumer Goods Market by Country
- 8.1.5.5 North America Media & Entertainment Market by Country
- 8.1.5.6 North America IT & Telecom Market by Country
- 8.1.5.7 North America Others Market by Country
- 8.1.6 North America Passive Authentication Market by Country
- 8.1.6.1 US Passive Authentication Market
- 8.1.6.1.1 US Passive Authentication Market by Component
- 8.1.6.1.2 US Passive Authentication Market by Function
- 8.1.6.1.3 US Passive Authentication Market by Deployment
- 8.1.6.1.4 US Passive Authentication Market by Organization Size
- 8.1.6.1.5 US Passive Authentication Market by Vertical
- 8.1.6.2 Canada Passive Authentication Market
- 8.1.6.2.1 Canada Passive Authentication Market by Component
- 8.1.6.2.2 Canada Passive Authentication Market by Function
- 8.1.6.2.3 Canada Passive Authentication Market by Deployment
- 8.1.6.2.4 Canada Passive Authentication Market by Organization Size
- 8.1.6.2.5 Canada Passive Authentication Market by Vertical
- 8.1.6.3 Mexico Passive Authentication Market
- 8.1.6.3.1 Mexico Passive Authentication Market by Component
- 8.1.6.3.2 Mexico Passive Authentication Market by Function
- 8.1.6.3.3 Mexico Passive Authentication Market by Deployment
- 8.1.6.3.4 Mexico Passive Authentication Market by Organization Size
- 8.1.6.3.5 Mexico Passive Authentication Market by Vertical
- 8.1.6.4 Rest of North America Passive Authentication Market
- 8.1.6.4.1 Rest of North America Passive Authentication Market by Component
- 8.1.6.4.2 Rest of North America Passive Authentication Market by Function
- 8.1.6.4.3 Rest of North America Passive Authentication Market by Deployment
- 8.1.6.4.4 Rest of North America Passive Authentication Market by Organization Size
- 8.1.6.4.5 Rest of North America Passive Authentication Market by Vertical
- 8.1.6.1 US Passive Authentication Market
- 8.1.1 North America Passive Authentication Market by Component
- 8.2 Europe Passive Authentication Market
- 8.2.1 Europe Passive Authentication Market by Component
- 8.2.1.1 Europe Solution Market by Country
- 8.2.1.2 Europe Services Market by Country
- 8.2.2 Europe Passive Authentication Market by Function
- 8.2.2.1 Europe Compliance Management Market by Country
- 8.2.2.2 Europe Marketing Management Market by Country
- 8.2.2.3 Europe Risk Management Market by Country
- 8.2.2.4 Europe Others Market by Country
- 8.2.3 Europe Passive Authentication Market by Deployment
- 8.2.3.1 Europe On-Premise Market by Country
- 8.2.3.2 Europe Cloud Market by Country
- 8.2.4 Europe Passive Authentication Market by Organization Size
- 8.2.4.1 Europe Large Enterprises Market by Country
- 8.2.4.2 Europe Small & Medium Enterprises Market by Country
- 8.2.5 Europe Passive Authentication Market by Vertical
- 8.2.5.1 Europe BFSI Market by Country
- 8.2.5.2 Europe Healthcare Market by Country
- 8.2.5.3 Europe Government Market by Country
- 8.2.5.4 Europe Retail & Consumer Goods Market by Country
- 8.2.5.5 Europe Media & Entertainment Market by Country
- 8.2.5.6 Europe IT & Telecom Market by Country
- 8.2.5.7 Europe Others Market by Country
- 8.2.6 Europe Passive Authentication Market by Country
- 8.2.6.1 Germany Passive Authentication Market
- 8.2.6.1.1 Germany Passive Authentication Market by Component
- 8.2.6.1.2 Germany Passive Authentication Market by Function
- 8.2.6.1.3 Germany Passive Authentication Market by Deployment
- 8.2.6.1.4 Germany Passive Authentication Market by Organization Size
- 8.2.6.1.5 Germany Passive Authentication Market by Vertical
- 8.2.6.2 UK Passive Authentication Market
- 8.2.6.2.1 UK Passive Authentication Market by Component
- 8.2.6.2.2 UK Passive Authentication Market by Function
- 8.2.6.2.3 UK Passive Authentication Market by Deployment
- 8.2.6.2.4 UK Passive Authentication Market by Organization Size
- 8.2.6.2.5 UK Passive Authentication Market by Vertical
- 8.2.6.3 France Passive Authentication Market
- 8.2.6.3.1 France Passive Authentication Market by Component
- 8.2.6.3.2 France Passive Authentication Market by Function
- 8.2.6.3.3 France Passive Authentication Market by Deployment
- 8.2.6.3.4 France Passive Authentication Market by Organization Size
- 8.2.6.3.5 France Passive Authentication Market by Vertical
- 8.2.6.4 Russia Passive Authentication Market
- 8.2.6.4.1 Russia Passive Authentication Market by Component
- 8.2.6.4.2 Russia Passive Authentication Market by Function
- 8.2.6.4.3 Russia Passive Authentication Market by Deployment
- 8.2.6.4.4 Russia Passive Authentication Market by Organization Size
- 8.2.6.4.5 Russia Passive Authentication Market by Vertical
- 8.2.6.5 Spain Passive Authentication Market
- 8.2.6.5.1 Spain Passive Authentication Market by Component
- 8.2.6.5.2 Spain Passive Authentication Market by Function
- 8.2.6.5.3 Spain Passive Authentication Market by Deployment
- 8.2.6.5.4 Spain Passive Authentication Market by Organization Size
- 8.2.6.5.5 Spain Passive Authentication Market by Vertical
- 8.2.6.6 Italy Passive Authentication Market
- 8.2.6.6.1 Italy Passive Authentication Market by Component
- 8.2.6.6.2 Italy Passive Authentication Market by Function
- 8.2.6.6.3 Italy Passive Authentication Market by Deployment
- 8.2.6.6.4 Italy Passive Authentication Market by Organization Size
- 8.2.6.6.5 Italy Passive Authentication Market by Vertical
- 8.2.6.7 Rest of Europe Passive Authentication Market
- 8.2.6.7.1 Rest of Europe Passive Authentication Market by Component
- 8.2.6.7.2 Rest of Europe Passive Authentication Market by Function
- 8.2.6.7.3 Rest of Europe Passive Authentication Market by Deployment
- 8.2.6.7.4 Rest of Europe Passive Authentication Market by Organization Size
- 8.2.6.7.5 Rest of Europe Passive Authentication Market by Vertical
- 8.2.6.1 Germany Passive Authentication Market
- 8.2.1 Europe Passive Authentication Market by Component
- 8.3 Asia Pacific Passive Authentication Market
- 8.3.1 Asia Pacific Passive Authentication Market by Component
- 8.3.1.1 Asia Pacific Solution Market by Country
- 8.3.1.2 Asia Pacific Services Market by Country
- 8.3.2 Asia Pacific Passive Authentication Market by Function
- 8.3.2.1 Asia Pacific Compliance Management Market by Country
- 8.3.2.2 Asia Pacific Marketing Management Market by Country
- 8.3.2.3 Asia Pacific Risk Management Market by Country
- 8.3.2.4 Asia Pacific Others Market by Country
- 8.3.3 Asia Pacific Passive Authentication Market by Deployment
- 8.3.3.1 Asia Pacific On-Premise Market by Country
- 8.3.3.2 Asia Pacific Cloud Market by Country
- 8.3.4 Asia Pacific Passive Authentication Market by Organization Size
- 8.3.4.1 Asia Pacific Large Enterprises Market by Country
- 8.3.4.2 Asia Pacific Small & Medium Enterprises Market by Country
- 8.3.5 Asia Pacific Passive Authentication Market by Vertical
- 8.3.5.1 Asia Pacific BFSI Market by Country
- 8.3.5.2 Asia Pacific Healthcare Market by Country
- 8.3.5.3 Asia Pacific Government Market by Country
- 8.3.5.4 Asia Pacific Retail & Consumer Goods Market by Country
- 8.3.5.5 Asia Pacific Media & Entertainment Market by Country
- 8.3.5.6 Asia Pacific IT & Telecom Market by Country
- 8.3.5.7 Asia Pacific Others Market by Country
- 8.3.6 Asia Pacific Passive Authentication Market by Country
- 8.3.6.1 China Passive Authentication Market
- 8.3.6.1.1 China Passive Authentication Market by Component
- 8.3.6.1.2 China Passive Authentication Market by Function
- 8.3.6.1.3 China Passive Authentication Market by Deployment
- 8.3.6.1.4 China Passive Authentication Market by Organization Size
- 8.3.6.1.5 China Passive Authentication Market by Vertical
- 8.3.6.2 Japan Passive Authentication Market
- 8.3.6.2.1 Japan Passive Authentication Market by Component
- 8.3.6.2.2 Japan Passive Authentication Market by Function
- 8.3.6.2.3 Japan Passive Authentication Market by Deployment
- 8.3.6.2.4 Japan Passive Authentication Market by Organization Size
- 8.3.6.2.5 Japan Passive Authentication Market by Vertical
- 8.3.6.3 India Passive Authentication Market
- 8.3.6.3.1 India Passive Authentication Market by Component
- 8.3.6.3.2 India Passive Authentication Market by Function
- 8.3.6.3.3 India Passive Authentication Market by Deployment
- 8.3.6.3.4 India Passive Authentication Market by Organization Size
- 8.3.6.3.5 India Passive Authentication Market by Vertical
- 8.3.6.4 South Korea Passive Authentication Market
- 8.3.6.4.1 South Korea Passive Authentication Market by Component
- 8.3.6.4.2 South Korea Passive Authentication Market by Function
- 8.3.6.4.3 South Korea Passive Authentication Market by Deployment
- 8.3.6.4.4 South Korea Passive Authentication Market by Organization Size
- 8.3.6.4.5 South Korea Passive Authentication Market by Vertical
- 8.3.6.5 Singapore Passive Authentication Market
- 8.3.6.5.1 Singapore Passive Authentication Market by Component
- 8.3.6.5.2 Singapore Passive Authentication Market by Function
- 8.3.6.5.3 Singapore Passive Authentication Market by Deployment
- 8.3.6.5.4 Singapore Passive Authentication Market by Organization Size
- 8.3.6.5.5 Singapore Passive Authentication Market by Vertical
- 8.3.6.6 Malaysia Passive Authentication Market
- 8.3.6.6.1 Malaysia Passive Authentication Market by Component
- 8.3.6.6.2 Malaysia Passive Authentication Market by Function
- 8.3.6.6.3 Malaysia Passive Authentication Market by Deployment
- 8.3.6.6.4 Malaysia Passive Authentication Market by Organization Size
- 8.3.6.6.5 Malaysia Passive Authentication Market by Vertical
- 8.3.6.7 Rest of Asia Pacific Passive Authentication Market
- 8.3.6.7.1 Rest of Asia Pacific Passive Authentication Market by Component
- 8.3.6.7.2 Rest of Asia Pacific Passive Authentication Market by Function
- 8.3.6.7.3 Rest of Asia Pacific Passive Authentication Market by Deployment
- 8.3.6.7.4 Rest of Asia Pacific Passive Authentication Market by Organization Size
- 8.3.6.7.5 Rest of Asia Pacific Passive Authentication Market by Vertical
- 8.3.6.1 China Passive Authentication Market
- 8.3.1 Asia Pacific Passive Authentication Market by Component
- 8.4 LAMEA Passive Authentication Market
- 8.4.1 LAMEA Passive Authentication Market by Component
- 8.4.1.1 LAMEA Solution Market by Country
- 8.4.1.2 LAMEA Services Market by Country
- 8.4.2 LAMEA Passive Authentication Market by Function
- 8.4.2.1 LAMEA Compliance Management Market by Country
- 8.4.2.2 LAMEA Marketing Management Market by Country
- 8.4.2.3 LAMEA Risk Management Market by Country
- 8.4.2.4 LAMEA Others Market by Country
- 8.4.3 LAMEA Passive Authentication Market by Deployment
- 8.4.3.1 LAMEA On-Premise Market by Country
- 8.4.3.2 LAMEA Cloud Market by Country
- 8.4.4 LAMEA Passive Authentication Market by Organization Size
- 8.4.4.1 LAMEA Large Enterprises Market by Country
- 8.4.4.2 LAMEA Small & Medium Enterprises Market by Country
- 8.4.5 LAMEA Passive Authentication Market by Vertical
- 8.4.5.1 LAMEA BFSI Market by Country
- 8.4.5.2 LAMEA Healthcare Market by Country
- 8.4.5.3 LAMEA Government Market by Country
- 8.4.5.4 LAMEA Retail & Consumer Goods Market by Country
- 8.4.5.5 LAMEA Media & Entertainment Market by Country
- 8.4.5.6 LAMEA IT & Telecom Market by Country
- 8.4.5.7 LAMEA Others Market by Country
- 8.4.6 LAMEA Passive Authentication Market by Country
- 8.4.6.1 Brazil Passive Authentication Market
- 8.4.6.1.1 Brazil Passive Authentication Market by Component
- 8.4.6.1.2 Brazil Passive Authentication Market by Function
- 8.4.6.1.3 Brazil Passive Authentication Market by Deployment
- 8.4.6.1.4 Brazil Passive Authentication Market by Organization Size
- 8.4.6.1.5 Brazil Passive Authentication Market by Vertical
- 8.4.6.2 Argentina Passive Authentication Market
- 8.4.6.2.1 Argentina Passive Authentication Market by Component
- 8.4.6.2.2 Argentina Passive Authentication Market by Function
- 8.4.6.2.3 Argentina Passive Authentication Market by Deployment
- 8.4.6.2.4 Argentina Passive Authentication Market by Organization Size
- 8.4.6.2.5 Argentina Passive Authentication Market by Vertical
- 8.4.6.3 UAE Passive Authentication Market
- 8.4.6.3.1 UAE Passive Authentication Market by Component
- 8.4.6.3.2 UAE Passive Authentication Market by Function
- 8.4.6.3.3 UAE Passive Authentication Market by Deployment
- 8.4.6.3.4 UAE Passive Authentication Market by Organization Size
- 8.4.6.3.5 UAE Passive Authentication Market by Vertical
- 8.4.6.4 Saudi Arabia Passive Authentication Market
- 8.4.6.4.1 Saudi Arabia Passive Authentication Market by Component
- 8.4.6.4.2 Saudi Arabia Passive Authentication Market by Function
- 8.4.6.4.3 Saudi Arabia Passive Authentication Market by Deployment
- 8.4.6.4.4 Saudi Arabia Passive Authentication Market by Organization Size
- 8.4.6.4.5 Saudi Arabia Passive Authentication Market by Vertical
- 8.4.6.5 South Africa Passive Authentication Market
- 8.4.6.5.1 South Africa Passive Authentication Market by Component
- 8.4.6.5.2 South Africa Passive Authentication Market by Function
- 8.4.6.5.3 South Africa Passive Authentication Market by Deployment
- 8.4.6.5.4 South Africa Passive Authentication Market by Organization Size
- 8.4.6.5.5 South Africa Passive Authentication Market by Vertical
- 8.4.6.6 Nigeria Passive Authentication Market
- 8.4.6.6.1 Nigeria Passive Authentication Market by Component
- 8.4.6.6.2 Nigeria Passive Authentication Market by Function
- 8.4.6.6.3 Nigeria Passive Authentication Market by Deployment
- 8.4.6.6.4 Nigeria Passive Authentication Market by Organization Size
- 8.4.6.6.5 Nigeria Passive Authentication Market by Vertical
- 8.4.6.7 Rest of LAMEA Passive Authentication Market
- 8.4.6.7.1 Rest of LAMEA Passive Authentication Market by Component
- 8.4.6.7.2 Rest of LAMEA Passive Authentication Market by Function
- 8.4.6.7.3 Rest of LAMEA Passive Authentication Market by Deployment
- 8.4.6.7.4 Rest of LAMEA Passive Authentication Market by Organization Size
- 8.4.6.7.5 Rest of LAMEA Passive Authentication Market by Vertical
- 8.4.6.1 Brazil Passive Authentication Market
- 8.4.1 LAMEA Passive Authentication Market by Component
Chapter 9. Company Profiles
- 9.1 Cisco Systems, Inc.
- 9.1.1 Company Overview
- 9.1.2 Financial Analysis
- 9.1.3 Regional Analysis
- 9.1.4 Research & Development Expense
- 9.1.5 SWOT Analysis
- 9.2 IBM Corporation
- 9.2.1 Company Overview
- 9.2.2 Financial Analysis
- 9.2.3 Regional & Segmental Analysis
- 9.2.4 Research & Development Expenses
- 9.2.5 SWOT Analysis
- 9.3 Nuance Communications, Inc. (Microsoft Corporation)
- 9.3.1 Company Overview
- 9.3.2 Financial Analysis
- 9.3.3 Segmental and Regional Analysis
- 9.3.4 Research & Development Expense
- 9.3.5 SWOT Analysis
- 9.4 NEC Corporation
- 9.4.1 Company Overview
- 9.4.2 Financial Analysis
- 9.4.3 Segmental and Regional Analysis
- 9.4.4 Research & Development Expenses
- 9.5 Fair Isaac Corporation (FICO)
- 9.5.1 Company Overview
- 9.5.2 Financial Analysis
- 9.5.3 Segmental and Regional Analysis
- 9.5.4 Research & Development Expenses
- 9.6 Experian PLC
- 9.6.1 Company Overview
- 9.6.2 Financial Analysis
- 9.6.3 Regional Analysis
- 9.7 Equifax, Inc.
- 9.7.1 Company Overview
- 9.7.2 Financial Analysis
- 9.7.3 Segmental and Regional Analysis
- 9.8 RSA Security LLC (Symphony Technology Group)
- 9.8.1 Company Overview
- 9.9 BioCatch Ltd.
- 9.9.1 Company Overview