|
|
市場調査レポート
商品コード
1172692
PEG化タンパク質の世界市場規模、シェア、産業動向分析レポート:製品・サービス別、タイプ別、エンドユーザー別、用途別、地域別展望・予測、2022年~2028年Global PEGylated Proteins Market Size, Share & Industry Trends Analysis Report By Product & Services, By Type, By End-user, By Application, By Regional Outlook and Forecast, 2022 - 2028 |
||||||
|
|
|||||||


| PEG化タンパク質の世界市場規模、シェア、産業動向分析レポート:製品・サービス別、タイプ別、エンドユーザー別、用途別、地域別展望・予測、2022年~2028年 |
|
出版日: 2022年11月30日
発行: KBV Research
ページ情報: 英文 278 Pages
納期: 即納可能
|
- 全表示
- 概要
- 図表
- 目次
PEG化タンパク質の世界市場規模は、2028年までに21億米ドルに達し、予測期間中に11.3%のCAGRで市場成長すると予測されています。
タンパク質の不活性必要基と組み合わせることで、無毒で親水性の高い高分子ポリマーの一種であるポリエチレングリコール(PEG)は、タンパク質医薬品の相対分子量を増加させ、帯電特性の表面に覆われている抗原決定基に対して何らかの変化を生じさせます。国内外において、PEG化技術をタンパク質医薬品に活用することに顕著な関心が持たれています。
市販されている様々なPEG化医薬品は、その治療上および商業上の有用性が完全に確立されています。タンパク質ベースの医薬品が非タンパク質ベースの医薬品よりも好まれるようになってきており、PEG化によってタンパク質の安定性と循環半減期が向上するため、予測期間を通じてPEG化タンパク質産業の拡大を促進すると予想されています。
業界成長の主な要因は、がん、腎臓病、関節リウマチのような慢性疾患の有病率が増加していることです。例えば、IARC(国際がん研究機関)の推計によると、2020年には世界で1,930万人の新規がん患者が発生し、1,030万人が死亡すると予想されています。
COVID-19の影響度分析
COVID-19のパンデミックは、この分野にとって有益でした。政府や大手企業は、COVID-19予防のための最先端の薬物候補の作成に投資を増やしました。新しいワクチン、診断薬、現行薬の再利用のための研究開発の増加は、投資の増加と密接に関連していました。例えば、インドの製薬会社であるザイダス・カディラは、2021年4月に、同社のPEG化インターフェロンα2b既存薬を軽症例のCOVID-19患者の治療に使用するための緊急使用承認(EUA)を取得しました。同薬は以前、B型肝炎の治療薬として承認されていましたが、インド全土での広範な検討と臨床試験を経て、COVID-19に再利用されることになりました。
市場の成長要因
PEG化タンパク質は、より頻繁に、さまざまな用途で使用されるようになってきています。
より安定した非免疫原性の医薬品の開発は、PEG化タンパク質プロセスの大きな改善によって可能となり、世界のPEG化タンパク質市場の成長を加速させると予測されています。がん患者の膨大な増加を考えると、このアプローチはがんの治療において強い適用性を持っています。世界保健機関(WHO)は、2018年に世界で960万人ががんで命を落としたと推定しています。PEG化された後、CCNファミリーのタンパク質は、血液がんの治療に採用することができます。
世界的に高まるがんの割合
死因の第2位であるがんは、全死亡者数のかなりの割合を占めています。富裕国は発展途上国に比べ、がん罹患率がかなり高いです。これらの発展途上国では、人口増加、高齢化、既知の危険因子の増加により、ますます顕著になることが予想されます。先進国では肺がんは男性のみのがん関連死の主要原因の一つであり、新興国では乳がんががん関連死の主要原因となっています。
市場抑制要因
単離・精製の課題
タンパク質のPEG化は複雑なプロセスであり、タンパク質の組成や使用目的に応じてさまざまな方法で実施されます。不活性なPEGストリングは、目的のタンパク質と共有結合または非共有結合で複合化されます。もう一つの重要なステップは、PEG化されたタンパク質の精製であり、これは主にクロマトグラフィーと静電相互作用または分子サイズによって達成されます。貧血、腎臓病、多発性硬化症、血友病、悪性腫瘍などの症状に対して、多くのPEG化薬剤が使用されています。
製品およびサービスの展望
製品・サービス別に見ると、市場は消耗品とサービスに分けられます。市場の実質的な収益シェアは、サービス部門が示しています。PEG化タンパク質のサービスには、直鎖型と分岐型の両方があり、さまざまな分子量のPEGを使用することができます。ペプチドやタンパク質は、化学的に不安定で血液循環が速く、免疫反応を引き起こす性質があるため、治療への利用には限界があります。
タイプ別の展望
市場はタイプ別に、コロニー刺激因子、インターフェロン、エリスロポエチン、遺伝子組換え第VII因子、その他に分類されます。エリスロポエチンは、市場の楽観的な成長ペースを示しています。エリスロポエチン製剤の拡大は、末期腎不全、がん、HIV、神経疾患などの慢性疾患の有病率の増加によって推進されています。エリスロポエチン(EPO)を模倣した薬剤は、がん、HIV、腎臓病患者における重度の貧血の治療に使用することが可能です。
アプリケーションの展望
アプリケーション別に見ると、市場はがん、自己免疫疾患、肝炎、多発性硬化症、血友病、消化器疾患、その他に分けられます。その他のセグメントについては、有望な成長率を示しています。タンパク質ドラッグデリバリーおよびその他の疾患は、その他のセクションに含まれます。PEG化タンパク質の市場は、慢性疾患の頻度上昇の結果として成長すると予想されます。PEG化タンパク質は、体内での物質の安定性を高めることにより、標準的な薬剤に比べて薬効を向上させることができます。
エンドユーザー向け展望
市場はエンドユーザーによって、製薬・バイオテクノロジー企業、受託研究機関、学術・研究機関に分けられます。業界で大きな収益シェアを占めているのは、研究開発受託機関(CRO)です。CROは現在、受託研究および医薬品の製造における外部からの支援に対する需要が高まっているため、より普及しています。さらに、手間のかからないプロセスとFDAの認可により、バイオテクノロジーや製薬業界は現在、CROにサポートを依頼しています。
地域別の展望
地域別に見ると、市場は北米、欧州、アジア太平洋、LAMEAに分類されます。2021年は、北米が市場をリードし、最大のシェアを占めました。この地域のヘルスケアインフラは、不調や疾病の発生、慢性疾患、現代治療に対する人口の意識の結果として成長してきました。生物製剤に基づく研究活動のための資金や助成金の増加は、改善されたインフラとより良い経済状況の存在によって促進されます。
目次
第1章 市場の範囲と調査手法
- 市場の定義
- 目的
- 市場規模
- セグメンテーション
- PEG化タンパク質の世界市場、製品・サービス別
- PEG化タンパク質の世界市場、タイプ別
- PEG化タンパク質の世界市場、エンドユーザー別
- PEG化タンパク質の世界市場、用途別
- PEG化タンパク質の世界市場、地域別
- 調査手法
第2章 市場概要
- イントロダクション
- 概要の説明
- 市場の構成とシナリオ
- 概要の説明
- 市場に影響を与える主な要因
- 市場の促進要因
- 市場の抑制要因
第3章 PEG化タンパク質市場で展開されている戦略
第4章 PEG化タンパク質の世界市場:製品・サービス別
- 消耗品の世界市場:地域別
- サービスの世界市場:地域別
第5章 PEG化タンパク質の世界市場:タイプ別
- コロニー刺激因子の世界市場:地域別
- インターフェロンの世界市場:地域別
- 遺伝子組換え第VII因子の世界市場:地域別
- エリスロポエチンの世界市場:地域別
- その他の地域別世界市場
第6章 PEG化タンパク質の世界市場:エンドユーザー別
- 世界の製薬会社・バイオテクノロジー企業の地域別市場
- 受託研究機関(CRO)の世界市場:地域別
- 世界の学術・研究機関市場:地域別
第7章 PEG化タンパク質の世界市場:アプリケーション別
- がんの世界市場:地域別
- 自己免疫疾患の世界市場:地域別
- 肝炎の世界市場:地域別
- 多発性硬化症の世界市場:地域別
- 血友病の世界市場:地域別
- 消化器系疾患の世界市場:地域別
- 地域別世界のその他市場
第8章 PEG化タンパク質の世界市場:地域別市場
- 北米
- 北米のPEG化タンパク質の国別市場
- 米国
- カナダ
- メキシコ
- その他北米地域
- 北米のPEG化タンパク質の国別市場
- 欧州
- 欧州のPEG化タンパク質の国別市場
- ドイツ
- 英国
- フランス
- ロシア
- スペイン
- イタリア
- その他欧州
- 欧州のPEG化タンパク質の国別市場
- アジア太平洋地域
- アジア太平洋地域のPEG化タンパク質の国別市場
- 中国
- 日本
- インド
- 韓国
- シンガポール
- マレーシア
- その他アジア太平洋地域
- アジア太平洋地域のPEG化タンパク質の国別市場
- LAMEA
- LAMEAのPEG化蛋白質市場:国別
- ブラジル
- アルゼンチン
- UAE
- サウジアラビア
- 南アフリカ
- ナイジェリア
- LAMEAの他の地域
- LAMEAのPEG化蛋白質市場:国別
第9章 企業プロファイル
- Thermo Fisher Scientific, Inc.
- Merck Millipore(Merck Group)
- NOF Corporation
- Beijing Jiankai Technology Co., Ltd.(Jenkem)
- Creative PEGworks
- Celares GmbH
- Quanta BioDesign Ltd.
- Biomatrik, Inc.
- Iris Biotech GmbH
- Laysan Bio, Inc.
LIST OF TABLES
- TABLE 1 Global PEGylated Proteins Market, 2018 - 2021, USD Million
- TABLE 2 Global PEGylated Proteins Market, 2022 - 2028, USD Million
- TABLE 3 Global PEGylated Proteins Market by Product & Services, 2018 - 2021, USD Million
- TABLE 4 Global PEGylated Proteins Market by Product & Services, 2022 - 2028, USD Million
- TABLE 5 Global Consumables Market by Region, 2018 - 2021, USD Million
- TABLE 6 Global Consumables Market by Region, 2022 - 2028, USD Million
- TABLE 7 Global Services Market by Region, 2018 - 2021, USD Million
- TABLE 8 Global Services Market by Region, 2022 - 2028, USD Million
- TABLE 9 Global PEGylated Proteins Market by Type, 2018 - 2021, USD Million
- TABLE 10 Global PEGylated Proteins Market by Type, 2022 - 2028, USD Million
- TABLE 11 Global Colony-stimulating Factor Market by Region, 2018 - 2021, USD Million
- TABLE 12 Global Colony-stimulating Factor Market by Region, 2022 - 2028, USD Million
- TABLE 13 Global Interferons Market by Region, 2018 - 2021, USD Million
- TABLE 14 Global Interferons Market by Region, 2022 - 2028, USD Million
- TABLE 15 Global Recombinant Factor VII Market by Region, 2018 - 2021, USD Million
- TABLE 16 Global Recombinant Factor VII Market by Region, 2022 - 2028, USD Million
- TABLE 17 Global Erythropoietin Market by Region, 2018 - 2021, USD Million
- TABLE 18 Global Erythropoietin Market by Region, 2022 - 2028, USD Million
- TABLE 19 Global Others Market by Region, 2018 - 2021, USD Million
- TABLE 20 Global Others Market by Region, 2022 - 2028, USD Million
- TABLE 21 Global PEGylated Proteins Market by End-user, 2018 - 2021, USD Million
- TABLE 22 Global PEGylated Proteins Market by End-user, 2022 - 2028, USD Million
- TABLE 23 Global Pharmaceutical & Biotechnology Companies Market by Region, 2018 - 2021, USD Million
- TABLE 24 Global Pharmaceutical & Biotechnology Companies Market by Region, 2022 - 2028, USD Million
- TABLE 25 Global Contract Research Organizations (CROs) Market by Region, 2018 - 2021, USD Million
- TABLE 26 Global Contract Research Organizations (CROs) Market by Region, 2022 - 2028, USD Million
- TABLE 27 Global Academic & Research Institutes Market by Region, 2018 - 2021, USD Million
- TABLE 28 Global Academic & Research Institutes Market by Region, 2022 - 2028, USD Million
- TABLE 29 Global PEGylated Proteins Market by Application, 2018 - 2021, USD Million
- TABLE 30 Global PEGylated Proteins Market by Application, 2022 - 2028, USD Million
- TABLE 31 Global Cancer Market by Region, 2018 - 2021, USD Million
- TABLE 32 Global Cancer Market by Region, 2022 - 2028, USD Million
- TABLE 33 Global Autoimmune Diseases Market by Region, 2018 - 2021, USD Million
- TABLE 34 Global Autoimmune Diseases Market by Region, 2022 - 2028, USD Million
- TABLE 35 Global Hepatitis Market by Region, 2018 - 2021, USD Million
- TABLE 36 Global Hepatitis Market by Region, 2022 - 2028, USD Million
- TABLE 37 Global Multiple Sclerosis Market by Region, 2018 - 2021, USD Million
- TABLE 38 Global Multiple Sclerosis Market by Region, 2022 - 2028, USD Million
- TABLE 39 Global Hemophilia Market by Region, 2018 - 2021, USD Million
- TABLE 40 Global Hemophilia Market by Region, 2022 - 2028, USD Million
- TABLE 41 Global Gastrointestinal Disorders Market by Region, 2018 - 2021, USD Million
- TABLE 42 Global Gastrointestinal Disorders Market by Region, 2022 - 2028, USD Million
- TABLE 43 Global Others Market by Region, 2018 - 2021, USD Million
- TABLE 44 Global Others Market by Region, 2022 - 2028, USD Million
- TABLE 45 Global PEGylated Proteins Market by Region, 2018 - 2021, USD Million
- TABLE 46 Global PEGylated Proteins Market by Region, 2022 - 2028, USD Million
- TABLE 47 North America PEGylated Proteins Market, 2018 - 2021, USD Million
- TABLE 48 North America PEGylated Proteins Market, 2022 - 2028, USD Million
- TABLE 49 North America PEGylated Proteins Market by Product & Services, 2018 - 2021, USD Million
- TABLE 50 North America PEGylated Proteins Market by Product & Services, 2022 - 2028, USD Million
- TABLE 51 North America Consumables Market by Country, 2018 - 2021, USD Million
- TABLE 52 North America Consumables Market by Country, 2022 - 2028, USD Million
- TABLE 53 North America Services Market by Country, 2018 - 2021, USD Million
- TABLE 54 North America Services Market by Country, 2022 - 2028, USD Million
- TABLE 55 North America PEGylated Proteins Market by Type, 2018 - 2021, USD Million
- TABLE 56 North America PEGylated Proteins Market by Type, 2022 - 2028, USD Million
- TABLE 57 North America Colony-stimulating Factor Market by Country, 2018 - 2021, USD Million
- TABLE 58 North America Colony-stimulating Factor Market by Country, 2022 - 2028, USD Million
- TABLE 59 North America Interferons Market by Country, 2018 - 2021, USD Million
- TABLE 60 North America Interferons Market by Country, 2022 - 2028, USD Million
- TABLE 61 North America Recombinant Factor VII Market by Country, 2018 - 2021, USD Million
- TABLE 62 North America Recombinant Factor VII Market by Country, 2022 - 2028, USD Million
- TABLE 63 North America Erythropoietin Market by Country, 2018 - 2021, USD Million
- TABLE 64 North America Erythropoietin Market by Country, 2022 - 2028, USD Million
- TABLE 65 North America Others Market by Country, 2018 - 2021, USD Million
- TABLE 66 North America Others Market by Country, 2022 - 2028, USD Million
- TABLE 67 North America PEGylated Proteins Market by End-user, 2018 - 2021, USD Million
- TABLE 68 North America PEGylated Proteins Market by End-user, 2022 - 2028, USD Million
- TABLE 69 North America Pharmaceutical & Biotechnology Companies Market by Country, 2018 - 2021, USD Million
- TABLE 70 North America Pharmaceutical & Biotechnology Companies Market by Country, 2022 - 2028, USD Million
- TABLE 71 North America Contract Research Organizations (CROs) Market by Country, 2018 - 2021, USD Million
- TABLE 72 North America Contract Research Organizations (CROs) Market by Country, 2022 - 2028, USD Million
- TABLE 73 North America Academic & Research Institutes Market by Country, 2018 - 2021, USD Million
- TABLE 74 North America Academic & Research Institutes Market by Country, 2022 - 2028, USD Million
- TABLE 75 North America PEGylated Proteins Market by Application, 2018 - 2021, USD Million
- TABLE 76 North America PEGylated Proteins Market by Application, 2022 - 2028, USD Million
- TABLE 77 North America Cancer Market by Country, 2018 - 2021, USD Million
- TABLE 78 North America Cancer Market by Country, 2022 - 2028, USD Million
- TABLE 79 North America Autoimmune Diseases Market by Country, 2018 - 2021, USD Million
- TABLE 80 North America Autoimmune Diseases Market by Country, 2022 - 2028, USD Million
- TABLE 81 North America Hepatitis Market by Country, 2018 - 2021, USD Million
- TABLE 82 North America Hepatitis Market by Country, 2022 - 2028, USD Million
- TABLE 83 North America Multiple Sclerosis Market by Country, 2018 - 2021, USD Million
- TABLE 84 North America Multiple Sclerosis Market by Country, 2022 - 2028, USD Million
- TABLE 85 North America Hemophilia Market by Country, 2018 - 2021, USD Million
- TABLE 86 North America Hemophilia Market by Country, 2022 - 2028, USD Million
- TABLE 87 North America Gastrointestinal Disorders Market by Country, 2018 - 2021, USD Million
- TABLE 88 North America Gastrointestinal Disorders Market by Country, 2022 - 2028, USD Million
- TABLE 89 North America Others Market by Country, 2018 - 2021, USD Million
- TABLE 90 North America Others Market by Country, 2022 - 2028, USD Million
- TABLE 91 North America PEGylated Proteins Market by Country, 2018 - 2021, USD Million
- TABLE 92 North America PEGylated Proteins Market by Country, 2022 - 2028, USD Million
- TABLE 93 US PEGylated Proteins Market, 2018 - 2021, USD Million
- TABLE 94 US PEGylated Proteins Market, 2022 - 2028, USD Million
- TABLE 95 US PEGylated Proteins Market by Product & Services, 2018 - 2021, USD Million
- TABLE 96 US PEGylated Proteins Market by Product & Services, 2022 - 2028, USD Million
- TABLE 97 US PEGylated Proteins Market by Type, 2018 - 2021, USD Million
- TABLE 98 US PEGylated Proteins Market by Type, 2022 - 2028, USD Million
- TABLE 99 US PEGylated Proteins Market by End-user, 2018 - 2021, USD Million
- TABLE 100 US PEGylated Proteins Market by End-user, 2022 - 2028, USD Million
- TABLE 101 US PEGylated Proteins Market by Application, 2018 - 2021, USD Million
- TABLE 102 US PEGylated Proteins Market by Application, 2022 - 2028, USD Million
- TABLE 103 Canada PEGylated Proteins Market, 2018 - 2021, USD Million
- TABLE 104 Canada PEGylated Proteins Market, 2022 - 2028, USD Million
- TABLE 105 Canada PEGylated Proteins Market by Product & Services, 2018 - 2021, USD Million
- TABLE 106 Canada PEGylated Proteins Market by Product & Services, 2022 - 2028, USD Million
- TABLE 107 Canada PEGylated Proteins Market by Type, 2018 - 2021, USD Million
- TABLE 108 Canada PEGylated Proteins Market by Type, 2022 - 2028, USD Million
- TABLE 109 Canada PEGylated Proteins Market by End-user, 2018 - 2021, USD Million
- TABLE 110 Canada PEGylated Proteins Market by End-user, 2022 - 2028, USD Million
- TABLE 111 Canada PEGylated Proteins Market by Application, 2018 - 2021, USD Million
- TABLE 112 Canada PEGylated Proteins Market by Application, 2022 - 2028, USD Million
- TABLE 113 Mexico PEGylated Proteins Market, 2018 - 2021, USD Million
- TABLE 114 Mexico PEGylated Proteins Market, 2022 - 2028, USD Million
- TABLE 115 Mexico PEGylated Proteins Market by Product & Services, 2018 - 2021, USD Million
- TABLE 116 Mexico PEGylated Proteins Market by Product & Services, 2022 - 2028, USD Million
- TABLE 117 Mexico PEGylated Proteins Market by Type, 2018 - 2021, USD Million
- TABLE 118 Mexico PEGylated Proteins Market by Type, 2022 - 2028, USD Million
- TABLE 119 Mexico PEGylated Proteins Market by End-user, 2018 - 2021, USD Million
- TABLE 120 Mexico PEGylated Proteins Market by End-user, 2022 - 2028, USD Million
- TABLE 121 Mexico PEGylated Proteins Market by Application, 2018 - 2021, USD Million
- TABLE 122 Mexico PEGylated Proteins Market by Application, 2022 - 2028, USD Million
- TABLE 123 Rest of North America PEGylated Proteins Market, 2018 - 2021, USD Million
- TABLE 124 Rest of North America PEGylated Proteins Market, 2022 - 2028, USD Million
- TABLE 125 Rest of North America PEGylated Proteins Market by Product & Services, 2018 - 2021, USD Million
- TABLE 126 Rest of North America PEGylated Proteins Market by Product & Services, 2022 - 2028, USD Million
- TABLE 127 Rest of North America PEGylated Proteins Market by Type, 2018 - 2021, USD Million
- TABLE 128 Rest of North America PEGylated Proteins Market by Type, 2022 - 2028, USD Million
- TABLE 129 Rest of North America PEGylated Proteins Market by End-user, 2018 - 2021, USD Million
- TABLE 130 Rest of North America PEGylated Proteins Market by End-user, 2022 - 2028, USD Million
- TABLE 131 Rest of North America PEGylated Proteins Market by Application, 2018 - 2021, USD Million
- TABLE 132 Rest of North America PEGylated Proteins Market by Application, 2022 - 2028, USD Million
- TABLE 133 Europe PEGylated Proteins Market, 2018 - 2021, USD Million
- TABLE 134 Europe PEGylated Proteins Market, 2022 - 2028, USD Million
- TABLE 135 Europe PEGylated Proteins Market by Product & Services, 2018 - 2021, USD Million
- TABLE 136 Europe PEGylated Proteins Market by Product & Services, 2022 - 2028, USD Million
- TABLE 137 Europe Consumables Market by Country, 2018 - 2021, USD Million
- TABLE 138 Europe Consumables Market by Country, 2022 - 2028, USD Million
- TABLE 139 Europe Services Market by Country, 2018 - 2021, USD Million
- TABLE 140 Europe Services Market by Country, 2022 - 2028, USD Million
- TABLE 141 Europe PEGylated Proteins Market by Type, 2018 - 2021, USD Million
- TABLE 142 Europe PEGylated Proteins Market by Type, 2022 - 2028, USD Million
- TABLE 143 Europe Colony-stimulating Factor Market by Country, 2018 - 2021, USD Million
- TABLE 144 Europe Colony-stimulating Factor Market by Country, 2022 - 2028, USD Million
- TABLE 145 Europe Interferons Market by Country, 2018 - 2021, USD Million
- TABLE 146 Europe Interferons Market by Country, 2022 - 2028, USD Million
- TABLE 147 Europe Recombinant Factor VII Market by Country, 2018 - 2021, USD Million
- TABLE 148 Europe Recombinant Factor VII Market by Country, 2022 - 2028, USD Million
- TABLE 149 Europe Erythropoietin Market by Country, 2018 - 2021, USD Million
- TABLE 150 Europe Erythropoietin Market by Country, 2022 - 2028, USD Million
- TABLE 151 Europe Others Market by Country, 2018 - 2021, USD Million
- TABLE 152 Europe Others Market by Country, 2022 - 2028, USD Million
- TABLE 153 Europe PEGylated Proteins Market by End-user, 2018 - 2021, USD Million
- TABLE 154 Europe PEGylated Proteins Market by End-user, 2022 - 2028, USD Million
- TABLE 155 Europe Pharmaceutical & Biotechnology Companies Market by Country, 2018 - 2021, USD Million
- TABLE 156 Europe Pharmaceutical & Biotechnology Companies Market by Country, 2022 - 2028, USD Million
- TABLE 157 Europe Contract Research Organizations (CROs) Market by Country, 2018 - 2021, USD Million
- TABLE 158 Europe Contract Research Organizations (CROs) Market by Country, 2022 - 2028, USD Million
- TABLE 159 Europe Academic & Research Institutes Market by Country, 2018 - 2021, USD Million
- TABLE 160 Europe Academic & Research Institutes Market by Country, 2022 - 2028, USD Million
- TABLE 161 Europe PEGylated Proteins Market by Application, 2018 - 2021, USD Million
- TABLE 162 Europe PEGylated Proteins Market by Application, 2022 - 2028, USD Million
- TABLE 163 Europe Cancer Market by Country, 2018 - 2021, USD Million
- TABLE 164 Europe Cancer Market by Country, 2022 - 2028, USD Million
- TABLE 165 Europe Autoimmune Diseases Market by Country, 2018 - 2021, USD Million
- TABLE 166 Europe Autoimmune Diseases Market by Country, 2022 - 2028, USD Million
- TABLE 167 Europe Hepatitis Market by Country, 2018 - 2021, USD Million
- TABLE 168 Europe Hepatitis Market by Country, 2022 - 2028, USD Million
- TABLE 169 Europe Multiple Sclerosis Market by Country, 2018 - 2021, USD Million
- TABLE 170 Europe Multiple Sclerosis Market by Country, 2022 - 2028, USD Million
- TABLE 171 Europe Hemophilia Market by Country, 2018 - 2021, USD Million
- TABLE 172 Europe Hemophilia Market by Country, 2022 - 2028, USD Million
- TABLE 173 Europe Gastrointestinal Disorders Market by Country, 2018 - 2021, USD Million
- TABLE 174 Europe Gastrointestinal Disorders Market by Country, 2022 - 2028, USD Million
- TABLE 175 Europe Others Market by Country, 2018 - 2021, USD Million
- TABLE 176 Europe Others Market by Country, 2022 - 2028, USD Million
- TABLE 177 Europe PEGylated Proteins Market by Country, 2018 - 2021, USD Million
- TABLE 178 Europe PEGylated Proteins Market by Country, 2022 - 2028, USD Million
- TABLE 179 Germany PEGylated Proteins Market, 2018 - 2021, USD Million
- TABLE 180 Germany PEGylated Proteins Market, 2022 - 2028, USD Million
- TABLE 181 Germany PEGylated Proteins Market by Product & Services, 2018 - 2021, USD Million
- TABLE 182 Germany PEGylated Proteins Market by Product & Services, 2022 - 2028, USD Million
- TABLE 183 Germany PEGylated Proteins Market by Type, 2018 - 2021, USD Million
- TABLE 184 Germany PEGylated Proteins Market by Type, 2022 - 2028, USD Million
- TABLE 185 Germany PEGylated Proteins Market by End-user, 2018 - 2021, USD Million
- TABLE 186 Germany PEGylated Proteins Market by End-user, 2022 - 2028, USD Million
- TABLE 187 Germany PEGylated Proteins Market by Application, 2018 - 2021, USD Million
- TABLE 188 Germany PEGylated Proteins Market by Application, 2022 - 2028, USD Million
- TABLE 189 UK PEGylated Proteins Market, 2018 - 2021, USD Million
- TABLE 190 UK PEGylated Proteins Market, 2022 - 2028, USD Million
- TABLE 191 UK PEGylated Proteins Market by Product & Services, 2018 - 2021, USD Million
- TABLE 192 UK PEGylated Proteins Market by Product & Services, 2022 - 2028, USD Million
- TABLE 193 UK PEGylated Proteins Market by Type, 2018 - 2021, USD Million
- TABLE 194 UK PEGylated Proteins Market by Type, 2022 - 2028, USD Million
- TABLE 195 UK PEGylated Proteins Market by End-user, 2018 - 2021, USD Million
- TABLE 196 UK PEGylated Proteins Market by End-user, 2022 - 2028, USD Million
- TABLE 197 UK PEGylated Proteins Market by Application, 2018 - 2021, USD Million
- TABLE 198 UK PEGylated Proteins Market by Application, 2022 - 2028, USD Million
- TABLE 199 France PEGylated Proteins Market, 2018 - 2021, USD Million
- TABLE 200 France PEGylated Proteins Market, 2022 - 2028, USD Million
- TABLE 201 France PEGylated Proteins Market by Product & Services, 2018 - 2021, USD Million
- TABLE 202 France PEGylated Proteins Market by Product & Services, 2022 - 2028, USD Million
- TABLE 203 France PEGylated Proteins Market by Type, 2018 - 2021, USD Million
- TABLE 204 France PEGylated Proteins Market by Type, 2022 - 2028, USD Million
- TABLE 205 France PEGylated Proteins Market by End-user, 2018 - 2021, USD Million
- TABLE 206 France PEGylated Proteins Market by End-user, 2022 - 2028, USD Million
- TABLE 207 France PEGylated Proteins Market by Application, 2018 - 2021, USD Million
- TABLE 208 France PEGylated Proteins Market by Application, 2022 - 2028, USD Million
- TABLE 209 Russia PEGylated Proteins Market, 2018 - 2021, USD Million
- TABLE 210 Russia PEGylated Proteins Market, 2022 - 2028, USD Million
- TABLE 211 Russia PEGylated Proteins Market by Product & Services, 2018 - 2021, USD Million
- TABLE 212 Russia PEGylated Proteins Market by Product & Services, 2022 - 2028, USD Million
- TABLE 213 Russia PEGylated Proteins Market by Type, 2018 - 2021, USD Million
- TABLE 214 Russia PEGylated Proteins Market by Type, 2022 - 2028, USD Million
- TABLE 215 Russia PEGylated Proteins Market by End-user, 2018 - 2021, USD Million
- TABLE 216 Russia PEGylated Proteins Market by End-user, 2022 - 2028, USD Million
- TABLE 217 Russia PEGylated Proteins Market by Application, 2018 - 2021, USD Million
- TABLE 218 Russia PEGylated Proteins Market by Application, 2022 - 2028, USD Million
- TABLE 219 Spain PEGylated Proteins Market, 2018 - 2021, USD Million
- TABLE 220 Spain PEGylated Proteins Market, 2022 - 2028, USD Million
- TABLE 221 Spain PEGylated Proteins Market by Product & Services, 2018 - 2021, USD Million
- TABLE 222 Spain PEGylated Proteins Market by Product & Services, 2022 - 2028, USD Million
- TABLE 223 Spain PEGylated Proteins Market by Type, 2018 - 2021, USD Million
- TABLE 224 Spain PEGylated Proteins Market by Type, 2022 - 2028, USD Million
- TABLE 225 Spain PEGylated Proteins Market by End-user, 2018 - 2021, USD Million
- TABLE 226 Spain PEGylated Proteins Market by End-user, 2022 - 2028, USD Million
- TABLE 227 Spain PEGylated Proteins Market by Application, 2018 - 2021, USD Million
- TABLE 228 Spain PEGylated Proteins Market by Application, 2022 - 2028, USD Million
- TABLE 229 Italy PEGylated Proteins Market, 2018 - 2021, USD Million
- TABLE 230 Italy PEGylated Proteins Market, 2022 - 2028, USD Million
- TABLE 231 Italy PEGylated Proteins Market by Product & Services, 2018 - 2021, USD Million
- TABLE 232 Italy PEGylated Proteins Market by Product & Services, 2022 - 2028, USD Million
- TABLE 233 Italy PEGylated Proteins Market by Type, 2018 - 2021, USD Million
- TABLE 234 Italy PEGylated Proteins Market by Type, 2022 - 2028, USD Million
- TABLE 235 Italy PEGylated Proteins Market by End-user, 2018 - 2021, USD Million
- TABLE 236 Italy PEGylated Proteins Market by End-user, 2022 - 2028, USD Million
- TABLE 237 Italy PEGylated Proteins Market by Application, 2018 - 2021, USD Million
- TABLE 238 Italy PEGylated Proteins Market by Application, 2022 - 2028, USD Million
- TABLE 239 Rest of Europe PEGylated Proteins Market, 2018 - 2021, USD Million
- TABLE 240 Rest of Europe PEGylated Proteins Market, 2022 - 2028, USD Million
- TABLE 241 Rest of Europe PEGylated Proteins Market by Product & Services, 2018 - 2021, USD Million
- TABLE 242 Rest of Europe PEGylated Proteins Market by Product & Services, 2022 - 2028, USD Million
- TABLE 243 Rest of Europe PEGylated Proteins Market by Type, 2018 - 2021, USD Million
- TABLE 244 Rest of Europe PEGylated Proteins Market by Type, 2022 - 2028, USD Million
- TABLE 245 Rest of Europe PEGylated Proteins Market by End-user, 2018 - 2021, USD Million
- TABLE 246 Rest of Europe PEGylated Proteins Market by End-user, 2022 - 2028, USD Million
- TABLE 247 Rest of Europe PEGylated Proteins Market by Application, 2018 - 2021, USD Million
- TABLE 248 Rest of Europe PEGylated Proteins Market by Application, 2022 - 2028, USD Million
- TABLE 249 Asia Pacific PEGylated Proteins Market, 2018 - 2021, USD Million
- TABLE 250 Asia Pacific PEGylated Proteins Market, 2022 - 2028, USD Million
- TABLE 251 Asia Pacific PEGylated Proteins Market by Product & Services, 2018 - 2021, USD Million
- TABLE 252 Asia Pacific PEGylated Proteins Market by Product & Services, 2022 - 2028, USD Million
- TABLE 253 Asia Pacific Consumables Market by Country, 2018 - 2021, USD Million
- TABLE 254 Asia Pacific Consumables Market by Country, 2022 - 2028, USD Million
- TABLE 255 Asia Pacific Services Market by Country, 2018 - 2021, USD Million
- TABLE 256 Asia Pacific Services Market by Country, 2022 - 2028, USD Million
- TABLE 257 Asia Pacific PEGylated Proteins Market by Type, 2018 - 2021, USD Million
- TABLE 258 Asia Pacific PEGylated Proteins Market by Type, 2022 - 2028, USD Million
- TABLE 259 Asia Pacific Colony-stimulating Factor Market by Country, 2018 - 2021, USD Million
- TABLE 260 Asia Pacific Colony-stimulating Factor Market by Country, 2022 - 2028, USD Million
- TABLE 261 Asia Pacific Interferons Market by Country, 2018 - 2021, USD Million
- TABLE 262 Asia Pacific Interferons Market by Country, 2022 - 2028, USD Million
- TABLE 263 Asia Pacific Recombinant Factor VII Market by Country, 2018 - 2021, USD Million
- TABLE 264 Asia Pacific Recombinant Factor VII Market by Country, 2022 - 2028, USD Million
- TABLE 265 Asia Pacific Erythropoietin Market by Country, 2018 - 2021, USD Million
- TABLE 266 Asia Pacific Erythropoietin Market by Country, 2022 - 2028, USD Million
- TABLE 267 Asia Pacific Others Market by Country, 2018 - 2021, USD Million
- TABLE 268 Asia Pacific Others Market by Country, 2022 - 2028, USD Million
- TABLE 269 Asia Pacific PEGylated Proteins Market by End-user, 2018 - 2021, USD Million
- TABLE 270 Asia Pacific PEGylated Proteins Market by End-user, 2022 - 2028, USD Million
- TABLE 271 Asia Pacific Pharmaceutical & Biotechnology Companies Market by Country, 2018 - 2021, USD Million
- TABLE 272 Asia Pacific Pharmaceutical & Biotechnology Companies Market by Country, 2022 - 2028, USD Million
- TABLE 273 Asia Pacific Contract Research Organizations (CROs) Market by Country, 2018 - 2021, USD Million
- TABLE 274 Asia Pacific Contract Research Organizations (CROs) Market by Country, 2022 - 2028, USD Million
- TABLE 275 Asia Pacific Academic & Research Institutes Market by Country, 2018 - 2021, USD Million
- TABLE 276 Asia Pacific Academic & Research Institutes Market by Country, 2022 - 2028, USD Million
- TABLE 277 Asia Pacific PEGylated Proteins Market by Application, 2018 - 2021, USD Million
- TABLE 278 Asia Pacific PEGylated Proteins Market by Application, 2022 - 2028, USD Million
- TABLE 279 Asia Pacific Cancer Market by Country, 2018 - 2021, USD Million
- TABLE 280 Asia Pacific Cancer Market by Country, 2022 - 2028, USD Million
- TABLE 281 Asia Pacific Autoimmune Diseases Market by Country, 2018 - 2021, USD Million
- TABLE 282 Asia Pacific Autoimmune Diseases Market by Country, 2022 - 2028, USD Million
- TABLE 283 Asia Pacific Hepatitis Market by Country, 2018 - 2021, USD Million
- TABLE 284 Asia Pacific Hepatitis Market by Country, 2022 - 2028, USD Million
- TABLE 285 Asia Pacific Multiple Sclerosis Market by Country, 2018 - 2021, USD Million
- TABLE 286 Asia Pacific Multiple Sclerosis Market by Country, 2022 - 2028, USD Million
- TABLE 287 Asia Pacific Hemophilia Market by Country, 2018 - 2021, USD Million
- TABLE 288 Asia Pacific Hemophilia Market by Country, 2022 - 2028, USD Million
- TABLE 289 Asia Pacific Gastrointestinal Disorders Market by Country, 2018 - 2021, USD Million
- TABLE 290 Asia Pacific Gastrointestinal Disorders Market by Country, 2022 - 2028, USD Million
- TABLE 291 Asia Pacific Others Market by Country, 2018 - 2021, USD Million
- TABLE 292 Asia Pacific Others Market by Country, 2022 - 2028, USD Million
- TABLE 293 Asia Pacific PEGylated Proteins Market by Country, 2018 - 2021, USD Million
- TABLE 294 Asia Pacific PEGylated Proteins Market by Country, 2022 - 2028, USD Million
- TABLE 295 China PEGylated Proteins Market, 2018 - 2021, USD Million
- TABLE 296 China PEGylated Proteins Market, 2022 - 2028, USD Million
- TABLE 297 China PEGylated Proteins Market by Product & Services, 2018 - 2021, USD Million
- TABLE 298 China PEGylated Proteins Market by Product & Services, 2022 - 2028, USD Million
- TABLE 299 China PEGylated Proteins Market by Type, 2018 - 2021, USD Million
- TABLE 300 China PEGylated Proteins Market by Type, 2022 - 2028, USD Million
- TABLE 301 China PEGylated Proteins Market by End-user, 2018 - 2021, USD Million
- TABLE 302 China PEGylated Proteins Market by End-user, 2022 - 2028, USD Million
- TABLE 303 China PEGylated Proteins Market by Application, 2018 - 2021, USD Million
- TABLE 304 China PEGylated Proteins Market by Application, 2022 - 2028, USD Million
- TABLE 305 Japan PEGylated Proteins Market, 2018 - 2021, USD Million
- TABLE 306 Japan PEGylated Proteins Market, 2022 - 2028, USD Million
- TABLE 307 Japan PEGylated Proteins Market by Product & Services, 2018 - 2021, USD Million
- TABLE 308 Japan PEGylated Proteins Market by Product & Services, 2022 - 2028, USD Million
- TABLE 309 Japan PEGylated Proteins Market by Type, 2018 - 2021, USD Million
- TABLE 310 Japan PEGylated Proteins Market by Type, 2022 - 2028, USD Million
- TABLE 311 Japan PEGylated Proteins Market by End-user, 2018 - 2021, USD Million
- TABLE 312 Japan PEGylated Proteins Market by End-user, 2022 - 2028, USD Million
- TABLE 313 Japan PEGylated Proteins Market by Application, 2018 - 2021, USD Million
- TABLE 314 Japan PEGylated Proteins Market by Application, 2022 - 2028, USD Million
- TABLE 315 India PEGylated Proteins Market, 2018 - 2021, USD Million
- TABLE 316 India PEGylated Proteins Market, 2022 - 2028, USD Million
- TABLE 317 India PEGylated Proteins Market by Product & Services, 2018 - 2021, USD Million
- TABLE 318 India PEGylated Proteins Market by Product & Services, 2022 - 2028, USD Million
- TABLE 319 India PEGylated Proteins Market by Type, 2018 - 2021, USD Million
- TABLE 320 India PEGylated Proteins Market by Type, 2022 - 2028, USD Million
- TABLE 321 India PEGylated Proteins Market by End-user, 2018 - 2021, USD Million
- TABLE 322 India PEGylated Proteins Market by End-user, 2022 - 2028, USD Million
- TABLE 323 India PEGylated Proteins Market by Application, 2018 - 2021, USD Million
- TABLE 324 India PEGylated Proteins Market by Application, 2022 - 2028, USD Million
- TABLE 325 South Korea PEGylated Proteins Market, 2018 - 2021, USD Million
- TABLE 326 South Korea PEGylated Proteins Market, 2022 - 2028, USD Million
- TABLE 327 South Korea PEGylated Proteins Market by Product & Services, 2018 - 2021, USD Million
- TABLE 328 South Korea PEGylated Proteins Market by Product & Services, 2022 - 2028, USD Million
- TABLE 329 South Korea PEGylated Proteins Market by Type, 2018 - 2021, USD Million
- TABLE 330 South Korea PEGylated Proteins Market by Type, 2022 - 2028, USD Million
- TABLE 331 South Korea PEGylated Proteins Market by End-user, 2018 - 2021, USD Million
- TABLE 332 South Korea PEGylated Proteins Market by End-user, 2022 - 2028, USD Million
- TABLE 333 South Korea PEGylated Proteins Market by Application, 2018 - 2021, USD Million
- TABLE 334 South Korea PEGylated Proteins Market by Application, 2022 - 2028, USD Million
- TABLE 335 Singapore PEGylated Proteins Market, 2018 - 2021, USD Million
- TABLE 336 Singapore PEGylated Proteins Market, 2022 - 2028, USD Million
- TABLE 337 Singapore PEGylated Proteins Market by Product & Services, 2018 - 2021, USD Million
- TABLE 338 Singapore PEGylated Proteins Market by Product & Services, 2022 - 2028, USD Million
- TABLE 339 Singapore PEGylated Proteins Market by Type, 2018 - 2021, USD Million
- TABLE 340 Singapore PEGylated Proteins Market by Type, 2022 - 2028, USD Million
- TABLE 341 Singapore PEGylated Proteins Market by End-user, 2018 - 2021, USD Million
- TABLE 342 Singapore PEGylated Proteins Market by End-user, 2022 - 2028, USD Million
- TABLE 343 Singapore PEGylated Proteins Market by Application, 2018 - 2021, USD Million
- TABLE 344 Singapore PEGylated Proteins Market by Application, 2022 - 2028, USD Million
- TABLE 345 Malaysia PEGylated Proteins Market, 2018 - 2021, USD Million
- TABLE 346 Malaysia PEGylated Proteins Market, 2022 - 2028, USD Million
- TABLE 347 Malaysia PEGylated Proteins Market by Product & Services, 2018 - 2021, USD Million
- TABLE 348 Malaysia PEGylated Proteins Market by Product & Services, 2022 - 2028, USD Million
- TABLE 349 Malaysia PEGylated Proteins Market by Type, 2018 - 2021, USD Million
- TABLE 350 Malaysia PEGylated Proteins Market by Type, 2022 - 2028, USD Million
- TABLE 351 Malaysia PEGylated Proteins Market by End-user, 2018 - 2021, USD Million
- TABLE 352 Malaysia PEGylated Proteins Market by End-user, 2022 - 2028, USD Million
- TABLE 353 Malaysia PEGylated Proteins Market by Application, 2018 - 2021, USD Million
- TABLE 354 Malaysia PEGylated Proteins Market by Application, 2022 - 2028, USD Million
- TABLE 355 Rest of Asia Pacific PEGylated Proteins Market, 2018 - 2021, USD Million
- TABLE 356 Rest of Asia Pacific PEGylated Proteins Market, 2022 - 2028, USD Million
- TABLE 357 Rest of Asia Pacific PEGylated Proteins Market by Product & Services, 2018 - 2021, USD Million
- TABLE 358 Rest of Asia Pacific PEGylated Proteins Market by Product & Services, 2022 - 2028, USD Million
- TABLE 359 Rest of Asia Pacific PEGylated Proteins Market by Type, 2018 - 2021, USD Million
- TABLE 360 Rest of Asia Pacific PEGylated Proteins Market by Type, 2022 - 2028, USD Million
- TABLE 361 Rest of Asia Pacific PEGylated Proteins Market by End-user, 2018 - 2021, USD Million
- TABLE 362 Rest of Asia Pacific PEGylated Proteins Market by End-user, 2022 - 2028, USD Million
- TABLE 363 Rest of Asia Pacific PEGylated Proteins Market by Application, 2018 - 2021, USD Million
- TABLE 364 Rest of Asia Pacific PEGylated Proteins Market by Application, 2022 - 2028, USD Million
- TABLE 365 LAMEA PEGylated Proteins Market, 2018 - 2021, USD Million
- TABLE 366 LAMEA PEGylated Proteins Market, 2022 - 2028, USD Million
- TABLE 367 LAMEA PEGylated Proteins Market by Product & Services, 2018 - 2021, USD Million
- TABLE 368 LAMEA PEGylated Proteins Market by Product & Services, 2022 - 2028, USD Million
- TABLE 369 LAMEA Consumables Market by Country, 2018 - 2021, USD Million
- TABLE 370 LAMEA Consumables Market by Country, 2022 - 2028, USD Million
- TABLE 371 LAMEA Services Market by Country, 2018 - 2021, USD Million
- TABLE 372 LAMEA Services Market by Country, 2022 - 2028, USD Million
- TABLE 373 LAMEA PEGylated Proteins Market by Type, 2018 - 2021, USD Million
- TABLE 374 LAMEA PEGylated Proteins Market by Type, 2022 - 2028, USD Million
- TABLE 375 LAMEA Colony-stimulating Factor Market by Country, 2018 - 2021, USD Million
- TABLE 376 LAMEA Colony-stimulating Factor Market by Country, 2022 - 2028, USD Million
- TABLE 377 LAMEA Interferons Market by Country, 2018 - 2021, USD Million
- TABLE 378 LAMEA Interferons Market by Country, 2022 - 2028, USD Million
- TABLE 379 LAMEA Recombinant Factor VII Market by Country, 2018 - 2021, USD Million
- TABLE 380 LAMEA Recombinant Factor VII Market by Country, 2022 - 2028, USD Million
- TABLE 381 LAMEA Erythropoietin Market by Country, 2018 - 2021, USD Million
- TABLE 382 LAMEA Erythropoietin Market by Country, 2022 - 2028, USD Million
- TABLE 383 LAMEA Others Market by Country, 2018 - 2021, USD Million
- TABLE 384 LAMEA Others Market by Country, 2022 - 2028, USD Million
- TABLE 385 LAMEA PEGylated Proteins Market by End-user, 2018 - 2021, USD Million
- TABLE 386 LAMEA PEGylated Proteins Market by End-user, 2022 - 2028, USD Million
- TABLE 387 LAMEA Pharmaceutical & Biotechnology Companies Market by Country, 2018 - 2021, USD Million
- TABLE 388 LAMEA Pharmaceutical & Biotechnology Companies Market by Country, 2022 - 2028, USD Million
- TABLE 389 LAMEA Contract Research Organizations (CROs) Market by Country, 2018 - 2021, USD Million
- TABLE 390 LAMEA Contract Research Organizations (CROs) Market by Country, 2022 - 2028, USD Million
- TABLE 391 LAMEA Academic & Research Institutes Market by Country, 2018 - 2021, USD Million
- TABLE 392 LAMEA Academic & Research Institutes Market by Country, 2022 - 2028, USD Million
- TABLE 393 LAMEA PEGylated Proteins Market by Application, 2018 - 2021, USD Million
- TABLE 394 LAMEA PEGylated Proteins Market by Application, 2022 - 2028, USD Million
- TABLE 395 LAMEA Cancer Market by Country, 2018 - 2021, USD Million
- TABLE 396 LAMEA Cancer Market by Country, 2022 - 2028, USD Million
- TABLE 397 LAMEA Autoimmune Diseases Market by Country, 2018 - 2021, USD Million
- TABLE 398 LAMEA Autoimmune Diseases Market by Country, 2022 - 2028, USD Million
- TABLE 399 LAMEA Hepatitis Market by Country, 2018 - 2021, USD Million
- TABLE 400 LAMEA Hepatitis Market by Country, 2022 - 2028, USD Million
- TABLE 401 LAMEA Multiple Sclerosis Market by Country, 2018 - 2021, USD Million
- TABLE 402 LAMEA Multiple Sclerosis Market by Country, 2022 - 2028, USD Million
- TABLE 403 LAMEA Hemophilia Market by Country, 2018 - 2021, USD Million
- TABLE 404 LAMEA Hemophilia Market by Country, 2022 - 2028, USD Million
- TABLE 405 LAMEA Gastrointestinal Disorders Market by Country, 2018 - 2021, USD Million
- TABLE 406 LAMEA Gastrointestinal Disorders Market by Country, 2022 - 2028, USD Million
- TABLE 407 LAMEA Others Market by Country, 2018 - 2021, USD Million
- TABLE 408 LAMEA Others Market by Country, 2022 - 2028, USD Million
- TABLE 409 LAMEA PEGylated Proteins Market by Country, 2018 - 2021, USD Million
- TABLE 410 LAMEA PEGylated Proteins Market by Country, 2022 - 2028, USD Million
- TABLE 411 Brazil PEGylated Proteins Market, 2018 - 2021, USD Million
- TABLE 412 Brazil PEGylated Proteins Market, 2022 - 2028, USD Million
- TABLE 413 Brazil PEGylated Proteins Market by Product & Services, 2018 - 2021, USD Million
- TABLE 414 Brazil PEGylated Proteins Market by Product & Services, 2022 - 2028, USD Million
- TABLE 415 Brazil PEGylated Proteins Market by Type, 2018 - 2021, USD Million
- TABLE 416 Brazil PEGylated Proteins Market by Type, 2022 - 2028, USD Million
- TABLE 417 Brazil PEGylated Proteins Market by End-user, 2018 - 2021, USD Million
- TABLE 418 Brazil PEGylated Proteins Market by End-user, 2022 - 2028, USD Million
- TABLE 419 Brazil PEGylated Proteins Market by Application, 2018 - 2021, USD Million
- TABLE 420 Brazil PEGylated Proteins Market by Application, 2022 - 2028, USD Million
- TABLE 421 Argentina PEGylated Proteins Market, 2018 - 2021, USD Million
- TABLE 422 Argentina PEGylated Proteins Market, 2022 - 2028, USD Million
- TABLE 423 Argentina PEGylated Proteins Market by Product & Services, 2018 - 2021, USD Million
- TABLE 424 Argentina PEGylated Proteins Market by Product & Services, 2022 - 2028, USD Million
- TABLE 425 Argentina PEGylated Proteins Market by Type, 2018 - 2021, USD Million
- TABLE 426 Argentina PEGylated Proteins Market by Type, 2022 - 2028, USD Million
- TABLE 427 Argentina PEGylated Proteins Market by End-user, 2018 - 2021, USD Million
- TABLE 428 Argentina PEGylated Proteins Market by End-user, 2022 - 2028, USD Million
- TABLE 429 Argentina PEGylated Proteins Market by Application, 2018 - 2021, USD Million
- TABLE 430 Argentina PEGylated Proteins Market by Application, 2022 - 2028, USD Million
- TABLE 431 UAE PEGylated Proteins Market, 2018 - 2021, USD Million
- TABLE 432 UAE PEGylated Proteins Market, 2022 - 2028, USD Million
- TABLE 433 UAE PEGylated Proteins Market by Product & Services, 2018 - 2021, USD Million
- TABLE 434 UAE PEGylated Proteins Market by Product & Services, 2022 - 2028, USD Million
- TABLE 435 UAE PEGylated Proteins Market by Type, 2018 - 2021, USD Million
- TABLE 436 UAE PEGylated Proteins Market by Type, 2022 - 2028, USD Million
- TABLE 437 UAE PEGylated Proteins Market by End-user, 2018 - 2021, USD Million
- TABLE 438 UAE PEGylated Proteins Market by End-user, 2022 - 2028, USD Million
- TABLE 439 UAE PEGylated Proteins Market by Application, 2018 - 2021, USD Million
- TABLE 440 UAE PEGylated Proteins Market by Application, 2022 - 2028, USD Million
- TABLE 441 Saudi Arabia PEGylated Proteins Market, 2018 - 2021, USD Million
- TABLE 442 Saudi Arabia PEGylated Proteins Market, 2022 - 2028, USD Million
- TABLE 443 Saudi Arabia PEGylated Proteins Market by Product & Services, 2018 - 2021, USD Million
- TABLE 444 Saudi Arabia PEGylated Proteins Market by Product & Services, 2022 - 2028, USD Million
- TABLE 445 Saudi Arabia PEGylated Proteins Market by Type, 2018 - 2021, USD Million
- TABLE 446 Saudi Arabia PEGylated Proteins Market by Type, 2022 - 2028, USD Million
- TABLE 447 Saudi Arabia PEGylated Proteins Market by End-user, 2018 - 2021, USD Million
- TABLE 448 Saudi Arabia PEGylated Proteins Market by End-user, 2022 - 2028, USD Million
- TABLE 449 Saudi Arabia PEGylated Proteins Market by Application, 2018 - 2021, USD Million
- TABLE 450 Saudi Arabia PEGylated Proteins Market by Application, 2022 - 2028, USD Million
- TABLE 451 South Africa PEGylated Proteins Market, 2018 - 2021, USD Million
- TABLE 452 South Africa PEGylated Proteins Market, 2022 - 2028, USD Million
- TABLE 453 South Africa PEGylated Proteins Market by Product & Services, 2018 - 2021, USD Million
- TABLE 454 South Africa PEGylated Proteins Market by Product & Services, 2022 - 2028, USD Million
- TABLE 455 South Africa PEGylated Proteins Market by Type, 2018 - 2021, USD Million
- TABLE 456 South Africa PEGylated Proteins Market by Type, 2022 - 2028, USD Million
- TABLE 457 South Africa PEGylated Proteins Market by End-user, 2018 - 2021, USD Million
- TABLE 458 South Africa PEGylated Proteins Market by End-user, 2022 - 2028, USD Million
- TABLE 459 South Africa PEGylated Proteins Market by Application, 2018 - 2021, USD Million
- TABLE 460 South Africa PEGylated Proteins Market by Application, 2022 - 2028, USD Million
- TABLE 461 Nigeria PEGylated Proteins Market, 2018 - 2021, USD Million
- TABLE 462 Nigeria PEGylated Proteins Market, 2022 - 2028, USD Million
- TABLE 463 Nigeria PEGylated Proteins Market by Product & Services, 2018 - 2021, USD Million
- TABLE 464 Nigeria PEGylated Proteins Market by Product & Services, 2022 - 2028, USD Million
- TABLE 465 Nigeria PEGylated Proteins Market by Type, 2018 - 2021, USD Million
- TABLE 466 Nigeria PEGylated Proteins Market by Type, 2022 - 2028, USD Million
- TABLE 467 Nigeria PEGylated Proteins Market by End-user, 2018 - 2021, USD Million
- TABLE 468 Nigeria PEGylated Proteins Market by End-user, 2022 - 2028, USD Million
- TABLE 469 Nigeria PEGylated Proteins Market by Application, 2018 - 2021, USD Million
- TABLE 470 Nigeria PEGylated Proteins Market by Application, 2022 - 2028, USD Million
- TABLE 471 Rest of LAMEA PEGylated Proteins Market, 2018 - 2021, USD Million
- TABLE 472 Rest of LAMEA PEGylated Proteins Market, 2022 - 2028, USD Million
- TABLE 473 Rest of LAMEA PEGylated Proteins Market by Product & Services, 2018 - 2021, USD Million
- TABLE 474 Rest of LAMEA PEGylated Proteins Market by Product & Services, 2022 - 2028, USD Million
- TABLE 475 Rest of LAMEA PEGylated Proteins Market by Type, 2018 - 2021, USD Million
- TABLE 476 Rest of LAMEA PEGylated Proteins Market by Type, 2022 - 2028, USD Million
- TABLE 477 Rest of LAMEA PEGylated Proteins Market by End-user, 2018 - 2021, USD Million
- TABLE 478 Rest of LAMEA PEGylated Proteins Market by End-user, 2022 - 2028, USD Million
- TABLE 479 Rest of LAMEA PEGylated Proteins Market by Application, 2018 - 2021, USD Million
- TABLE 480 Rest of LAMEA PEGylated Proteins Market by Application, 2022 - 2028, USD Million
- TABLE 481 Key Information - Thermo Fisher Scientific, Inc.
- TABLE 482 Key Information - Merck Millipore
- TABLE 483 Key Information - nof corporation
- TABLE 484 Key Information - Beijing Jiankai Technology Co., Ltd.
- TABLE 485 Key Information - Creative PEGworks
- TABLE 486 Key Information - Celares gmbh
- TABLE 487 Key Information -Quanta biodesign ltd.
- TABLE 488 Key Information - biomatrik, inc.
- TABLE 489 Key Information - Iris biotech gmbh
- TABLE 490 Key Information - laysan bio, inc.
List of Figures
- FIG 1 Methodology for the research
- FIG 2 Global PEGylated Proteins Market Share by Product & Services, 2021
- FIG 3 Global PEGylated Proteins Market Share by Product & Services, 2028
- FIG 4 Global PEGylated Proteins Market by Product & Services, 2018 - 2028, USD Million
- FIG 5 Global PEGylated Proteins Market Share by Type, 2021
- FIG 6 Global PEGylated Proteins Market Share by Type, 2028
- FIG 7 Global PEGylated Proteins Market by Type, 2018 - 2028, USD Million
- FIG 8 Global PEGylated Proteins Market Share by End-user, 2021
- FIG 9 Global PEGylated Proteins Market Share by End-user, 2028
- FIG 10 Global PEGylated Proteins Market by End-user, 2018 - 2028, USD Million
- FIG 11 Global PEGylated Proteins Market Share by Application, 2021
- FIG 12 Global PEGylated Proteins Market Share by Application, 2028
- FIG 13 Global PEGylated Proteins Market by Application, 2018 - 2028, USD Million
- FIG 14 Global PEGylated Proteins Market Share by Region, 2021
- FIG 15 Global PEGylated Proteins Market Share by Region, 2028
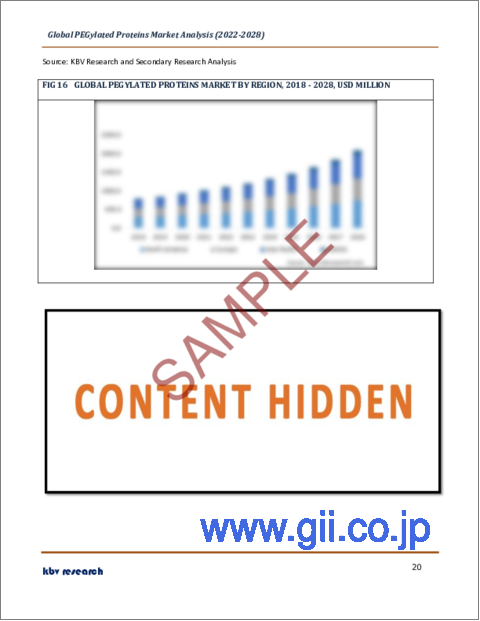
- FIG 16 Global PEGylated Proteins Market by Region, 2018 - 2028, USD Million
- FIG 17 Recent strategies and developments: Thermo Fisher Scientific, Inc.
The Global PEGylated Proteins Market size is expected to reach $2.1 billion by 2028, rising at a market growth of 11.3% CAGR during the forecast period.
PEGylation is covalently and non-covalently connecting polyethylene glycol polymer chains to molecules, such as treatments, medications, or vesicles. The industry is expected to expand significantly throughout the anticipated time period, mainly due to increased PEGylation demand, a rise in the occurrence of chronic diseases, and the availability of effective new therapeutic options.
PEGylated chemicals also have certain extra advantages that support the growth of the sector, such as improved proteolytic defense, a longer half-life, decreased toxicity, and reduced immunogenicity. Because of their great biological activity and excellent selectivity, protein medicines have emerged as significant modern pharmacological products.
In combination with protein inactive necessary groups, polyethylene glycol (PEG), a type of non-toxic, high hydrophilic macromolecule polymer, increases the relative molecular mass of the protein drugs, causing some changes to the antigenic determinant that is covered on the surface of the charged property. Both domestically and internationally, there has been noticeable interest in the utilization of PEGylated technology in protein medicines.
A wide range of PEGylated medications on the market has completely established both their therapeutic and commercial usefulness. The preference for protein-based pharmaceuticals over non-protein-based drugs is increasing, and PEGylation's enhancement of protein stability and circulation half-life is anticipated to drive the PEGylated Protein Industry's expansion throughout the projection period.
The key driver of the industry's growth is the increasing prevalence of chronic conditions like cancer, kidney illness, and rheumatoid arthritis. For instance, according to estimations from the IARC (International Agency for Research on Cancer), there will be 19.3 million new cases of cancer and 10.3 million cancer deaths globally in 2020.
COVID-19 Impact Analysis
The COVID-19 pandemic was beneficial to the sector. The government and major players increased their investments in the creation of cutting-edge medication candidates for COVID-19 prevention. Increased research and development for new vaccines, diagnostics, and the repurposing of current medicines were closely linked to an increase in investments. For instance, Zydus Cadila, an Indian pharmaceutical company, acquired an Emergency Use Approval (EUA) in April 2021 to use its PEGylated Interferon alpha 2b existing medication to treat COVID-19 patients with mild instances. The medicine had previously been approved to treat Hepatitis B, but after extensive study and clinical trials across India, it was repurposed for COVID-19.
Market Growth Factors
Pegylated proteins are being used more often and in a variety of applications.
The development of more stable and non-immunogenic medicines is made possible by major improvements in PEGylated protein processes, which are predicted to accelerate the growth of the worldwide PEGylated protein market. Given the huge increase in cancer patients, the approach has strong applicability in the treatment of cancer. World Health Organization (WHO) estimates that 9.6 million individuals worldwide lost their lives to cancer in 2018. After being PEGylated, the protein from the CCN family can be employed in the treatment of blood cancer.
The Rising Rate Of Cancer Worldwide
The second-leading cause of death, cancer, is responsible for a significant fraction of all fatalities. Wealthy countries have a substantially higher cancer rate than developing ones. It is anticipated that recognized risk factors will be increasingly prominent in these developing nations due to population growth, aging, and a rise in known risk factors. Lung cancer is among the major cause of cancer-related death in men only in industrialized countries, while breast cancer is the major cause of cancer deaths in developing countries.
Market Restraining Factors
Isolation And Purification Challenges
Protein PEGylation is a complicated process that can be carried out in different ways, depending on the protein's makeup and the intended use. Inert PEG strings are covalently or non-covalently complexed with proteins of interest. Another crucial step is the purification of the PEGylated protein, which is mostly accomplished through chromatography and electrostatic interactions or molecular sizes. For conditions such as anemia, kidney illness, multiple sclerosis, hemophilia, and malignancies, a number of PEGylated medications are in use.
Product and Services Outlook
Based on the Product and Services, the market is divided into Consumables and Services. The market's substantial revenue share is displayed by the services sector. PEGylated Proteins services are available in both linear and branching formats and can be used with PEGs of various molecular weights. Peptides and proteins frequently have limitations on their capacity to be used therapeutically due to their chemical instability, quick blood circulation, and propensity to trigger an immune response.
Type Outlook
Based on the type, the market is divided into Colony-stimulating factors, Interferons, Erythropoietin, Recombinant factor VII, and Others. Erythropoietin is demonstrating the market's optimistic growth pace. The expansion of erythropoietin drugs is being driven by an increase in the prevalence of chronic diseases such as end-stage renal diseases, cancer, HIV, and neurological disorders. Drugs that mimic erythropoietin (EPO) can be used to treat severe anemia in people with cancer, HIV, and renal disease.
Application Outlook
Based on Application, the market is divided into Cancer, Autoimmune diseases, Hepatitis, Multiple sclerosis, Hemophilia, Gastrointestinal disorders, and Others. The market is showing a promising growth rate for the other segments. Protein drug delivery and other disorders are included in the others section. The market for PEGylated Proteins is anticipated to grow as a result of the rising frequency of chronic disorders. PEGylated proteins improve a drug's action relative to a standard drug by increasing the stability of the substance in the body.
End-User Outlook
Based on the end-user, the market is divided into Pharmaceutical and biotechnology businesses, Contract research organizations, and Academic & research institutes. The significant revenue share in the industry was accounted for by Contract Research Organizations (CROs). CROs are currently more prevalent as a result of the rising demand for outside help with contract research and the creation of pharmaceuticals. Additionally, due to the hassle-free process and FDA clearance, the biotechnology and pharmaceutical industries now rely on CROs for support.
Regional Outlook
Based on geography, the market is categorized into North America, Europe, Asia Pacific, and LAMEA. In 2021, North America led the market and held the largest share. The region's healthcare infrastructure has grown as a result of the incidence of ailments and diseases, chronic conditions, and population awareness of modern therapies. The increase in funding and grants for biologics-based research activities is facilitated by the presence of improved infrastructure and better economic conditions.
The market research report covers the analysis of key stake holders of the market. Key companies profiled in the report include Merck Millipore (Merck KGaA), Thermo Fisher Scientific, Inc., NOF Corporation, JenKem Technology Co. Ltd., Creative PEGworks, Celares GmbH, Quanta BioDesign, Ltd., Biomatrik, Inc., Iris Biotech GmbH, and Laysan Bio, Inc.
Strategies Deployed in PEGylated Proteins Market
Nov-2022: Thermo Fisher Scientific completed the acquisition of The Binding Site Group, a UK-based specialist protein company providing diagnostic products and instruments to clinicians and laboratories globally. This acquisition broadened Thermo's existing specialty diagnostics portfolio.
Aug-2022: Merck Group, the parent organization of Merck Millipore took over the Chemical division of Mecaro, a company focused on manufacturing heater blocks and chemical precursors for semiconductors. This acquisition enhances Merck's portfolio of semiconductor solutions.
Apr-2022: Thermo Fisher Scientific launched GMP-manufactured Gibco CTS TrueCut Cas9 protein. The product enhances Thermo's existing genome editing solutions and provides support to scientists developing personalized CAR T-cell therapeutics.
Mar-2022: Thermo Fisher took over Max Analytical, a chemical instrumentation company providing FTIR-based gas analytical solutions. The acquisition broadened Thermo's FTIR instrument, software, and service offerings.
Jan-2022: Thermo Fisher Scientific announced the acquisition of PeproTech, a provider of bioscience reagents. The acquisition complemented Thermo's bioscience business and enabled them to deliver better services to its pharma and biotech customers.
Dec-2021: Thermo Fisher acquired PPD, a pharmaceutical firm offering clinical research and laboratory services. The addition of PPD's clinical research services enables Thermo to advance its work in launching life-changing therapies to market.
Oct-2021: Thermo Fisher Scientific collaborated with 3M Health Car for maximizing process scalability and efficiency in commercial therapeutic manufacturing. The collaboration integrates Thermo's HyPerforma Single-Use Bioreactor Systems and 3M's Harvest RC providing premium solutions to advance manufacturing capacity to produce therapeutics.
Jan-2021: Thermo Fisher completed the acquisition of Mesa Biotech, a healthcare test and data company providing the molecular diagnostic test. This acquisition complemented Thermo's existing test services and helped Thermo cater to the increasing demand for COVID-related testing.
Scope of the Study
Market Segments covered in the Report:
By Product & Services
- Consumables
- Services
By Type
- Colony-stimulating Factor
- Interferons
- Recombinant Factor VII
- Erythropoietin
- Others
By End-user
- Pharmaceutical & Biotechnology Companies
- Contract Research Organizations (CROs)
- Academic & Research Institutes
By Application
- Cancer
- Autoimmune Diseases
- Hepatitis
- Multiple Sclerosis
- Hemophilia
- Gastrointestinal Disorders
- Others
By Geography
- North America
- US
- Canada
- Mexico
- Rest of North America
- Europe
- Germany
- UK
- France
- Russia
- Spain
- Italy
- Rest of Europe
- Asia Pacific
- China
- Japan
- India
- South Korea
- Singapore
- Malaysia
- Rest of Asia Pacific
- LAMEA
- Brazil
- Argentina
- UAE
- Saudi Arabia
- South Africa
- Nigeria
- Rest of LAMEA
Companies Profiled
- Merck Millipore (Merck KGaA)
- Thermo Fisher Scientific, Inc.
- NOF Corporation
- JenKem Technology Co. Ltd.
- Creative PEGworks
- Celares GmbH
- Quanta BioDesign, Ltd.
- Biomatrik, Inc.
- Iris Biotech GmbH
- Laysan Bio, Inc.
Unique Offerings from KBV Research
- Exhaustive coverage
- Highest number of market tables and figures
- Subscription based model available
- Guaranteed best price
- Assured post sales research support with 10% customization free
Table of Contents
Chapter 1. Market Scope & Methodology
- 1.1 Market Definition
- 1.2 Objectives
- 1.3 Market Scope
- 1.4 Segmentation
- 1.4.1 Global PEGylated Proteins Market, by Product & Services
- 1.4.2 Global PEGylated Proteins Market, by Type
- 1.4.3 Global PEGylated Proteins Market, by End-user
- 1.4.4 Global PEGylated Proteins Market, by Application
- 1.4.5 Global PEGylated Proteins Market, by Geography
- 1.5 Methodology for the research
Chapter 2. Market Overview
- 2.1 Introduction
- 2.1.1 Overview
- 2.1.1.1 Market Composition and scenario
- 2.1.1 Overview
- 2.2 Key Factors Impacting the Market
- 2.2.1 Market Drivers
- 2.2.2 Market Restraints
Chapter 3. Strategies Deployed in PEGylated Proteins Market
Chapter 4. Global PEGylated Proteins Market by Product & Services
- 4.1 Global Consumables Market by Region
- 4.2 Global Services Market by Region
Chapter 5. Global PEGylated Proteins Market by Type
- 5.1 Global Colony-stimulating Factor Market by Region
- 5.2 Global Interferons Market by Region
- 5.3 Global Recombinant Factor VII Market by Region
- 5.4 Global Erythropoietin Market by Region
- 5.5 Global Others Market by Region
Chapter 6. Global PEGylated Proteins Market by End-user
- 6.1 Global Pharmaceutical & Biotechnology Companies Market by Region
- 6.2 Global Contract Research Organizations (CROs) Market by Region
- 6.3 Global Academic & Research Institutes Market by Region
Chapter 7. Global PEGylated Proteins Market by Application
- 7.1 Global Cancer Market by Region
- 7.2 Global Autoimmune Diseases Market by Region
- 7.3 Global Hepatitis Market by Region
- 7.4 Global Multiple Sclerosis Market by Region
- 7.5 Global Hemophilia Market by Region
- 7.6 Global Gastrointestinal Disorders Market by Region
- 7.7 Global Others Market by Region
Chapter 8. Global PEGylated Proteins Market by Region
- 8.1 North America PEGylated Proteins Market
- 8.1.1 North America PEGylated Proteins Market by Product & Services
- 8.1.1.1 North America Consumables Market by Country
- 8.1.1.2 North America Services Market by Country
- 8.1.2 North America PEGylated Proteins Market by Type
- 8.1.2.1 North America Colony-stimulating Factor Market by Country
- 8.1.2.2 North America Interferons Market by Country
- 8.1.2.3 North America Recombinant Factor VII Market by Country
- 8.1.2.4 North America Erythropoietin Market by Country
- 8.1.2.5 North America Others Market by Country
- 8.1.3 North America PEGylated Proteins Market by End-user
- 8.1.3.1 North America Pharmaceutical & Biotechnology Companies Market by Country
- 8.1.3.2 North America Contract Research Organizations (CROs) Market by Country
- 8.1.3.3 North America Academic & Research Institutes Market by Country
- 8.1.4 North America PEGylated Proteins Market by Application
- 8.1.4.1 North America Cancer Market by Country
- 8.1.4.2 North America Autoimmune Diseases Market by Country
- 8.1.4.3 North America Hepatitis Market by Country
- 8.1.4.4 North America Multiple Sclerosis Market by Country
- 8.1.4.5 North America Hemophilia Market by Country
- 8.1.4.6 North America Gastrointestinal Disorders Market by Country
- 8.1.4.7 North America Others Market by Country
- 8.1.5 North America PEGylated Proteins Market by Country
- 8.1.5.1 US PEGylated Proteins Market
- 8.1.5.1.1 US PEGylated Proteins Market by Product & Services
- 8.1.5.1.2 US PEGylated Proteins Market by Type
- 8.1.5.1.3 US PEGylated Proteins Market by End-user
- 8.1.5.1.4 US PEGylated Proteins Market by Application
- 8.1.5.2 Canada PEGylated Proteins Market
- 8.1.5.2.1 Canada PEGylated Proteins Market by Product & Services
- 8.1.5.2.2 Canada PEGylated Proteins Market by Type
- 8.1.5.2.3 Canada PEGylated Proteins Market by End-user
- 8.1.5.2.4 Canada PEGylated Proteins Market by Application
- 8.1.5.3 Mexico PEGylated Proteins Market
- 8.1.5.3.1 Mexico PEGylated Proteins Market by Product & Services
- 8.1.5.3.2 Mexico PEGylated Proteins Market by Type
- 8.1.5.3.3 Mexico PEGylated Proteins Market by End-user
- 8.1.5.3.4 Mexico PEGylated Proteins Market by Application
- 8.1.5.4 Rest of North America PEGylated Proteins Market
- 8.1.5.4.1 Rest of North America PEGylated Proteins Market by Product & Services
- 8.1.5.4.2 Rest of North America PEGylated Proteins Market by Type
- 8.1.5.4.3 Rest of North America PEGylated Proteins Market by End-user
- 8.1.5.4.4 Rest of North America PEGylated Proteins Market by Application
- 8.1.5.1 US PEGylated Proteins Market
- 8.1.1 North America PEGylated Proteins Market by Product & Services
- 8.2 Europe PEGylated Proteins Market
- 8.2.1 Europe PEGylated Proteins Market by Product & Services
- 8.2.1.1 Europe Consumables Market by Country
- 8.2.1.2 Europe Services Market by Country
- 8.2.2 Europe PEGylated Proteins Market by Type
- 8.2.2.1 Europe Colony-stimulating Factor Market by Country
- 8.2.2.2 Europe Interferons Market by Country
- 8.2.2.3 Europe Recombinant Factor VII Market by Country
- 8.2.2.4 Europe Erythropoietin Market by Country
- 8.2.2.5 Europe Others Market by Country
- 8.2.3 Europe PEGylated Proteins Market by End-user
- 8.2.3.1 Europe Pharmaceutical & Biotechnology Companies Market by Country
- 8.2.3.2 Europe Contract Research Organizations (CROs) Market by Country
- 8.2.3.3 Europe Academic & Research Institutes Market by Country
- 8.2.4 Europe PEGylated Proteins Market by Application
- 8.2.4.1 Europe Cancer Market by Country
- 8.2.4.2 Europe Autoimmune Diseases Market by Country
- 8.2.4.3 Europe Hepatitis Market by Country
- 8.2.4.4 Europe Multiple Sclerosis Market by Country
- 8.2.4.5 Europe Hemophilia Market by Country
- 8.2.4.6 Europe Gastrointestinal Disorders Market by Country
- 8.2.4.7 Europe Others Market by Country
- 8.2.5 Europe PEGylated Proteins Market by Country
- 8.2.5.1 Germany PEGylated Proteins Market
- 8.2.5.1.1 Germany PEGylated Proteins Market by Product & Services
- 8.2.5.1.2 Germany PEGylated Proteins Market by Type
- 8.2.5.1.3 Germany PEGylated Proteins Market by End-user
- 8.2.5.1.4 Germany PEGylated Proteins Market by Application
- 8.2.5.2 UK PEGylated Proteins Market
- 8.2.5.2.1 UK PEGylated Proteins Market by Product & Services
- 8.2.5.2.2 UK PEGylated Proteins Market by Type
- 8.2.5.2.3 UK PEGylated Proteins Market by End-user
- 8.2.5.2.4 UK PEGylated Proteins Market by Application
- 8.2.5.3 France PEGylated Proteins Market
- 8.2.5.3.1 France PEGylated Proteins Market by Product & Services
- 8.2.5.3.2 France PEGylated Proteins Market by Type
- 8.2.5.3.3 France PEGylated Proteins Market by End-user
- 8.2.5.3.4 France PEGylated Proteins Market by Application
- 8.2.5.4 Russia PEGylated Proteins Market
- 8.2.5.4.1 Russia PEGylated Proteins Market by Product & Services
- 8.2.5.4.2 Russia PEGylated Proteins Market by Type
- 8.2.5.4.3 Russia PEGylated Proteins Market by End-user
- 8.2.5.4.4 Russia PEGylated Proteins Market by Application
- 8.2.5.5 Spain PEGylated Proteins Market
- 8.2.5.5.1 Spain PEGylated Proteins Market by Product & Services
- 8.2.5.5.2 Spain PEGylated Proteins Market by Type
- 8.2.5.5.3 Spain PEGylated Proteins Market by End-user
- 8.2.5.5.4 Spain PEGylated Proteins Market by Application
- 8.2.5.6 Italy PEGylated Proteins Market
- 8.2.5.6.1 Italy PEGylated Proteins Market by Product & Services
- 8.2.5.6.2 Italy PEGylated Proteins Market by Type
- 8.2.5.6.3 Italy PEGylated Proteins Market by End-user
- 8.2.5.6.4 Italy PEGylated Proteins Market by Application
- 8.2.5.7 Rest of Europe PEGylated Proteins Market
- 8.2.5.7.1 Rest of Europe PEGylated Proteins Market by Product & Services
- 8.2.5.7.2 Rest of Europe PEGylated Proteins Market by Type
- 8.2.5.7.3 Rest of Europe PEGylated Proteins Market by End-user
- 8.2.5.7.4 Rest of Europe PEGylated Proteins Market by Application
- 8.2.5.1 Germany PEGylated Proteins Market
- 8.2.1 Europe PEGylated Proteins Market by Product & Services
- 8.3 Asia Pacific PEGylated Proteins Market
- 8.3.1 Asia Pacific PEGylated Proteins Market by Product & Services
- 8.3.1.1 Asia Pacific Consumables Market by Country
- 8.3.1.2 Asia Pacific Services Market by Country
- 8.3.2 Asia Pacific PEGylated Proteins Market by Type
- 8.3.2.1 Asia Pacific Colony-stimulating Factor Market by Country
- 8.3.2.2 Asia Pacific Interferons Market by Country
- 8.3.2.3 Asia Pacific Recombinant Factor VII Market by Country
- 8.3.2.4 Asia Pacific Erythropoietin Market by Country
- 8.3.2.5 Asia Pacific Others Market by Country
- 8.3.3 Asia Pacific PEGylated Proteins Market by End-user
- 8.3.3.1 Asia Pacific Pharmaceutical & Biotechnology Companies Market by Country
- 8.3.3.2 Asia Pacific Contract Research Organizations (CROs) Market by Country
- 8.3.3.3 Asia Pacific Academic & Research Institutes Market by Country
- 8.3.4 Asia Pacific PEGylated Proteins Market by Application
- 8.3.4.1 Asia Pacific Cancer Market by Country
- 8.3.4.2 Asia Pacific Autoimmune Diseases Market by Country
- 8.3.4.3 Asia Pacific Hepatitis Market by Country
- 8.3.4.4 Asia Pacific Multiple Sclerosis Market by Country
- 8.3.4.5 Asia Pacific Hemophilia Market by Country
- 8.3.4.6 Asia Pacific Gastrointestinal Disorders Market by Country
- 8.3.4.7 Asia Pacific Others Market by Country
- 8.3.5 Asia Pacific PEGylated Proteins Market by Country
- 8.3.5.1 China PEGylated Proteins Market
- 8.3.5.1.1 China PEGylated Proteins Market by Product & Services
- 8.3.5.1.2 China PEGylated Proteins Market by Type
- 8.3.5.1.3 China PEGylated Proteins Market by End-user
- 8.3.5.1.4 China PEGylated Proteins Market by Application
- 8.3.5.2 Japan PEGylated Proteins Market
- 8.3.5.2.1 Japan PEGylated Proteins Market by Product & Services
- 8.3.5.2.2 Japan PEGylated Proteins Market by Type
- 8.3.5.2.3 Japan PEGylated Proteins Market by End-user
- 8.3.5.2.4 Japan PEGylated Proteins Market by Application
- 8.3.5.3 India PEGylated Proteins Market
- 8.3.5.3.1 India PEGylated Proteins Market by Product & Services
- 8.3.5.3.2 India PEGylated Proteins Market by Type
- 8.3.5.3.3 India PEGylated Proteins Market by End-user
- 8.3.5.3.4 India PEGylated Proteins Market by Application
- 8.3.5.4 South Korea PEGylated Proteins Market
- 8.3.5.4.1 South Korea PEGylated Proteins Market by Product & Services
- 8.3.5.4.2 South Korea PEGylated Proteins Market by Type
- 8.3.5.4.3 South Korea PEGylated Proteins Market by End-user
- 8.3.5.4.4 South Korea PEGylated Proteins Market by Application
- 8.3.5.5 Singapore PEGylated Proteins Market
- 8.3.5.5.1 Singapore PEGylated Proteins Market by Product & Services
- 8.3.5.5.2 Singapore PEGylated Proteins Market by Type
- 8.3.5.5.3 Singapore PEGylated Proteins Market by End-user
- 8.3.5.5.4 Singapore PEGylated Proteins Market by Application
- 8.3.5.6 Malaysia PEGylated Proteins Market
- 8.3.5.6.1 Malaysia PEGylated Proteins Market by Product & Services
- 8.3.5.6.2 Malaysia PEGylated Proteins Market by Type
- 8.3.5.6.3 Malaysia PEGylated Proteins Market by End-user
- 8.3.5.6.4 Malaysia PEGylated Proteins Market by Application
- 8.3.5.7 Rest of Asia Pacific PEGylated Proteins Market
- 8.3.5.7.1 Rest of Asia Pacific PEGylated Proteins Market by Product & Services
- 8.3.5.7.2 Rest of Asia Pacific PEGylated Proteins Market by Type
- 8.3.5.7.3 Rest of Asia Pacific PEGylated Proteins Market by End-user
- 8.3.5.7.4 Rest of Asia Pacific PEGylated Proteins Market by Application
- 8.3.5.1 China PEGylated Proteins Market
- 8.3.1 Asia Pacific PEGylated Proteins Market by Product & Services
- 8.4 LAMEA PEGylated Proteins Market
- 8.4.1 LAMEA PEGylated Proteins Market by Product & Services
- 8.4.1.1 LAMEA Consumables Market by Country
- 8.4.1.2 LAMEA Services Market by Country
- 8.4.2 LAMEA PEGylated Proteins Market by Type
- 8.4.2.1 LAMEA Colony-stimulating Factor Market by Country
- 8.4.2.2 LAMEA Interferons Market by Country
- 8.4.2.3 LAMEA Recombinant Factor VII Market by Country
- 8.4.2.4 LAMEA Erythropoietin Market by Country
- 8.4.2.5 LAMEA Others Market by Country
- 8.4.3 LAMEA PEGylated Proteins Market by End-user
- 8.4.3.1 LAMEA Pharmaceutical & Biotechnology Companies Market by Country
- 8.4.3.2 LAMEA Contract Research Organizations (CROs) Market by Country
- 8.4.3.3 LAMEA Academic & Research Institutes Market by Country
- 8.4.4 LAMEA PEGylated Proteins Market by Application
- 8.4.4.1 LAMEA Cancer Market by Country
- 8.4.4.2 LAMEA Autoimmune Diseases Market by Country
- 8.4.4.3 LAMEA Hepatitis Market by Country
- 8.4.4.4 LAMEA Multiple Sclerosis Market by Country
- 8.4.4.5 LAMEA Hemophilia Market by Country
- 8.4.4.6 LAMEA Gastrointestinal Disorders Market by Country
- 8.4.4.7 LAMEA Others Market by Country
- 8.4.5 LAMEA PEGylated Proteins Market by Country
- 8.4.5.1 Brazil PEGylated Proteins Market
- 8.4.5.1.1 Brazil PEGylated Proteins Market by Product & Services
- 8.4.5.1.2 Brazil PEGylated Proteins Market by Type
- 8.4.5.1.3 Brazil PEGylated Proteins Market by End-user
- 8.4.5.1.4 Brazil PEGylated Proteins Market by Application
- 8.4.5.2 Argentina PEGylated Proteins Market
- 8.4.5.2.1 Argentina PEGylated Proteins Market by Product & Services
- 8.4.5.2.2 Argentina PEGylated Proteins Market by Type
- 8.4.5.2.3 Argentina PEGylated Proteins Market by End-user
- 8.4.5.2.4 Argentina PEGylated Proteins Market by Application
- 8.4.5.3 UAE PEGylated Proteins Market
- 8.4.5.3.1 UAE PEGylated Proteins Market by Product & Services
- 8.4.5.3.2 UAE PEGylated Proteins Market by Type
- 8.4.5.3.3 UAE PEGylated Proteins Market by End-user
- 8.4.5.3.4 UAE PEGylated Proteins Market by Application
- 8.4.5.4 Saudi Arabia PEGylated Proteins Market
- 8.4.5.4.1 Saudi Arabia PEGylated Proteins Market by Product & Services
- 8.4.5.4.2 Saudi Arabia PEGylated Proteins Market by Type
- 8.4.5.4.3 Saudi Arabia PEGylated Proteins Market by End-user
- 8.4.5.4.4 Saudi Arabia PEGylated Proteins Market by Application
- 8.4.5.5 South Africa PEGylated Proteins Market
- 8.4.5.5.1 South Africa PEGylated Proteins Market by Product & Services
- 8.4.5.5.2 South Africa PEGylated Proteins Market by Type
- 8.4.5.5.3 South Africa PEGylated Proteins Market by End-user
- 8.4.5.5.4 South Africa PEGylated Proteins Market by Application
- 8.4.5.6 Nigeria PEGylated Proteins Market
- 8.4.5.6.1 Nigeria PEGylated Proteins Market by Product & Services
- 8.4.5.6.2 Nigeria PEGylated Proteins Market by Type
- 8.4.5.6.3 Nigeria PEGylated Proteins Market by End-user
- 8.4.5.6.4 Nigeria PEGylated Proteins Market by Application
- 8.4.5.7 Rest of LAMEA PEGylated Proteins Market
- 8.4.5.7.1 Rest of LAMEA PEGylated Proteins Market by Product & Services
- 8.4.5.7.2 Rest of LAMEA PEGylated Proteins Market by Type
- 8.4.5.7.3 Rest of LAMEA PEGylated Proteins Market by End-user
- 8.4.5.7.4 Rest of LAMEA PEGylated Proteins Market by Application
- 8.4.5.1 Brazil PEGylated Proteins Market
- 8.4.1 LAMEA PEGylated Proteins Market by Product & Services
Chapter 9. Company Profiles
- 9.1 Thermo Fisher Scientific, Inc.
- 9.1.1 Company Overview
- 9.1.2 Financial Analysis
- 9.1.3 Segmental and Regional Analysis
- 9.1.4 Research & Development Expense
- 9.1.5 Recent strategies and developments:
- 9.1.5.1 Partnerships, Collaborations, and Agreements:
- 9.1.5.2 Product Launches and Product Expansions:
- 9.1.5.3 Acquisition and Mergers:
- 9.2 Merck Millipore ( Merck Group)
- 9.2.1 Company Overview
- 9.2.2 Financial Analysis
- 9.2.3 Segmental and Regional Analysis
- 9.2.4 Research & Development Expense
- 9.2.5 Recent strategies and developments:
- 9.2.5.1 Partnerships, Collaborations, and Agreements:
- 9.3 NOF Corporation
- 9.3.1 Company Overview
- 9.3.2 Financial Analysis
- 9.3.3 Segmental and Regional Analysis
- 9.3.4 Research & Development Expenses
- 9.4 Beijing Jiankai Technology Co., Ltd. (Jenkem)
- 9.4.1 Company Overview
- 9.5 Creative PEGworks
- 9.5.1 Company Overview
- 9.6 Celares GmbH
- 9.6.1 Company Overview
- 9.7 Quanta BioDesign Ltd.
- 9.7.1 Company Overview
- 9.8 Biomatrik, Inc.
- 9.8.1 Company Overview
- 9.9 Iris Biotech GmbH
- 9.9.1 Company Overview
- 9.10. Laysan Bio, Inc.
- 9.10.1 Company Overview