|
|
市場調査レポート
商品コード
1172673
カスタムソフトウェア開発の世界市場規模、シェア、産業動向分析レポート:ソリューション別、エンドユーザー別、企業規模別、展開別、地域別展望と予測、2022年~2028年Global Custom Software Development Market Size, Share & Industry Trends Analysis Report By Solution, By End User, By Enterprise Size, By Deployment, By Regional Outlook and Forecast, 2022 - 2028 |
||||||
|
|
|||||||


| カスタムソフトウェア開発の世界市場規模、シェア、産業動向分析レポート:ソリューション別、エンドユーザー別、企業規模別、展開別、地域別展望と予測、2022年~2028年 |
|
出版日: 2022年11月30日
発行: KBV Research
ページ情報: 英文 265 Pages
納期: 即納可能
|
- 全表示
- 概要
- 図表
- 目次
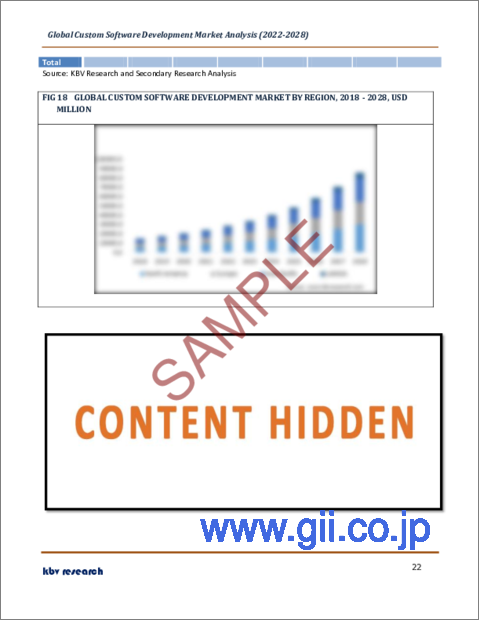
カスタムソフトウェア開発の世界市場規模は、2028年までに859億米ドルに達し、予測期間中にCAGR20.3%の市場成長率で上昇すると予想されています。
マニュアルコーディングのような従来の手法でソフトウェアを開発することは容易ではないかもしれません。企業は、コードの更新に完全に特化したチーム全体を必要とし、通常2~8カ月を要します。LCDPを使用すれば、チームはカスタムソフトウェアを構築して、従来のコーディングよりも迅速に多くのアプリを作成することができます。さらに、LDCPはビジュアル開発環境なので、設計も開発も簡単です。
カスタムソフトウェアアプリケーションは、各業界でブランドの宣伝や収益アップのために使用されています。これらにより、企業の事業展開の方法が大幅に改善されました。よりビジネスに特化したソフトウェアへのニーズの高まりにより、カスタムソフトウェア開発ソリューションへの高い需要が生まれました。今日、カスタムソフトウェア開発の必要性は、これらが組織の様々な目的を満たすのに役立つので、着実に上昇しています。
COVID-19の影響分析
パンデミックの期間中、多くの企業が事業や業務を閉鎖、または小規模な制限を余儀なくされました。その結果、多くの機関の閉鎖は、オンラインプレゼンスの成長によって安定化されました。このことは、大企業だけでなく、中小企業にも当てはまることが証明されました。オンラインショッピングと小売の出現は、多くの企業がアプリケーションを開発し、市場に出すことにも影響を与えました。その結果、ソフトウェア開発の採用が飛躍的に伸びたのです。あらゆる業界からの需要が高まり、特にエンターテインメントや小売業界からは、それぞれゲームアプリケーションや電子書籍ストアなど、幅広い製品要件が出されました。
市場成長要因
オープンソースプラットフォームの展開の増加
オープンソースプラットフォームは、効率的かつ長期的に動作するカスタムソフトウェアを開発するために不可欠なものです。オープンソースソフトウェアプラットフォームは、誰でも修正、検査、拡張が可能なソースコードを利用します。オープンソースソフトウェアは、プロプライエタリなソフトウェアよりも入手が容易であるため、ソフトウェアの利用が増加します。オープンソースソフトウェアは、重要なソリューションとして非常に効率的であるため、企業はさまざまな形態のオープンソースソフトウェアをますます使用するようになっています。
AI対応チャットボットの導入が進む
現代において、人工知能(AI)は継続的に発展しており、インターネットに不可欠な存在となっています。多くの企業は、アプリケーション上でバーチャルアシスタントを提供し、顧客の不安を払拭することを目指しています。その結果、チャットボットの利用が大幅に増加しました。チャットボットは、ソフトウェア開発領域における主要な技術であり、カスタマーサポートの対話をシミュレートするために作成されます。これらは非常に便利なものとなっており、顧客サービスの効率的な合理化を実現します。
市場の抑制要因
カスタムソフトウェア開発サービスのアウトソーシング
多くの企業は、カスタムソフトウェア開発を選択する際、オフショア化する傾向があります。しかし、文化的な違いや距離の問題などを考慮しなければ、そのようなことは不可能です。そのため、もし企業が経験の浅い、あるいは信頼性の低いアウトソーシング・プロバイダーを選ぶと、ミスコミュニケーションや非同期性、さらには不正なベンダーといった問題が発生する可能性があります。その結果、業務や進捗に支障をきたすことになります。
ソリューションの展望
カスタムソフトウェア開発市場は、ソリューション別に、Webベースソリューション、モバイルアプリ、エンタープライズソフトウェアに分類されます。2021年のカスタムソフトウェア開発市場では、ウェブベースのソリューションセグメントがかなりの成長率を調達しました。これらのソリューションは、リアルタイムデータの収集、ハードウェアのコストの排除、リモートアクセスの容易さなどにより、成長が見込まれています。さらに、これらのソリューションを通じて簡単にデータを共有することができ、集中管理されたソフトウェアサーバーとのシームレスなコラボレーションが可能なことから、あらゆる企業にとって理想的な拡張ソリューションとして確立されています。
エンドユーザー向け展望
カスタムソフトウェア開発市場は、エンドユーザーによってBFSI、政府・防衛、ヘルスケア、IT・通信、製造、小売、その他に分類されます。2021年のカスタムソフトウェア開発市場では、IT・通信分野が顕著な成長率を示しています。従来のソフトウェアと比較した場合、顧客の要件に合わせてカスタマイズされたITサービスやソリューションは、より優れた柔軟性を提供します。カスタムソフトウェアは、効率的な運用、レポートやアップデートの合理化、ライセンスコストの削減、メンテナンスの軽減などのメリットを企業に提供します。
企業規模の展望
カスタムソフトウェア開発市場は、企業規模により、大企業と中小企業に分類されます。2021年のカスタムソフトウェア開発市場では、中小企業部門が顕著な成長率を調達しました。カスタムソフトウェアが中小企業に提供する費用対効果やスケーラビリティが、その利用を増加させる主な要因となっています。カスタムソフトウェアは、中小企業の効率性と生産性の向上を支援し、それによって組織のワークフローを容易にすることを可能にします。
導入の見通し
カスタムソフトウェア開発市場は、導入形態によってクラウドとオンプレミスに分類されます。2021年のカスタムソフトウェア開発市場では、クラウド型展開セグメントが最大の収益シェアを獲得しました。柔軟性、アクセスのしやすさ、費用対効果など、企業規模に関わらず活用できる有益なサービスが、このセグメントの成長を後押ししている主な要因です。クラウドベースのサービスでは、月額料金や年会費以外にインフラの追加コストが発生しません。そのため、中小企業にも好まれています。
地域別の展望
カスタムソフトウェア開発市場は、地域別に北米、欧州、アジア太平洋、中東・アフリカ(LAMEA)で分析されます。北米セグメントは、2021年のカスタムソフトウェア開発市場で最大の収益シェアを示しました。専門知識の活用の広がり、中小企業の増加、ITサービスの増加が、このセグメントの成長を促進しています。さらに、同地域は高度な技術とデジタルトランスフォーメーションの成長率が高いため、カスタムソフトウェア開発サービスを提供する上で非常に好ましい地域になっています。
市場参入企業が採用している主な戦略は、パートナーシップです。Cardinal matrixで提示された分析に基づき、Tata Consultancy Services Ltd.、Capgemini SE、Infosys Limitedがカスタムソフトウェア開発市場の先駆者です。Infopulse Ukraine LLC、Brainvire Infotech, Inc.などの企業は、カスタムソフトウェア開発市場における主要な革新者です。
目次
第1章 市場の範囲と調査手法
- 市場の定義
- 目的
- 市場規模
- セグメンテーション
- カスタムソフトウェア開発の世界市場、ソリューション別
- カスタムソフトウェア開発の世界市場、エンドユーザー別
- カスタムソフトウェア開発の世界市場、企業規模別
- カスタムソフトウェア開発の世界市場、配備別
- カスタムソフトウェア開発の世界市場、地域別
- 調査手法
第2章 市場概要
- イントロダクション
- 概要説明
- 市場の構成とシナリオ
- 概要説明
- 市場に影響を与える主な要因
- 市場促進要因
- 市場の抑制要因
第3章 競合分析-世界
- KBVカーディナルマトリックス
- 最近の業界全体の戦略的展開
- パートナーシップ、コラボレーション、および契約
- 製品上市と製品拡大
- 地理的拡大
- 主要成功戦略
- 主要なリーディング戦略:割合の分布(2018年~2022年)
第4章 カスタムソフトウェア開発の世界市場:ソリューション別
- エンタープライズソフトウェアの世界市場:地域別
- ウェブベースのソリューションの世界市場:地域別
- モバイルアプリの世界市場:地域別
第5章 カスタムソフトウェア開発の世界市場:エンドユーザー別
- BFSIの地域別世界市場
- 製造業の世界市場:地域別
- 政府・防衛の世界市場:地域別
- テレコム&ITの世界市場:地域別
- 小売業の地域別市場
- 世界のヘルスケア市場:地域別
- その他の最終用途の世界市場:地域別
第6章 カスタムソフトウェア開発の世界市場:企業規模別
- 大企業の世界市場:地域別
- 世界の中小企業市場:地域別
第7章 カスタムソフトウェア開発の世界市場:デプロイメント別
- クラウドの世界市場:地域別
- オンプレミスの世界市場:地域別
第8章 カスタムソフトウェア開発の世界市場:地域別
- 北米
- 北米のカスタムソフトウェア開発の国別市場
- 米国
- カナダ
- メキシコ
- その他北米地域
- 北米のカスタムソフトウェア開発の国別市場
- 欧州
- 欧州のカスタムソフトウェア開発の国別市場
- ドイツ
- 英国
- フランス
- ロシア
- スペイン
- イタリア
- その他欧州
- 欧州のカスタムソフトウェア開発の国別市場
- アジア太平洋地域
- アジア太平洋地域のカスタムソフトウェア開発市場:国別
- 中国
- 日本
- インド
- 韓国
- シンガポール
- マレーシア
- その他アジア太平洋地域
- アジア太平洋地域のカスタムソフトウェア開発市場:国別
- LAMEA
- LAMEAカスタムソフトウェア開発の国別市場
- ブラジル
- アルゼンチン
- UAE
- サウジアラビア
- 南アフリカ
- ナイジェリア
- LAMEAの他の地域
- LAMEAカスタムソフトウェア開発の国別市場
第9章 企業プロファイル
- Tata Consultancy Services Ltd.
- Infosys Limited
- Capgemini SE
- Infopulse Ukraine LLC(Tietoevry Corporation)
- Magora Systems
- Iflexion
- MentorMate, Inc.(Taylor Corporation)
- Trigent Software Inc.
- TRooTech Business Solutions Pvt. Ltd.
- Brainvire Infotech, Inc.
LIST OF TABLES
- TABLE 1 Global Custom Software Development Market, 2018 - 2021, USD Million
- TABLE 2 Global Custom Software Development Market, 2022 - 2028, USD Million
- TABLE 3 Partnerships, Collaborations, and Agreements- Custom Software Development Market
- TABLE 4 Product Launches And Product Expansions- Custom Software Development Market
- TABLE 5 Geographical Expansions - Custom Software Development Market
- TABLE 6 Global Custom Software Development Market by Solution, 2018 - 2021, USD Million
- TABLE 7 Global Custom Software Development Market by Solution, 2022 - 2028, USD Million
- TABLE 8 Global Enterprise Software Market by Region, 2018 - 2021, USD Million
- TABLE 9 Global Enterprise Software Market by Region, 2022 - 2028, USD Million
- TABLE 10 Global Web-based Solutions Market by Region, 2018 - 2021, USD Million
- TABLE 11 Global Web-based Solutions Market by Region, 2022 - 2028, USD Million
- TABLE 12 Global Mobile App Market by Region, 2018 - 2021, USD Million
- TABLE 13 Global Mobile App Market by Region, 2022 - 2028, USD Million
- TABLE 14 Global Custom Software Development Market by End-use, 2018 - 2021, USD Million
- TABLE 15 Global Custom Software Development Market by End-use, 2022 - 2028, USD Million
- TABLE 16 Global BFSI Market by Region, 2018 - 2021, USD Million
- TABLE 17 Global BFSI Market by Region, 2022 - 2028, USD Million
- TABLE 18 Global Manufacturing Market by Region, 2018 - 2021, USD Million
- TABLE 19 Global Manufacturing Market by Region, 2022 - 2028, USD Million
- TABLE 20 Global Government & Defense Market by Region, 2018 - 2021, USD Million
- TABLE 21 Global Government & Defense Market by Region, 2022 - 2028, USD Million
- TABLE 22 Global Telecom & IT Market by Region, 2018 - 2021, USD Million
- TABLE 23 Global Telecom & IT Market by Region, 2022 - 2028, USD Million
- TABLE 24 Global Retail Market by Region, 2018 - 2021, USD Million
- TABLE 25 Global Retail Market by Region, 2022 - 2028, USD Million
- TABLE 26 Global Healthcare Market by Region, 2018 - 2021, USD Million
- TABLE 27 Global Healthcare Market by Region, 2022 - 2028, USD Million
- TABLE 28 Global Other End-use Market by Region, 2018 - 2021, USD Million
- TABLE 29 Global Other End-use Market by Region, 2022 - 2028, USD Million
- TABLE 30 Global Custom Software Development Market by Enterprise Size, 2018 - 2021, USD Million
- TABLE 31 Global Custom Software Development Market by Enterprise Size, 2022 - 2028, USD Million
- TABLE 32 Global Large Enterprises Market by Region, 2018 - 2021, USD Million
- TABLE 33 Global Large Enterprises Market by Region, 2022 - 2028, USD Million
- TABLE 34 Global Small & Medium Enterprises Market by Region, 2018 - 2021, USD Million
- TABLE 35 Global Small & Medium Enterprises Market by Region, 2022 - 2028, USD Million
- TABLE 36 Global Custom Software Development Market by Deployment, 2018 - 2021, USD Million
- TABLE 37 Global Custom Software Development Market by Deployment, 2022 - 2028, USD Million
- TABLE 38 Global Cloud Market by Region, 2018 - 2021, USD Million
- TABLE 39 Global Cloud Market by Region, 2022 - 2028, USD Million
- TABLE 40 Global On-premise Market by Region, 2018 - 2021, USD Million
- TABLE 41 Global On-premise Market by Region, 2022 - 2028, USD Million
- TABLE 42 Global Custom Software Development Market by Region, 2018 - 2021, USD Million
- TABLE 43 Global Custom Software Development Market by Region, 2022 - 2028, USD Million
- TABLE 44 North America Custom Software Development Market, 2018 - 2021, USD Million
- TABLE 45 North America Custom Software Development Market, 2022 - 2028, USD Million
- TABLE 46 North America Custom Software Development Market by Solution, 2018 - 2021, USD Million
- TABLE 47 North America Custom Software Development Market by Solution, 2022 - 2028, USD Million
- TABLE 48 North America Enterprise Software Market by Country, 2018 - 2021, USD Million
- TABLE 49 North America Enterprise Software Market by Country, 2022 - 2028, USD Million
- TABLE 50 North America Web-based Solutions Market by Country, 2018 - 2021, USD Million
- TABLE 51 North America Web-based Solutions Market by Country, 2022 - 2028, USD Million
- TABLE 52 North America Mobile App Market by Country, 2018 - 2021, USD Million
- TABLE 53 North America Mobile App Market by Country, 2022 - 2028, USD Million
- TABLE 54 North America Custom Software Development Market by End-use, 2018 - 2021, USD Million
- TABLE 55 North America Custom Software Development Market by End-use, 2022 - 2028, USD Million
- TABLE 56 North America BFSI Market by Country, 2018 - 2021, USD Million
- TABLE 57 North America BFSI Market by Country, 2022 - 2028, USD Million
- TABLE 58 North America Manufacturing Market by Country, 2018 - 2021, USD Million
- TABLE 59 North America Manufacturing Market by Country, 2022 - 2028, USD Million
- TABLE 60 North America Government & Defense Market by Country, 2018 - 2021, USD Million
- TABLE 61 North America Government & Defense Market by Country, 2022 - 2028, USD Million
- TABLE 62 North America Telecom & IT Market by Country, 2018 - 2021, USD Million
- TABLE 63 North America Telecom & IT Market by Country, 2022 - 2028, USD Million
- TABLE 64 North America Retail Market by Country, 2018 - 2021, USD Million
- TABLE 65 North America Retail Market by Country, 2022 - 2028, USD Million
- TABLE 66 North America Healthcare Market by Country, 2018 - 2021, USD Million
- TABLE 67 North America Healthcare Market by Country, 2022 - 2028, USD Million
- TABLE 68 North America Other End-use Market by Country, 2018 - 2021, USD Million
- TABLE 69 North America Other End-use Market by Country, 2022 - 2028, USD Million
- TABLE 70 North America Custom Software Development Market by Enterprise Size, 2018 - 2021, USD Million
- TABLE 71 North America Custom Software Development Market by Enterprise Size, 2022 - 2028, USD Million
- TABLE 72 North America Large Enterprises Market by Country, 2018 - 2021, USD Million
- TABLE 73 North America Large Enterprises Market by Country, 2022 - 2028, USD Million
- TABLE 74 North America Small & Medium Enterprises Market by Country, 2018 - 2021, USD Million
- TABLE 75 North America Small & Medium Enterprises Market by Country, 2022 - 2028, USD Million
- TABLE 76 North America Custom Software Development Market by Deployment, 2018 - 2021, USD Million
- TABLE 77 North America Custom Software Development Market by Deployment, 2022 - 2028, USD Million
- TABLE 78 North America Cloud Market by Country, 2018 - 2021, USD Million
- TABLE 79 North America Cloud Market by Country, 2022 - 2028, USD Million
- TABLE 80 North America On-premise Market by Country, 2018 - 2021, USD Million
- TABLE 81 North America On-premise Market by Country, 2022 - 2028, USD Million
- TABLE 82 North America Custom Software Development Market by Country, 2018 - 2021, USD Million
- TABLE 83 North America Custom Software Development Market by Country, 2022 - 2028, USD Million
- TABLE 84 US Custom Software Development Market, 2018 - 2021, USD Million
- TABLE 85 US Custom Software Development Market, 2022 - 2028, USD Million
- TABLE 86 US Custom Software Development Market by Solution, 2018 - 2021, USD Million
- TABLE 87 US Custom Software Development Market by Solution, 2022 - 2028, USD Million
- TABLE 88 US Custom Software Development Market by End-use, 2018 - 2021, USD Million
- TABLE 89 US Custom Software Development Market by End-use, 2022 - 2028, USD Million
- TABLE 90 US Custom Software Development Market by Enterprise Size, 2018 - 2021, USD Million
- TABLE 91 US Custom Software Development Market by Enterprise Size, 2022 - 2028, USD Million
- TABLE 92 US Custom Software Development Market by Deployment, 2018 - 2021, USD Million
- TABLE 93 US Custom Software Development Market by Deployment, 2022 - 2028, USD Million
- TABLE 94 Canada Custom Software Development Market, 2018 - 2021, USD Million
- TABLE 95 Canada Custom Software Development Market, 2022 - 2028, USD Million
- TABLE 96 Canada Custom Software Development Market by Solution, 2018 - 2021, USD Million
- TABLE 97 Canada Custom Software Development Market by Solution, 2022 - 2028, USD Million
- TABLE 98 Canada Custom Software Development Market by End-use, 2018 - 2021, USD Million
- TABLE 99 Canada Custom Software Development Market by End-use, 2022 - 2028, USD Million
- TABLE 100 Canada Custom Software Development Market by Enterprise Size, 2018 - 2021, USD Million
- TABLE 101 Canada Custom Software Development Market by Enterprise Size, 2022 - 2028, USD Million
- TABLE 102 Canada Custom Software Development Market by Deployment, 2018 - 2021, USD Million
- TABLE 103 Canada Custom Software Development Market by Deployment, 2022 - 2028, USD Million
- TABLE 104 Mexico Custom Software Development Market, 2018 - 2021, USD Million
- TABLE 105 Mexico Custom Software Development Market, 2022 - 2028, USD Million
- TABLE 106 Mexico Custom Software Development Market by Solution, 2018 - 2021, USD Million
- TABLE 107 Mexico Custom Software Development Market by Solution, 2022 - 2028, USD Million
- TABLE 108 Mexico Custom Software Development Market by End-use, 2018 - 2021, USD Million
- TABLE 109 Mexico Custom Software Development Market by End-use, 2022 - 2028, USD Million
- TABLE 110 Mexico Custom Software Development Market by Enterprise Size, 2018 - 2021, USD Million
- TABLE 111 Mexico Custom Software Development Market by Enterprise Size, 2022 - 2028, USD Million
- TABLE 112 Mexico Custom Software Development Market by Deployment, 2018 - 2021, USD Million
- TABLE 113 Mexico Custom Software Development Market by Deployment, 2022 - 2028, USD Million
- TABLE 114 Rest of North America Custom Software Development Market, 2018 - 2021, USD Million
- TABLE 115 Rest of North America Custom Software Development Market, 2022 - 2028, USD Million
- TABLE 116 Rest of North America Custom Software Development Market by Solution, 2018 - 2021, USD Million
- TABLE 117 Rest of North America Custom Software Development Market by Solution, 2022 - 2028, USD Million
- TABLE 118 Rest of North America Custom Software Development Market by End-use, 2018 - 2021, USD Million
- TABLE 119 Rest of North America Custom Software Development Market by End-use, 2022 - 2028, USD Million
- TABLE 120 Rest of North America Custom Software Development Market by Enterprise Size, 2018 - 2021, USD Million
- TABLE 121 Rest of North America Custom Software Development Market by Enterprise Size, 2022 - 2028, USD Million
- TABLE 122 Rest of North America Custom Software Development Market by Deployment, 2018 - 2021, USD Million
- TABLE 123 Rest of North America Custom Software Development Market by Deployment, 2022 - 2028, USD Million
- TABLE 124 Europe Custom Software Development Market, 2018 - 2021, USD Million
- TABLE 125 Europe Custom Software Development Market, 2022 - 2028, USD Million
- TABLE 126 Europe Custom Software Development Market by Solution, 2018 - 2021, USD Million
- TABLE 127 Europe Custom Software Development Market by Solution, 2022 - 2028, USD Million
- TABLE 128 Europe Enterprise Software Market by Country, 2018 - 2021, USD Million
- TABLE 129 Europe Enterprise Software Market by Country, 2022 - 2028, USD Million
- TABLE 130 Europe Web-based Solutions Market by Country, 2018 - 2021, USD Million
- TABLE 131 Europe Web-based Solutions Market by Country, 2022 - 2028, USD Million
- TABLE 132 Europe Mobile App Market by Country, 2018 - 2021, USD Million
- TABLE 133 Europe Mobile App Market by Country, 2022 - 2028, USD Million
- TABLE 134 Europe Custom Software Development Market by End-use, 2018 - 2021, USD Million
- TABLE 135 Europe Custom Software Development Market by End-use, 2022 - 2028, USD Million
- TABLE 136 Europe BFSI Market by Country, 2018 - 2021, USD Million
- TABLE 137 Europe BFSI Market by Country, 2022 - 2028, USD Million
- TABLE 138 Europe Manufacturing Market by Country, 2018 - 2021, USD Million
- TABLE 139 Europe Manufacturing Market by Country, 2022 - 2028, USD Million
- TABLE 140 Europe Government & Defense Market by Country, 2018 - 2021, USD Million
- TABLE 141 Europe Government & Defense Market by Country, 2022 - 2028, USD Million
- TABLE 142 Europe Telecom & IT Market by Country, 2018 - 2021, USD Million
- TABLE 143 Europe Telecom & IT Market by Country, 2022 - 2028, USD Million
- TABLE 144 Europe Retail Market by Country, 2018 - 2021, USD Million
- TABLE 145 Europe Retail Market by Country, 2022 - 2028, USD Million
- TABLE 146 Europe Healthcare Market by Country, 2018 - 2021, USD Million
- TABLE 147 Europe Healthcare Market by Country, 2022 - 2028, USD Million
- TABLE 148 Europe Other End-use Market by Country, 2018 - 2021, USD Million
- TABLE 149 Europe Other End-use Market by Country, 2022 - 2028, USD Million
- TABLE 150 Europe Custom Software Development Market by Enterprise Size, 2018 - 2021, USD Million
- TABLE 151 Europe Custom Software Development Market by Enterprise Size, 2022 - 2028, USD Million
- TABLE 152 Europe Large Enterprises Market by Country, 2018 - 2021, USD Million
- TABLE 153 Europe Large Enterprises Market by Country, 2022 - 2028, USD Million
- TABLE 154 Europe Small & Medium Enterprises Market by Country, 2018 - 2021, USD Million
- TABLE 155 Europe Small & Medium Enterprises Market by Country, 2022 - 2028, USD Million
- TABLE 156 Europe Custom Software Development Market by Deployment, 2018 - 2021, USD Million
- TABLE 157 Europe Custom Software Development Market by Deployment, 2022 - 2028, USD Million
- TABLE 158 Europe Cloud Market by Country, 2018 - 2021, USD Million
- TABLE 159 Europe Cloud Market by Country, 2022 - 2028, USD Million
- TABLE 160 Europe On-premise Market by Country, 2018 - 2021, USD Million
- TABLE 161 Europe On-premise Market by Country, 2022 - 2028, USD Million
- TABLE 162 Europe Custom Software Development Market by Country, 2018 - 2021, USD Million
- TABLE 163 Europe Custom Software Development Market by Country, 2022 - 2028, USD Million
- TABLE 164 Germany Custom Software Development Market, 2018 - 2021, USD Million
- TABLE 165 Germany Custom Software Development Market, 2022 - 2028, USD Million
- TABLE 166 Germany Custom Software Development Market by Solution, 2018 - 2021, USD Million
- TABLE 167 Germany Custom Software Development Market by Solution, 2022 - 2028, USD Million
- TABLE 168 Germany Custom Software Development Market by End-use, 2018 - 2021, USD Million
- TABLE 169 Germany Custom Software Development Market by End-use, 2022 - 2028, USD Million
- TABLE 170 Germany Custom Software Development Market by Enterprise Size, 2018 - 2021, USD Million
- TABLE 171 Germany Custom Software Development Market by Enterprise Size, 2022 - 2028, USD Million
- TABLE 172 Germany Custom Software Development Market by Deployment, 2018 - 2021, USD Million
- TABLE 173 Germany Custom Software Development Market by Deployment, 2022 - 2028, USD Million
- TABLE 174 UK Custom Software Development Market, 2018 - 2021, USD Million
- TABLE 175 UK Custom Software Development Market, 2022 - 2028, USD Million
- TABLE 176 UK Custom Software Development Market by Solution, 2018 - 2021, USD Million
- TABLE 177 UK Custom Software Development Market by Solution, 2022 - 2028, USD Million
- TABLE 178 UK Custom Software Development Market by End-use, 2018 - 2021, USD Million
- TABLE 179 UK Custom Software Development Market by End-use, 2022 - 2028, USD Million
- TABLE 180 UK Custom Software Development Market by Enterprise Size, 2018 - 2021, USD Million
- TABLE 181 UK Custom Software Development Market by Enterprise Size, 2022 - 2028, USD Million
- TABLE 182 UK Custom Software Development Market by Deployment, 2018 - 2021, USD Million
- TABLE 183 UK Custom Software Development Market by Deployment, 2022 - 2028, USD Million
- TABLE 184 France Custom Software Development Market, 2018 - 2021, USD Million
- TABLE 185 France Custom Software Development Market, 2022 - 2028, USD Million
- TABLE 186 France Custom Software Development Market by Solution, 2018 - 2021, USD Million
- TABLE 187 France Custom Software Development Market by Solution, 2022 - 2028, USD Million
- TABLE 188 France Custom Software Development Market by End-use, 2018 - 2021, USD Million
- TABLE 189 France Custom Software Development Market by End-use, 2022 - 2028, USD Million
- TABLE 190 France Custom Software Development Market by Enterprise Size, 2018 - 2021, USD Million
- TABLE 191 France Custom Software Development Market by Enterprise Size, 2022 - 2028, USD Million
- TABLE 192 France Custom Software Development Market by Deployment, 2018 - 2021, USD Million
- TABLE 193 France Custom Software Development Market by Deployment, 2022 - 2028, USD Million
- TABLE 194 Russia Custom Software Development Market, 2018 - 2021, USD Million
- TABLE 195 Russia Custom Software Development Market, 2022 - 2028, USD Million
- TABLE 196 Russia Custom Software Development Market by Solution, 2018 - 2021, USD Million
- TABLE 197 Russia Custom Software Development Market by Solution, 2022 - 2028, USD Million
- TABLE 198 Russia Custom Software Development Market by End-use, 2018 - 2021, USD Million
- TABLE 199 Russia Custom Software Development Market by End-use, 2022 - 2028, USD Million
- TABLE 200 Russia Custom Software Development Market by Enterprise Size, 2018 - 2021, USD Million
- TABLE 201 Russia Custom Software Development Market by Enterprise Size, 2022 - 2028, USD Million
- TABLE 202 Russia Custom Software Development Market by Deployment, 2018 - 2021, USD Million
- TABLE 203 Russia Custom Software Development Market by Deployment, 2022 - 2028, USD Million
- TABLE 204 Spain Custom Software Development Market, 2018 - 2021, USD Million
- TABLE 205 Spain Custom Software Development Market, 2022 - 2028, USD Million
- TABLE 206 Spain Custom Software Development Market by Solution, 2018 - 2021, USD Million
- TABLE 207 Spain Custom Software Development Market by Solution, 2022 - 2028, USD Million
- TABLE 208 Spain Custom Software Development Market by End-use, 2018 - 2021, USD Million
- TABLE 209 Spain Custom Software Development Market by End-use, 2022 - 2028, USD Million
- TABLE 210 Spain Custom Software Development Market by Enterprise Size, 2018 - 2021, USD Million
- TABLE 211 Spain Custom Software Development Market by Enterprise Size, 2022 - 2028, USD Million
- TABLE 212 Spain Custom Software Development Market by Deployment, 2018 - 2021, USD Million
- TABLE 213 Spain Custom Software Development Market by Deployment, 2022 - 2028, USD Million
- TABLE 214 Italy Custom Software Development Market, 2018 - 2021, USD Million
- TABLE 215 Italy Custom Software Development Market, 2022 - 2028, USD Million
- TABLE 216 Italy Custom Software Development Market by Solution, 2018 - 2021, USD Million
- TABLE 217 Italy Custom Software Development Market by Solution, 2022 - 2028, USD Million
- TABLE 218 Italy Custom Software Development Market by End-use, 2018 - 2021, USD Million
- TABLE 219 Italy Custom Software Development Market by End-use, 2022 - 2028, USD Million
- TABLE 220 Italy Custom Software Development Market by Enterprise Size, 2018 - 2021, USD Million
- TABLE 221 Italy Custom Software Development Market by Enterprise Size, 2022 - 2028, USD Million
- TABLE 222 Italy Custom Software Development Market by Deployment, 2018 - 2021, USD Million
- TABLE 223 Italy Custom Software Development Market by Deployment, 2022 - 2028, USD Million
- TABLE 224 Rest of Europe Custom Software Development Market, 2018 - 2021, USD Million
- TABLE 225 Rest of Europe Custom Software Development Market, 2022 - 2028, USD Million
- TABLE 226 Rest of Europe Custom Software Development Market by Solution, 2018 - 2021, USD Million
- TABLE 227 Rest of Europe Custom Software Development Market by Solution, 2022 - 2028, USD Million
- TABLE 228 Rest of Europe Custom Software Development Market by End-use, 2018 - 2021, USD Million
- TABLE 229 Rest of Europe Custom Software Development Market by End-use, 2022 - 2028, USD Million
- TABLE 230 Rest of Europe Custom Software Development Market by Enterprise Size, 2018 - 2021, USD Million
- TABLE 231 Rest of Europe Custom Software Development Market by Enterprise Size, 2022 - 2028, USD Million
- TABLE 232 Rest of Europe Custom Software Development Market by Deployment, 2018 - 2021, USD Million
- TABLE 233 Rest of Europe Custom Software Development Market by Deployment, 2022 - 2028, USD Million
- TABLE 234 Asia Pacific Custom Software Development Market, 2018 - 2021, USD Million
- TABLE 235 Asia Pacific Custom Software Development Market, 2022 - 2028, USD Million
- TABLE 236 Asia Pacific Custom Software Development Market by Solution, 2018 - 2021, USD Million
- TABLE 237 Asia Pacific Custom Software Development Market by Solution, 2022 - 2028, USD Million
- TABLE 238 Asia Pacific Enterprise Software Market by Country, 2018 - 2021, USD Million
- TABLE 239 Asia Pacific Enterprise Software Market by Country, 2022 - 2028, USD Million
- TABLE 240 Asia Pacific Web-based Solutions Market by Country, 2018 - 2021, USD Million
- TABLE 241 Asia Pacific Web-based Solutions Market by Country, 2022 - 2028, USD Million
- TABLE 242 Asia Pacific Mobile App Market by Country, 2018 - 2021, USD Million
- TABLE 243 Asia Pacific Mobile App Market by Country, 2022 - 2028, USD Million
- TABLE 244 Asia Pacific Custom Software Development Market by End-use, 2018 - 2021, USD Million
- TABLE 245 Asia Pacific Custom Software Development Market by End-use, 2022 - 2028, USD Million
- TABLE 246 Asia Pacific BFSI Market by Country, 2018 - 2021, USD Million
- TABLE 247 Asia Pacific BFSI Market by Country, 2022 - 2028, USD Million
- TABLE 248 Asia Pacific Manufacturing Market by Country, 2018 - 2021, USD Million
- TABLE 249 Asia Pacific Manufacturing Market by Country, 2022 - 2028, USD Million
- TABLE 250 Asia Pacific Government & Defense Market by Country, 2018 - 2021, USD Million
- TABLE 251 Asia Pacific Government & Defense Market by Country, 2022 - 2028, USD Million
- TABLE 252 Asia Pacific Telecom & IT Market by Country, 2018 - 2021, USD Million
- TABLE 253 Asia Pacific Telecom & IT Market by Country, 2022 - 2028, USD Million
- TABLE 254 Asia Pacific Retail Market by Country, 2018 - 2021, USD Million
- TABLE 255 Asia Pacific Retail Market by Country, 2022 - 2028, USD Million
- TABLE 256 Asia Pacific Healthcare Market by Country, 2018 - 2021, USD Million
- TABLE 257 Asia Pacific Healthcare Market by Country, 2022 - 2028, USD Million
- TABLE 258 Asia Pacific Other End-use Market by Country, 2018 - 2021, USD Million
- TABLE 259 Asia Pacific Other End-use Market by Country, 2022 - 2028, USD Million
- TABLE 260 Asia Pacific Custom Software Development Market by Enterprise Size, 2018 - 2021, USD Million
- TABLE 261 Asia Pacific Custom Software Development Market by Enterprise Size, 2022 - 2028, USD Million
- TABLE 262 Asia Pacific Large Enterprises Market by Country, 2018 - 2021, USD Million
- TABLE 263 Asia Pacific Large Enterprises Market by Country, 2022 - 2028, USD Million
- TABLE 264 Asia Pacific Small & Medium Enterprises Market by Country, 2018 - 2021, USD Million
- TABLE 265 Asia Pacific Small & Medium Enterprises Market by Country, 2022 - 2028, USD Million
- TABLE 266 Asia Pacific Custom Software Development Market by Deployment, 2018 - 2021, USD Million
- TABLE 267 Asia Pacific Custom Software Development Market by Deployment, 2022 - 2028, USD Million
- TABLE 268 Asia Pacific Cloud Market by Country, 2018 - 2021, USD Million
- TABLE 269 Asia Pacific Cloud Market by Country, 2022 - 2028, USD Million
- TABLE 270 Asia Pacific On-premise Market by Country, 2018 - 2021, USD Million
- TABLE 271 Asia Pacific On-premise Market by Country, 2022 - 2028, USD Million
- TABLE 272 Asia Pacific Custom Software Development Market by Country, 2018 - 2021, USD Million
- TABLE 273 Asia Pacific Custom Software Development Market by Country, 2022 - 2028, USD Million
- TABLE 274 China Custom Software Development Market, 2018 - 2021, USD Million
- TABLE 275 China Custom Software Development Market, 2022 - 2028, USD Million
- TABLE 276 China Custom Software Development Market by Solution, 2018 - 2021, USD Million
- TABLE 277 China Custom Software Development Market by Solution, 2022 - 2028, USD Million
- TABLE 278 China Custom Software Development Market by End-use, 2018 - 2021, USD Million
- TABLE 279 China Custom Software Development Market by End-use, 2022 - 2028, USD Million
- TABLE 280 China Custom Software Development Market by Enterprise Size, 2018 - 2021, USD Million
- TABLE 281 China Custom Software Development Market by Enterprise Size, 2022 - 2028, USD Million
- TABLE 282 China Custom Software Development Market by Deployment, 2018 - 2021, USD Million
- TABLE 283 China Custom Software Development Market by Deployment, 2022 - 2028, USD Million
- TABLE 284 Japan Custom Software Development Market, 2018 - 2021, USD Million
- TABLE 285 Japan Custom Software Development Market, 2022 - 2028, USD Million
- TABLE 286 Japan Custom Software Development Market by Solution, 2018 - 2021, USD Million
- TABLE 287 Japan Custom Software Development Market by Solution, 2022 - 2028, USD Million
- TABLE 288 Japan Custom Software Development Market by End-use, 2018 - 2021, USD Million
- TABLE 289 Japan Custom Software Development Market by End-use, 2022 - 2028, USD Million
- TABLE 290 Japan Custom Software Development Market by Enterprise Size, 2018 - 2021, USD Million
- TABLE 291 Japan Custom Software Development Market by Enterprise Size, 2022 - 2028, USD Million
- TABLE 292 Japan Custom Software Development Market by Deployment, 2018 - 2021, USD Million
- TABLE 293 Japan Custom Software Development Market by Deployment, 2022 - 2028, USD Million
- TABLE 294 India Custom Software Development Market, 2018 - 2021, USD Million
- TABLE 295 India Custom Software Development Market, 2022 - 2028, USD Million
- TABLE 296 India Custom Software Development Market by Solution, 2018 - 2021, USD Million
- TABLE 297 India Custom Software Development Market by Solution, 2022 - 2028, USD Million
- TABLE 298 India Custom Software Development Market by End-use, 2018 - 2021, USD Million
- TABLE 299 India Custom Software Development Market by End-use, 2022 - 2028, USD Million
- TABLE 300 India Custom Software Development Market by Enterprise Size, 2018 - 2021, USD Million
- TABLE 301 India Custom Software Development Market by Enterprise Size, 2022 - 2028, USD Million
- TABLE 302 India Custom Software Development Market by Deployment, 2018 - 2021, USD Million
- TABLE 303 India Custom Software Development Market by Deployment, 2022 - 2028, USD Million
- TABLE 304 South Korea Custom Software Development Market, 2018 - 2021, USD Million
- TABLE 305 South Korea Custom Software Development Market, 2022 - 2028, USD Million
- TABLE 306 South Korea Custom Software Development Market by Solution, 2018 - 2021, USD Million
- TABLE 307 South Korea Custom Software Development Market by Solution, 2022 - 2028, USD Million
- TABLE 308 South Korea Custom Software Development Market by End-use, 2018 - 2021, USD Million
- TABLE 309 South Korea Custom Software Development Market by End-use, 2022 - 2028, USD Million
- TABLE 310 South Korea Custom Software Development Market by Enterprise Size, 2018 - 2021, USD Million
- TABLE 311 South Korea Custom Software Development Market by Enterprise Size, 2022 - 2028, USD Million
- TABLE 312 South Korea Custom Software Development Market by Deployment, 2018 - 2021, USD Million
- TABLE 313 South Korea Custom Software Development Market by Deployment, 2022 - 2028, USD Million
- TABLE 314 Singapore Custom Software Development Market, 2018 - 2021, USD Million
- TABLE 315 Singapore Custom Software Development Market, 2022 - 2028, USD Million
- TABLE 316 Singapore Custom Software Development Market by Solution, 2018 - 2021, USD Million
- TABLE 317 Singapore Custom Software Development Market by Solution, 2022 - 2028, USD Million
- TABLE 318 Singapore Custom Software Development Market by End-use, 2018 - 2021, USD Million
- TABLE 319 Singapore Custom Software Development Market by End-use, 2022 - 2028, USD Million
- TABLE 320 Singapore Custom Software Development Market by Enterprise Size, 2018 - 2021, USD Million
- TABLE 321 Singapore Custom Software Development Market by Enterprise Size, 2022 - 2028, USD Million
- TABLE 322 Singapore Custom Software Development Market by Deployment, 2018 - 2021, USD Million
- TABLE 323 Singapore Custom Software Development Market by Deployment, 2022 - 2028, USD Million
- TABLE 324 Malaysia Custom Software Development Market, 2018 - 2021, USD Million
- TABLE 325 Malaysia Custom Software Development Market, 2022 - 2028, USD Million
- TABLE 326 Malaysia Custom Software Development Market by Solution, 2018 - 2021, USD Million
- TABLE 327 Malaysia Custom Software Development Market by Solution, 2022 - 2028, USD Million
- TABLE 328 Malaysia Custom Software Development Market by End-use, 2018 - 2021, USD Million
- TABLE 329 Malaysia Custom Software Development Market by End-use, 2022 - 2028, USD Million
- TABLE 330 Malaysia Custom Software Development Market by Enterprise Size, 2018 - 2021, USD Million
- TABLE 331 Malaysia Custom Software Development Market by Enterprise Size, 2022 - 2028, USD Million
- TABLE 332 Malaysia Custom Software Development Market by Deployment, 2018 - 2021, USD Million
- TABLE 333 Malaysia Custom Software Development Market by Deployment, 2022 - 2028, USD Million
- TABLE 334 Rest of Asia Pacific Custom Software Development Market, 2018 - 2021, USD Million
- TABLE 335 Rest of Asia Pacific Custom Software Development Market, 2022 - 2028, USD Million
- TABLE 336 Rest of Asia Pacific Custom Software Development Market by Solution, 2018 - 2021, USD Million
- TABLE 337 Rest of Asia Pacific Custom Software Development Market by Solution, 2022 - 2028, USD Million
- TABLE 338 Rest of Asia Pacific Custom Software Development Market by End-use, 2018 - 2021, USD Million
- TABLE 339 Rest of Asia Pacific Custom Software Development Market by End-use, 2022 - 2028, USD Million
- TABLE 340 Rest of Asia Pacific Custom Software Development Market by Enterprise Size, 2018 - 2021, USD Million
- TABLE 341 Rest of Asia Pacific Custom Software Development Market by Enterprise Size, 2022 - 2028, USD Million
- TABLE 342 Rest of Asia Pacific Custom Software Development Market by Deployment, 2018 - 2021, USD Million
- TABLE 343 Rest of Asia Pacific Custom Software Development Market by Deployment, 2022 - 2028, USD Million
- TABLE 344 LAMEA Custom Software Development Market, 2018 - 2021, USD Million
- TABLE 345 LAMEA Custom Software Development Market, 2022 - 2028, USD Million
- TABLE 346 LAMEA Custom Software Development Market by Solution, 2018 - 2021, USD Million
- TABLE 347 LAMEA Custom Software Development Market by Solution, 2022 - 2028, USD Million
- TABLE 348 LAMEA Enterprise Software Market by Country, 2018 - 2021, USD Million
- TABLE 349 LAMEA Enterprise Software Market by Country, 2022 - 2028, USD Million
- TABLE 350 LAMEA Web-based Solutions Market by Country, 2018 - 2021, USD Million
- TABLE 351 LAMEA Web-based Solutions Market by Country, 2022 - 2028, USD Million
- TABLE 352 LAMEA Mobile App Market by Country, 2018 - 2021, USD Million
- TABLE 353 LAMEA Mobile App Market by Country, 2022 - 2028, USD Million
- TABLE 354 LAMEA Custom Software Development Market by End-use, 2018 - 2021, USD Million
- TABLE 355 LAMEA Custom Software Development Market by End-use, 2022 - 2028, USD Million
- TABLE 356 LAMEA BFSI Market by Country, 2018 - 2021, USD Million
- TABLE 357 LAMEA BFSI Market by Country, 2022 - 2028, USD Million
- TABLE 358 LAMEA Manufacturing Market by Country, 2018 - 2021, USD Million
- TABLE 359 LAMEA Manufacturing Market by Country, 2022 - 2028, USD Million
- TABLE 360 LAMEA Government & Defense Market by Country, 2018 - 2021, USD Million
- TABLE 361 LAMEA Government & Defense Market by Country, 2022 - 2028, USD Million
- TABLE 362 LAMEA Telecom & IT Market by Country, 2018 - 2021, USD Million
- TABLE 363 LAMEA Telecom & IT Market by Country, 2022 - 2028, USD Million
- TABLE 364 LAMEA Retail Market by Country, 2018 - 2021, USD Million
- TABLE 365 LAMEA Retail Market by Country, 2022 - 2028, USD Million
- TABLE 366 LAMEA Healthcare Market by Country, 2018 - 2021, USD Million
- TABLE 367 LAMEA Healthcare Market by Country, 2022 - 2028, USD Million
- TABLE 368 LAMEA Other End-use Market by Country, 2018 - 2021, USD Million
- TABLE 369 LAMEA Other End-use Market by Country, 2022 - 2028, USD Million
- TABLE 370 LAMEA Custom Software Development Market by Enterprise Size, 2018 - 2021, USD Million
- TABLE 371 LAMEA Custom Software Development Market by Enterprise Size, 2022 - 2028, USD Million
- TABLE 372 LAMEA Large Enterprises Market by Country, 2018 - 2021, USD Million
- TABLE 373 LAMEA Large Enterprises Market by Country, 2022 - 2028, USD Million
- TABLE 374 LAMEA Small & Medium Enterprises Market by Country, 2018 - 2021, USD Million
- TABLE 375 LAMEA Small & Medium Enterprises Market by Country, 2022 - 2028, USD Million
- TABLE 376 LAMEA Custom Software Development Market by Deployment, 2018 - 2021, USD Million
- TABLE 377 LAMEA Custom Software Development Market by Deployment, 2022 - 2028, USD Million
- TABLE 378 LAMEA Cloud Market by Country, 2018 - 2021, USD Million
- TABLE 379 LAMEA Cloud Market by Country, 2022 - 2028, USD Million
- TABLE 380 LAMEA On-premise Market by Country, 2018 - 2021, USD Million
- TABLE 381 LAMEA On-premise Market by Country, 2022 - 2028, USD Million
- TABLE 382 LAMEA Custom Software Development Market by Country, 2018 - 2021, USD Million
- TABLE 383 LAMEA Custom Software Development Market by Country, 2022 - 2028, USD Million
- TABLE 384 Brazil Custom Software Development Market, 2018 - 2021, USD Million
- TABLE 385 Brazil Custom Software Development Market, 2022 - 2028, USD Million
- TABLE 386 Brazil Custom Software Development Market by Solution, 2018 - 2021, USD Million
- TABLE 387 Brazil Custom Software Development Market by Solution, 2022 - 2028, USD Million
- TABLE 388 Brazil Custom Software Development Market by End-use, 2018 - 2021, USD Million
- TABLE 389 Brazil Custom Software Development Market by End-use, 2022 - 2028, USD Million
- TABLE 390 Brazil Custom Software Development Market by Enterprise Size, 2018 - 2021, USD Million
- TABLE 391 Brazil Custom Software Development Market by Enterprise Size, 2022 - 2028, USD Million
- TABLE 392 Brazil Custom Software Development Market by Deployment, 2018 - 2021, USD Million
- TABLE 393 Brazil Custom Software Development Market by Deployment, 2022 - 2028, USD Million
- TABLE 394 Argentina Custom Software Development Market, 2018 - 2021, USD Million
- TABLE 395 Argentina Custom Software Development Market, 2022 - 2028, USD Million
- TABLE 396 Argentina Custom Software Development Market by Solution, 2018 - 2021, USD Million
- TABLE 397 Argentina Custom Software Development Market by Solution, 2022 - 2028, USD Million
- TABLE 398 Argentina Custom Software Development Market by End-use, 2018 - 2021, USD Million
- TABLE 399 Argentina Custom Software Development Market by End-use, 2022 - 2028, USD Million
- TABLE 400 Argentina Custom Software Development Market by Enterprise Size, 2018 - 2021, USD Million
- TABLE 401 Argentina Custom Software Development Market by Enterprise Size, 2022 - 2028, USD Million
- TABLE 402 Argentina Custom Software Development Market by Deployment, 2018 - 2021, USD Million
- TABLE 403 Argentina Custom Software Development Market by Deployment, 2022 - 2028, USD Million
- TABLE 404 UAE Custom Software Development Market, 2018 - 2021, USD Million
- TABLE 405 UAE Custom Software Development Market, 2022 - 2028, USD Million
- TABLE 406 UAE Custom Software Development Market by Solution, 2018 - 2021, USD Million
- TABLE 407 UAE Custom Software Development Market by Solution, 2022 - 2028, USD Million
- TABLE 408 UAE Custom Software Development Market by End-use, 2018 - 2021, USD Million
- TABLE 409 UAE Custom Software Development Market by End-use, 2022 - 2028, USD Million
- TABLE 410 UAE Custom Software Development Market by Enterprise Size, 2018 - 2021, USD Million
- TABLE 411 UAE Custom Software Development Market by Enterprise Size, 2022 - 2028, USD Million
- TABLE 412 UAE Custom Software Development Market by Deployment, 2018 - 2021, USD Million
- TABLE 413 UAE Custom Software Development Market by Deployment, 2022 - 2028, USD Million
- TABLE 414 Saudi Arabia Custom Software Development Market, 2018 - 2021, USD Million
- TABLE 415 Saudi Arabia Custom Software Development Market, 2022 - 2028, USD Million
- TABLE 416 Saudi Arabia Custom Software Development Market by Solution, 2018 - 2021, USD Million
- TABLE 417 Saudi Arabia Custom Software Development Market by Solution, 2022 - 2028, USD Million
- TABLE 418 Saudi Arabia Custom Software Development Market by End-use, 2018 - 2021, USD Million
- TABLE 419 Saudi Arabia Custom Software Development Market by End-use, 2022 - 2028, USD Million
- TABLE 420 Saudi Arabia Custom Software Development Market by Enterprise Size, 2018 - 2021, USD Million
- TABLE 421 Saudi Arabia Custom Software Development Market by Enterprise Size, 2022 - 2028, USD Million
- TABLE 422 Saudi Arabia Custom Software Development Market by Deployment, 2018 - 2021, USD Million
- TABLE 423 Saudi Arabia Custom Software Development Market by Deployment, 2022 - 2028, USD Million
- TABLE 424 South Africa Custom Software Development Market, 2018 - 2021, USD Million
- TABLE 425 South Africa Custom Software Development Market, 2022 - 2028, USD Million
- TABLE 426 South Africa Custom Software Development Market by Solution, 2018 - 2021, USD Million
- TABLE 427 South Africa Custom Software Development Market by Solution, 2022 - 2028, USD Million
- TABLE 428 South Africa Custom Software Development Market by End-use, 2018 - 2021, USD Million
- TABLE 429 South Africa Custom Software Development Market by End-use, 2022 - 2028, USD Million
- TABLE 430 South Africa Custom Software Development Market by Enterprise Size, 2018 - 2021, USD Million
- TABLE 431 South Africa Custom Software Development Market by Enterprise Size, 2022 - 2028, USD Million
- TABLE 432 South Africa Custom Software Development Market by Deployment, 2018 - 2021, USD Million
- TABLE 433 South Africa Custom Software Development Market by Deployment, 2022 - 2028, USD Million
- TABLE 434 Nigeria Custom Software Development Market, 2018 - 2021, USD Million
- TABLE 435 Nigeria Custom Software Development Market, 2022 - 2028, USD Million
- TABLE 436 Nigeria Custom Software Development Market by Solution, 2018 - 2021, USD Million
- TABLE 437 Nigeria Custom Software Development Market by Solution, 2022 - 2028, USD Million
- TABLE 438 Nigeria Custom Software Development Market by End-use, 2018 - 2021, USD Million
- TABLE 439 Nigeria Custom Software Development Market by End-use, 2022 - 2028, USD Million
- TABLE 440 Nigeria Custom Software Development Market by Enterprise Size, 2018 - 2021, USD Million
- TABLE 441 Nigeria Custom Software Development Market by Enterprise Size, 2022 - 2028, USD Million
- TABLE 442 Nigeria Custom Software Development Market by Deployment, 2018 - 2021, USD Million
- TABLE 443 Nigeria Custom Software Development Market by Deployment, 2022 - 2028, USD Million
- TABLE 444 Rest of LAMEA Custom Software Development Market, 2018 - 2021, USD Million
- TABLE 445 Rest of LAMEA Custom Software Development Market, 2022 - 2028, USD Million
- TABLE 446 Rest of LAMEA Custom Software Development Market by Solution, 2018 - 2021, USD Million
- TABLE 447 Rest of LAMEA Custom Software Development Market by Solution, 2022 - 2028, USD Million
- TABLE 448 Rest of LAMEA Custom Software Development Market by End-use, 2018 - 2021, USD Million
- TABLE 449 Rest of LAMEA Custom Software Development Market by End-use, 2022 - 2028, USD Million
- TABLE 450 Rest of LAMEA Custom Software Development Market by Enterprise Size, 2018 - 2021, USD Million
- TABLE 451 Rest of LAMEA Custom Software Development Market by Enterprise Size, 2022 - 2028, USD Million
- TABLE 452 Rest of LAMEA Custom Software Development Market by Deployment, 2018 - 2021, USD Million
- TABLE 453 Rest of LAMEA Custom Software Development Market by Deployment, 2022 - 2028, USD Million
- TABLE 454 Key Information - Tata Consultancy Services Ltd.
- TABLE 455 Key Information - Infosys Limited
- TABLE 456 Key Information - Capgemini SE
- TABLE 457 Key Information - Infopulse Ukraine LLC
- TABLE 458 Key Information - Magora Systems
- TABLE 459 Key Information - Iflexion
- TABLE 460 Key Information - MentorMate, Inc.
- TABLE 461 Key Information - Trigent Software Inc.
- TABLE 462 Key Information - TRooTech Business Solutions Pvt. Ltd.
- TABLE 463 Key information - Brainvire Infotech Inc.
List of Figures
- FIG 1 Methodology for the research
- FIG 2 KBV Cardinal Matrix
- FIG 3 Key Leading Strategies: Percentage Distribution (2018-2022)
- FIG 4 Global Custom Software Development Market Share by Solution, 2021
- FIG 5 Global Custom Software Development Market Share by Solution, 2028
- FIG 6 Global Custom Software Development Market by Solution, 2018 - 2028, USD Million
- FIG 7 Global Custom Software Development Market Share by End-use, 2021
- FIG 8 Global Custom Software Development Market Share by End-use, 2028
- FIG 9 Global Custom Software Development Market by End-use, 2018 - 2028, USD Million
- FIG 10 Global Custom Software Development Market Share by Enterprise Size, 2021
- FIG 11 Global Custom Software Development Market Share by Enterprise Size, 2028
- FIG 12 Global Custom Software Development Market by Enterprise Size, 2018 - 2028, USD Million
- FIG 13 Global Custom Software Development Market Share by Deployment, 2021
- FIG 14 Global Custom Software Development Market Share by Deployment, 2028
- FIG 15 Global Custom Software Development Market by Deployment, 2018 - 2028, USD Million
- FIG 16 Global Custom Software Development Market Share by Region, 2021
- FIG 17 Global Custom Software Development Market Share by Region, 2028
- FIG 18 Global Custom Software Development Market by Region, 2018 - 2028, USD Million
- FIG 19 Recent strategies and developments: Tata Consultancy Services Ltd.
- FIG 20 SWOT Analysis: Tata Consultancy Services Ltd.
- FIG 21 SWOT Analysis: Infosys Limited
- FIG 22 Recent strategies and developments: Capgemini SE
The Global Custom Software Development Market size is expected to reach $85.9 billion by 2028, rising at a market growth of 20.3% CAGR during the forecast period.
Custom software development is described as a software design application that personalizes the demands of a company or individual. With the advancement in technology, many companies are implementing various security and digital transformation solutions, and as such, the need for custom software development is increasing as these allow a high degree of adaptation.
In addition, the demand for this software is also growing because of factors like the rising need for industrial applications that can facilitate real-time data analysis and the increasing demand for flexible workspace. In addition, the growing adoption of accessible software development platforms like low code development platforms (LCDP) is also inducing a rise in the adoption of custom software development.
It might not be easy to develop software using traditional methods, like manual coding. Businesses needed an entire team wholly dedicated to updating the code, which generally takes 2 to 8 months. LCDP allows teams to build custom software to create more apps faster than they could with traditional coding. In addition, LDCPs are simple to design and develop because of the visual development environment.
Custom software applications are used by industries to promote their brands and increase revenue. These have significantly improved the way businesses are expanding their operations. A growing need for more business-specific software led to a high demand for custom software development solutions. Nowadays, the necessity for custom software development is rising steadily as these help in meeting a variety of organizational objectives.
COVID - 19 Impact Analysis
During the pandemic, many companies had to close, or at the minor limit, their businesses and operations. Consequently, the closing off of many institutions was stabilized by the growth of the online presence. This proved to be true for small as well as many large enterprises. The emergence of online shopping and retailing also influenced many companies to develop and market their applications. As a result, exponential growth was seen in the adoption of software development. The demand rose from all industry verticals, with the most extensive product requirement coming from entertainment and retail verticals for gaming applications and e-stores, respectively.
Market Growth Factors
Increasing deployment of open-source platforms
Open-source platforms are a vital necessity for developing efficient and long-term workable custom software. Open-source software platforms utilize a source code that anyone can modify, inspect, and enhance. Since open-source software is easy to acquire than any proprietary software, it results in the increased use of the software. Enterprises are increasingly using various forms of open-source software as these are highly efficient for crucial solutions.
Rising implementation of AI-enabled chatbots
In the current times, artificial intelligence (AI) is branching out continuously and thus has become an indispensable part of the internet. Most companies now aim to provide virtual assistance on their applications to drive away some of the customer concerns. As a consequence, the use of chatbots has increased significantly. Chatbots are a leading technology in the software development domain and are created to simulate customer support interactions. These have become extremely useful and provide efficient streamlining of customer service.
Market Restraining Factors
Outsourcing of custom software development services
Most companies, when opting for custom software development, tend to offshore it. And many similar incidences have pointed towards increasing difficulties, especially if cultural differences and distance are not taken into account. So, if a company opts for an inexperienced or unreliable outsourcing provider, problems like miscommunication, desynchronization, along with dishonest vendors may arise. This would hinder the work and progress of the work.
Solution Outlook
Based on solution, the custom software development market is categorized into web-based solutions, mobile app, and enterprise software. The web-based solution segment procured a considerable growth rate in the custom software development market in 2021. These solutions are expected to grow owing to the gather real-time data, elimination of the cost of hardware, and ease of remote accessibility. Additionally, the provision of easy data sharing through these solutions, along with the seamless collaboration ability with any centralized software server, have established them as ideal extension solutions for any enterprise.
End-User Outlook
On the basis of end-use, the custom software development market is fragmented into BFSI, government & defense, healthcare, IT & telecom, manufacturing, retail, and others. The IT and telecom segment witnessed a remarkable growth rate in the custom software development market in 2021. When compared to traditional software, IT services and solutions that are customized to meet the customers' requirements offer better flexibility. Custom software provides companies benefits of efficient operations, streamlines reports and updates, and lower licensing costs and lesser maintenance.
Enterprise Size Outlook
Based on enterprise size, the custom software development market is classified into large enterprises and small & medium enterprises (SMEs). The small and medium enterprises segment procured a remarkable growth rate in the custom software development market in 2021. The cost-effectiveness and scalability that the custom software provides to SMEs is the main factor responsible for their increased usage. Custom software helps SMEs in increasing their efficiencies and productivity, thereby enabling the organization to ease the workflow.
Deployment Outlook
On the basis of deployment, the custom software development market is divided into cloud and on-premise. The cloud deployment segment garnered the largest revenue share in the custom software development market in 2021. The beneficial offerings of flexibility, ease of access, and cost-effectiveness that can be utilized by any enterprise, irrespective of its size, are the main factor that is propelling the growth of this segment. Cloud-based services concur no extra costs of infrastructure other than a monthly or annual fees. Therefore, these are highly preferred by small and medium enterprises.
Regional Outlook
Based on region, the custom software development market is analysed across North America, Europe, Asia Pacific, and LAMEA. The North America segment witnessed the largest revenue share in the custom software development market in 2021. The widespread utilization of expertise, the rise of SMEs, and the rise in IT services are propelling the growth of the segment. Moreover, the region is becoming highly preferable to provide custom software development services as the region has advanced technology and digital transformation growth rates.
The major strategies followed by the market participants are Partnerships. Based on the Analysis presented in the Cardinal matrix; Tata Consultancy Services Ltd., Capgemini SE, and Infosys Limited are the forerunners in the Custom Software Development Market. Companies such as Infopulse Ukraine LLC, and Brainvire Infotech, Inc. are some of the key innovators in Custom Software Development Market.
The market research report covers the analysis of key stake holders of the market. Key companies profiled in the report include Tata Consultancy Services Ltd., Infosys Limited, Capgemini SE, Infopulse Ukraine LLC (Tietoevry Corporation), Magora Systems, Iflexion, MentorMate, Inc. (Taylor Corporation), Trigent Software Inc., TRooTech Business Solutions Pvt. Ltd and Brainvire Infotech, Inc.
Strategies deployed in Custom Software Development Market
Nov-2022: Tata Consultancy Services extended its partnership with Randstad, a world-leading HR services company, to modernize the latter's application estate on the cloud, upgrade its growth and transformation journey, and strengthen its security posture. This partnership would strengthen the TCS capabilities in the security portfolio. TCS would enhance Randstad's security posture with onboarding and rolling out global security services.
Oct-2022: Capgemini comes into collaboration with Panasonic Automotive Systems Company of America, a company that develops, produces, and sells automotive products and technologies. This would also allow the latter company to use Capgemini's skills in automotive connectivity and data migration, to complete the project. This collaboration expresses the ability of Capgemini's understand the client's goals and make them a reality.
Feb-2022: Tata Consultancy Services (TCS) unveiled Sydney Digital Garage, providing access to the company's global ecosystem of start-ups, academia, and technology providers. The collaboration and innovation center would bring global capabilities to the Australian market, that help customers in New Zealand and Australia to support co-innovation and accelerate digital transformation.
Jun-2021: Infopulse Ukraine LLC expanded its business with the launch of an entity, Infopulse Brazil. This is the first launch in Brazil and focuses on extending the offering to a wider spectrum of industries. The team holds the experience and knowledge to evolve and launch modernized legacy technology, cloud migrations, and new solutions, and enhance the speed of innovation while ensuring high security and compliance standards.
Jun-2021: Capgemini announced the launch of a new Sustainable IT offering that is built to reduce the IT carbon footprint of the clients. The group helps clients on the sustainability journey with its technical expertise, strong partner ecosystem, and customized approach. Sustainable IT would strengthen Capgemini's global sustainability offering framework and provides diagnostic and qualitative tools that allow baseline business approaches to sustainable practice.
May-2021: Brainvire Infotech announced a partnership with Salesforce Inc, an American cloud-based software company, to deliver a market-leading customer experience. Brainvire would expand the digital space team of Salesforce to enlarge its offering. This partnership with the world's leading Customer Relationship Management platform would be beneficial for the Brainvire team's skill and accuracy.
Feb-2021: Tata Consultancy Services in collaboration with Amazon Web Services (AWS) launched the new TCS AWS Business Unit (BU), a group within TCS that would bring jointly the scale, industry knowledge, and technology expertise of the two companies to support enterprise customers to drive superior and strengthen innovation. The new unit would assist Enterprises to build resilience, enhance customer experience, and embrace new business models.
Nov-2020: Zoho announced a partnership with Tata Consultancy Services (TCS), to supply superior Customer Relationship Management, e-Commerce solutions, and IT Service Management to solve problems for large businesses. As a part of the partnership, Zoho's product portfolio would be brought together with TCS domain expertise in technology-led consulting and business integration services, which would strengthen growth for global organizations with stronger technology alignment with business goals, and greater operational and more transparency across solutions efficiency.
Oct-2020: Capgemini came into agreement with CBS (Corporate Business Solutions), provider of business consulting and services, to deliver Selective Data Transition. The solution aims to support enterprises that moved to SAP S/4HANA®, more efficiently and quickly with reduced business disruption. Under this agreement, CBS's expertise would be combined with Renewable Enterprise's vision to provide a more business-oriented and agile way of becoming intelligent enterprises to the organizations.
Feb-2020: Infosys partnered with GE Appliance, an American home appliance manufacturer, to successfully streamline IT operations. Under the partnership, Infosys would enable GE Appliances to advance workplace and digital transformation with automation-driven managed IT services. This would strengthen Infosys's digital efforts, work, workplace, and workforce transformation throughout industries.
Scope of the Study
Market Segments covered in the Report:
By Solution
- Enterprise Software
- Web-based Solutions
- Mobile App
By End User
- BFSI
- Manufacturing
- Government & Defense
- Telecom & IT
- Retail
- Healthcare
- Others
By Enterprise Size
- Large Enterprises
- Small & Medium Enterprises
By Deployment
- Cloud
- On-premise
By Geography
- North America
- US
- Canada
- Mexico
- Rest of North America
- Europe
- Germany
- UK
- France
- Russia
- Spain
- Italy
- Rest of Europe
- Asia Pacific
- China
- Japan
- India
- South Korea
- Singapore
- Malaysia
- Rest of Asia Pacific
- LAMEA
- Brazil
- Argentina
- UAE
- Saudi Arabia
- South Africa
- Nigeria
- Rest of LAMEA
Companies Profiled
- Tata Consultancy Services Ltd.
- Infosys Limited
- Capgemini SE
- Infopulse Ukraine LLC (Tietoevry Corporation)
- Magora Systems
- Iflexion
- MentorMate, Inc. (Taylor Corporation)
- Trigent Software Inc.
- TRooTech Business Solutions Pvt. Ltd
- Brainvire Infotech, Inc.
Unique Offerings from KBV Research
- Exhaustive coverage
- Highest number of market tables and figures
- Subscription based model available
- Guaranteed best price
- Assured post sales research support with 10% customization free
Table of Contents
Chapter 1. Market Scope & Methodology
- 1.1 Market Definition
- 1.2 Objectives
- 1.3 Market Scope
- 1.4 Segmentation
- 1.4.1 Global Custom Software Development Market, by Solution
- 1.4.2 Global Custom Software Development Market, by End User
- 1.4.3 Global Custom Software Development Market, by Enterprise Size
- 1.4.4 Global Custom Software Development Market, by Deployment
- 1.4.5 Global Custom Software Development Market, by Geography
- 1.5 Methodology for the research
Chapter 2. Market Overview
- 2.1 Introduction
- 2.1.1 Overview
- 2.1.1.1 Market Composition and Scenario
- 2.1.1 Overview
- 2.2 Key Factors Impacting the Market
- 2.2.1 Market Drivers
- 2.2.2 Market Restraints
Chapter 3. Competition Analysis - Global
- 3.1 KBV Cardinal Matrix
- 3.2 Recent Industry Wide Strategic Developments
- 3.2.1 Partnerships, Collaborations, and Agreements
- 3.2.2 Product Launches and Product Expansions
- 3.2.3 Geographical Expansions
- 3.3 Top Winning Strategies
- 3.3.1 Key Leading Strategies: Percentage Distribution (2018-2022)
Chapter 4. Global Custom Software Development Market by Solution
- 4.1 Global Enterprise Software Market by Region
- 4.2 Global Web-based Solutions Market by Region
- 4.3 Global Mobile App Market by Region
Chapter 5. Global Custom Software Development Market by End-use
- 5.1 Global BFSI Market by Region
- 5.2 Global Manufacturing Market by Region
- 5.3 Global Government & Defense Market by Region
- 5.4 Global Telecom & IT Market by Region
- 5.5 Global Retail Market by Region
- 5.6 Global Healthcare Market by Region
- 5.7 Global Other End-use Market by Region
Chapter 6. Global Custom Software Development Market by Enterprise Size
- 6.1 Global Large Enterprises Market by Region
- 6.2 Global Small & Medium Enterprises Market by Region
Chapter 7. Global Custom Software Development Market by Deployment
- 7.1 Global Cloud Market by Region
- 7.2 Global On-premise Market by Region
Chapter 8. Global Custom Software Development Market by Region
- 8.1 North America Custom Software Development Market
- 8.1.1 North America Custom Software Development Market by Solution
- 8.1.1.1 North America Enterprise Software Market by Country
- 8.1.1.2 North America Web-based Solutions Market by Country
- 8.1.1.3 North America Mobile App Market by Country
- 8.1.2 North America Custom Software Development Market by End-use
- 8.1.2.1 North America BFSI Market by Country
- 8.1.2.2 North America Manufacturing Market by Country
- 8.1.2.3 North America Government & Defense Market by Country
- 8.1.2.4 North America Telecom & IT Market by Country
- 8.1.2.5 North America Retail Market by Country
- 8.1.2.6 North America Healthcare Market by Country
- 8.1.2.7 North America Other End-use Market by Country
- 8.1.3 North America Custom Software Development Market by Enterprise Size
- 8.1.3.1 North America Large Enterprises Market by Country
- 8.1.3.2 North America Small & Medium Enterprises Market by Country
- 8.1.4 North America Custom Software Development Market by Deployment
- 8.1.4.1 North America Cloud Market by Country
- 8.1.4.2 North America On-premise Market by Country
- 8.1.5 North America Custom Software Development Market by Country
- 8.1.5.1 US Custom Software Development Market
- 8.1.5.1.1 US Custom Software Development Market by Solution
- 8.1.5.1.2 US Custom Software Development Market by End-use
- 8.1.5.1.3 US Custom Software Development Market by Enterprise Size
- 8.1.5.1.4 US Custom Software Development Market by Deployment
- 8.1.5.2 Canada Custom Software Development Market
- 8.1.5.2.1 Canada Custom Software Development Market by Solution
- 8.1.5.2.2 Canada Custom Software Development Market by End-use
- 8.1.5.2.3 Canada Custom Software Development Market by Enterprise Size
- 8.1.5.2.4 Canada Custom Software Development Market by Deployment
- 8.1.5.3 Mexico Custom Software Development Market
- 8.1.5.3.1 Mexico Custom Software Development Market by Solution
- 8.1.5.3.2 Mexico Custom Software Development Market by End-use
- 8.1.5.3.3 Mexico Custom Software Development Market by Enterprise Size
- 8.1.5.3.4 Mexico Custom Software Development Market by Deployment
- 8.1.5.4 Rest of North America Custom Software Development Market
- 8.1.5.4.1 Rest of North America Custom Software Development Market by Solution
- 8.1.5.4.2 Rest of North America Custom Software Development Market by End-use
- 8.1.5.4.3 Rest of North America Custom Software Development Market by Enterprise Size
- 8.1.5.4.4 Rest of North America Custom Software Development Market by Deployment
- 8.1.5.1 US Custom Software Development Market
- 8.1.1 North America Custom Software Development Market by Solution
- 8.2 Europe Custom Software Development Market
- 8.2.1 Europe Custom Software Development Market by Solution
- 8.2.1.1 Europe Enterprise Software Market by Country
- 8.2.1.2 Europe Web-based Solutions Market by Country
- 8.2.1.3 Europe Mobile App Market by Country
- 8.2.2 Europe Custom Software Development Market by End-use
- 8.2.2.1 Europe BFSI Market by Country
- 8.2.2.2 Europe Manufacturing Market by Country
- 8.2.2.3 Europe Government & Defense Market by Country
- 8.2.2.4 Europe Telecom & IT Market by Country
- 8.2.2.5 Europe Retail Market by Country
- 8.2.2.6 Europe Healthcare Market by Country
- 8.2.2.7 Europe Other End-use Market by Country
- 8.2.3 Europe Custom Software Development Market by Enterprise Size
- 8.2.3.1 Europe Large Enterprises Market by Country
- 8.2.3.2 Europe Small & Medium Enterprises Market by Country
- 8.2.4 Europe Custom Software Development Market by Deployment
- 8.2.4.1 Europe Cloud Market by Country
- 8.2.4.2 Europe On-premise Market by Country
- 8.2.5 Europe Custom Software Development Market by Country
- 8.2.5.1 Germany Custom Software Development Market
- 8.2.5.1.1 Germany Custom Software Development Market by Solution
- 8.2.5.1.2 Germany Custom Software Development Market by End-use
- 8.2.5.1.3 Germany Custom Software Development Market by Enterprise Size
- 8.2.5.1.4 Germany Custom Software Development Market by Deployment
- 8.2.5.2 UK Custom Software Development Market
- 8.2.5.2.1 UK Custom Software Development Market by Solution
- 8.2.5.2.2 UK Custom Software Development Market by End-use
- 8.2.5.2.3 UK Custom Software Development Market by Enterprise Size
- 8.2.5.2.4 UK Custom Software Development Market by Deployment
- 8.2.5.3 France Custom Software Development Market
- 8.2.5.3.1 France Custom Software Development Market by Solution
- 8.2.5.3.2 France Custom Software Development Market by End-use
- 8.2.5.3.3 France Custom Software Development Market by Enterprise Size
- 8.2.5.3.4 France Custom Software Development Market by Deployment
- 8.2.5.4 Russia Custom Software Development Market
- 8.2.5.4.1 Russia Custom Software Development Market by Solution
- 8.2.5.4.2 Russia Custom Software Development Market by End-use
- 8.2.5.4.3 Russia Custom Software Development Market by Enterprise Size
- 8.2.5.4.4 Russia Custom Software Development Market by Deployment
- 8.2.5.5 Spain Custom Software Development Market
- 8.2.5.5.1 Spain Custom Software Development Market by Solution
- 8.2.5.5.2 Spain Custom Software Development Market by End-use
- 8.2.5.5.3 Spain Custom Software Development Market by Enterprise Size
- 8.2.5.5.4 Spain Custom Software Development Market by Deployment
- 8.2.5.6 Italy Custom Software Development Market
- 8.2.5.6.1 Italy Custom Software Development Market by Solution
- 8.2.5.6.2 Italy Custom Software Development Market by End-use
- 8.2.5.6.3 Italy Custom Software Development Market by Enterprise Size
- 8.2.5.6.4 Italy Custom Software Development Market by Deployment
- 8.2.5.7 Rest of Europe Custom Software Development Market
- 8.2.5.7.1 Rest of Europe Custom Software Development Market by Solution
- 8.2.5.7.2 Rest of Europe Custom Software Development Market by End-use
- 8.2.5.7.3 Rest of Europe Custom Software Development Market by Enterprise Size
- 8.2.5.7.4 Rest of Europe Custom Software Development Market by Deployment
- 8.2.5.1 Germany Custom Software Development Market
- 8.2.1 Europe Custom Software Development Market by Solution
- 8.3 Asia Pacific Custom Software Development Market
- 8.3.1 Asia Pacific Custom Software Development Market by Solution
- 8.3.1.1 Asia Pacific Enterprise Software Market by Country
- 8.3.1.2 Asia Pacific Web-based Solutions Market by Country
- 8.3.1.3 Asia Pacific Mobile App Market by Country
- 8.3.2 Asia Pacific Custom Software Development Market by End-use
- 8.3.2.1 Asia Pacific BFSI Market by Country
- 8.3.2.2 Asia Pacific Manufacturing Market by Country
- 8.3.2.3 Asia Pacific Government & Defense Market by Country
- 8.3.2.4 Asia Pacific Telecom & IT Market by Country
- 8.3.2.5 Asia Pacific Retail Market by Country
- 8.3.2.6 Asia Pacific Healthcare Market by Country
- 8.3.2.7 Asia Pacific Other End-use Market by Country
- 8.3.3 Asia Pacific Custom Software Development Market by Enterprise Size
- 8.3.3.1 Asia Pacific Large Enterprises Market by Country
- 8.3.3.2 Asia Pacific Small & Medium Enterprises Market by Country
- 8.3.4 Asia Pacific Custom Software Development Market by Deployment
- 8.3.4.1 Asia Pacific Cloud Market by Country
- 8.3.4.2 Asia Pacific On-premise Market by Country
- 8.3.5 Asia Pacific Custom Software Development Market by Country
- 8.3.5.1 China Custom Software Development Market
- 8.3.5.1.1 China Custom Software Development Market by Solution
- 8.3.5.1.2 China Custom Software Development Market by End-use
- 8.3.5.1.3 China Custom Software Development Market by Enterprise Size
- 8.3.5.1.4 China Custom Software Development Market by Deployment
- 8.3.5.2 Japan Custom Software Development Market
- 8.3.5.2.1 Japan Custom Software Development Market by Solution
- 8.3.5.2.2 Japan Custom Software Development Market by End-use
- 8.3.5.2.3 Japan Custom Software Development Market by Enterprise Size
- 8.3.5.2.4 Japan Custom Software Development Market by Deployment
- 8.3.5.3 India Custom Software Development Market
- 8.3.5.3.1 India Custom Software Development Market by Solution
- 8.3.5.3.2 India Custom Software Development Market by End-use
- 8.3.5.3.3 India Custom Software Development Market by Enterprise Size
- 8.3.5.3.4 India Custom Software Development Market by Deployment
- 8.3.5.4 South Korea Custom Software Development Market
- 8.3.5.4.1 South Korea Custom Software Development Market by Solution
- 8.3.5.4.2 South Korea Custom Software Development Market by End-use
- 8.3.5.4.3 South Korea Custom Software Development Market by Enterprise Size
- 8.3.5.4.4 South Korea Custom Software Development Market by Deployment
- 8.3.5.5 Singapore Custom Software Development Market
- 8.3.5.5.1 Singapore Custom Software Development Market by Solution
- 8.3.5.5.2 Singapore Custom Software Development Market by End-use
- 8.3.5.5.3 Singapore Custom Software Development Market by Enterprise Size
- 8.3.5.5.4 Singapore Custom Software Development Market by Deployment
- 8.3.5.6 Malaysia Custom Software Development Market
- 8.3.5.6.1 Malaysia Custom Software Development Market by Solution
- 8.3.5.6.2 Malaysia Custom Software Development Market by End-use
- 8.3.5.6.3 Malaysia Custom Software Development Market by Enterprise Size
- 8.3.5.6.4 Malaysia Custom Software Development Market by Deployment
- 8.3.5.7 Rest of Asia Pacific Custom Software Development Market
- 8.3.5.7.1 Rest of Asia Pacific Custom Software Development Market by Solution
- 8.3.5.7.2 Rest of Asia Pacific Custom Software Development Market by End-use
- 8.3.5.7.3 Rest of Asia Pacific Custom Software Development Market by Enterprise Size
- 8.3.5.7.4 Rest of Asia Pacific Custom Software Development Market by Deployment
- 8.3.5.1 China Custom Software Development Market
- 8.3.1 Asia Pacific Custom Software Development Market by Solution
- 8.4 LAMEA Custom Software Development Market
- 8.4.1 LAMEA Custom Software Development Market by Solution
- 8.4.1.1 LAMEA Enterprise Software Market by Country
- 8.4.1.2 LAMEA Web-based Solutions Market by Country
- 8.4.1.3 LAMEA Mobile App Market by Country
- 8.4.2 LAMEA Custom Software Development Market by End-use
- 8.4.2.1 LAMEA BFSI Market by Country
- 8.4.2.2 LAMEA Manufacturing Market by Country
- 8.4.2.3 LAMEA Government & Defense Market by Country
- 8.4.2.4 LAMEA Telecom & IT Market by Country
- 8.4.2.5 LAMEA Retail Market by Country
- 8.4.2.6 LAMEA Healthcare Market by Country
- 8.4.2.7 LAMEA Other End-use Market by Country
- 8.4.3 LAMEA Custom Software Development Market by Enterprise Size
- 8.4.3.1 LAMEA Large Enterprises Market by Country
- 8.4.3.2 LAMEA Small & Medium Enterprises Market by Country
- 8.4.4 LAMEA Custom Software Development Market by Deployment
- 8.4.4.1 LAMEA Cloud Market by Country
- 8.4.4.2 LAMEA On-premise Market by Country
- 8.4.5 LAMEA Custom Software Development Market by Country
- 8.4.5.1 Brazil Custom Software Development Market
- 8.4.5.1.1 Brazil Custom Software Development Market by Solution
- 8.4.5.1.2 Brazil Custom Software Development Market by End-use
- 8.4.5.1.3 Brazil Custom Software Development Market by Enterprise Size
- 8.4.5.1.4 Brazil Custom Software Development Market by Deployment
- 8.4.5.2 Argentina Custom Software Development Market
- 8.4.5.2.1 Argentina Custom Software Development Market by Solution
- 8.4.5.2.2 Argentina Custom Software Development Market by End-use
- 8.4.5.2.3 Argentina Custom Software Development Market by Enterprise Size
- 8.4.5.2.4 Argentina Custom Software Development Market by Deployment
- 8.4.5.3 UAE Custom Software Development Market
- 8.4.5.3.1 UAE Custom Software Development Market by Solution
- 8.4.5.3.2 UAE Custom Software Development Market by End-use
- 8.4.5.3.3 UAE Custom Software Development Market by Enterprise Size
- 8.4.5.3.4 UAE Custom Software Development Market by Deployment
- 8.4.5.4 Saudi Arabia Custom Software Development Market
- 8.4.5.4.1 Saudi Arabia Custom Software Development Market by Solution
- 8.4.5.4.2 Saudi Arabia Custom Software Development Market by End-use
- 8.4.5.4.3 Saudi Arabia Custom Software Development Market by Enterprise Size
- 8.4.5.4.4 Saudi Arabia Custom Software Development Market by Deployment
- 8.4.5.5 South Africa Custom Software Development Market
- 8.4.5.5.1 South Africa Custom Software Development Market by Solution
- 8.4.5.5.2 South Africa Custom Software Development Market by End-use
- 8.4.5.5.3 South Africa Custom Software Development Market by Enterprise Size
- 8.4.5.5.4 South Africa Custom Software Development Market by Deployment
- 8.4.5.6 Nigeria Custom Software Development Market
- 8.4.5.6.1 Nigeria Custom Software Development Market by Solution
- 8.4.5.6.2 Nigeria Custom Software Development Market by End-use
- 8.4.5.6.3 Nigeria Custom Software Development Market by Enterprise Size
- 8.4.5.6.4 Nigeria Custom Software Development Market by Deployment
- 8.4.5.7 Rest of LAMEA Custom Software Development Market
- 8.4.5.7.1 Rest of LAMEA Custom Software Development Market by Solution
- 8.4.5.7.2 Rest of LAMEA Custom Software Development Market by End-use
- 8.4.5.7.3 Rest of LAMEA Custom Software Development Market by Enterprise Size
- 8.4.5.7.4 Rest of LAMEA Custom Software Development Market by Deployment
- 8.4.5.1 Brazil Custom Software Development Market
- 8.4.1 LAMEA Custom Software Development Market by Solution
Chapter 9. Company Profiles
- 9.1 Tata Consultancy Services Ltd.
- 9.1.1 Company Overview
- 9.1.2 Financial Analysis
- 9.1.3 Segmental and Regional Analysis
- 9.1.4 Research & Development Expenses
- 9.1.5 Recent strategies and developments:
- 9.1.5.1 Partnerships, Collaborations, and Agreements:
- 9.1.5.2 Geographical Expansions:
- 9.1.6 SWOT Analysis
- 9.2 Infosys Limited
- 9.2.1 Company Overview
- 9.2.2 Financial Analysis
- 9.2.3 Segmental and Regional Analysis
- 9.2.4 Research & Development Expense
- 9.2.5 Recent strategies and developments:
- 9.2.5.1 Partnerships, Collaborations, and Agreements:
- 9.2.6 SWOT Analysis
- 9.3 Capgemini SE
- 9.3.1 Company Overview
- 9.3.2 Financial Analysis
- 9.3.3 Regional Analysis
- 9.3.4 Recent strategies and developments:
- 9.3.4.1 Partnerships, Collaborations, and Agreements:
- 9.3.4.2 Product Launches and Product Expansions:
- 9.4 Infopulse Ukraine LLC (Tietoevry Corporation)
- 9.4.1 Company Overview
- 9.4.2 Financial Analysis
- 9.4.3 Segmental and Regional Analysis
- 9.4.4 Recent strategies and developments:
- 9.4.4.1 Geographical Expansions:
- 9.5 Magora Systems
- 9.5.1 Company Overview
- 9.6 Iflexion
- 9.6.1 Company Overview
- 9.7 MentorMate, Inc. (Taylor Corporation)
- 9.7.1 Company Overview
- 9.8 Trigent Software Inc.
- 9.8.1 Company Overview
- 9.9 TRooTech Business Solutions Pvt. Ltd.
- 9.9.1 Company Overview
- 9.10. Brainvire Infotech, Inc.
- 9.10.1 Company Overview
- 9.10.2 Recent strategies and developments:
- 9.10.2.1 Partnerships, Collaborations, and Agreements: