|
|
市場調査レポート
商品コード
1154862
ゴム手袋の世界市場規模・シェア・産業動向分析レポート:製品別、素材別、タイプ別(粉末・粉末なし)、流通チャネル別(オフライン・オンライン)、最終用途別、地域別展望・予測、2022年~2028年Global Rubber Gloves Market Size, Share & Industry Trends Analysis Report By Product, By Material, By Type (Powdered and Powder-free), By Distribution Channel (Offline and Online), By End-use, By Regional Outlook and Forecast, 2022 - 2028 |
||||||
|
|
|||||||


| ゴム手袋の世界市場規模・シェア・産業動向分析レポート:製品別、素材別、タイプ別(粉末・粉末なし)、流通チャネル別(オフライン・オンライン)、最終用途別、地域別展望・予測、2022年~2028年 |
|
出版日: 2022年10月31日
発行: KBV Research
ページ情報: 英文 299 Pages
納期: 即納可能
|
- 全表示
- 概要
- 図表
- 目次
ゴム手袋の世界市場規模は、予測期間中にCAGR3.5%で成長し、2028年には164億米ドルに達すると予測されています。
ジョンズ・ホプキンス病院の初代外科医長であるウィリアム・スチュワート・ハルステッドは、1894年に妻のキャロライン・ハンプトンのためにゴム手袋を設計しました。これは、彼女が毎日行った手術によって手が影響を受けることを観察し、医療従事者が手術用化学薬品によって皮膚炎を起こすのを防ぐためのものでした。1965年には、Ansell Rubber Co.Pty.Ltd.が開発しました。
1960年代以降、ゴム手袋は食器洗いや家の掃除に使われるようになっています。伝統的な手袋は黄色やピンクで袖口が長く、様々なスタイルや色合いで製造されてきました。今でも最も人気のあるスタイルであっても、ユーザーは手首から肩までの長さの手袋を手に入れることができます。また、ブラウスやボディスーツにあらかじめ取り付けられている保護手袋もあります。
COVID-19影響度分析
コロナウイルスの深刻な影響はすでに明らかであり、2020年のゴム手袋の市場に影響を与えています。2019年12月、世界保健機関はCOVID-19ウイルスの大流行により公衆衛生上の緊急事態を発令しました。このパンデミックは100カ国以上に広がり、全世界で数百万人の死者を出しています。輸出入、世界の製造業、観光業、金融業界はすべて大きな被害を受けました。COVID-19の大流行により、産業用手袋の売上が減少しています。世界中のさまざまな工業用製造企業が、封鎖による部品や機器の供給途絶のために生産を停止したため、パンデミック中の工業用手袋のニーズが低下しています。
市場の成長要因
ヘルスケア産業やその他の医療用途での需要増加
ゴム手袋は、患者や医療従事者の感染を防ぐため、ヘルスケア産業で多く使用されています。ゴム手袋は、患者や医療従事者の感染を防ぐため、医療現場で多く使用されており、市場に対する影響力が大きい産業です。ラテックスは天然ゴムから作られ、ニトリルは合成ゴムで、バクテリア、病原菌、その他の環境汚染物質から手を保護します。また、ニトリルは化学処理や除菌液にも使用されています。医師をはじめとする医療従事者の大多数は、ラテックス製またはニトリル製のゴム手袋を好んで使用しています。
消費者の間で高まる衛生基準
世界の大流行の結果、ゴム手袋、マスク、その他の個人用保護具(PPE)など、衛生やボディケア用品に関する意識が高まり、ゴム手袋の売上が増加しました。例えば、ゴム手袋の生産で業界をリードするThe Top Gloves Corporationは成長するだろうし、今後数年間でもたらされる金額を倍増させると約束しました。その結果、ゴム手袋の市場における生産者には新たな展望が開けてきました。
市場の抑制要因
ニトリルゴム手袋は触覚感度が低く、潜在的に成長を阻害する可能性があります。
ニトリルゴムは、世界中で見つかった最も人気のあるアプリケーションの中にランクされている合成ゴムのまだ別のタイプです。第二次世界大戦中の需要から、その解決策として誕生しました。石油・ガスや化学物質への耐性が求められる用途では、最も典型的な採用例です。このような特性から、自動車分野や実験室、調理場などで非常に重宝されています。日常的に使用される機械や用途に幅広く使用されている可能性があります。
製品の展望
ゴム手袋市場は、製品別に使い捨てと耐久型に分類されます。2021年のゴム手袋市場では、使い捨てのセグメントが最も高い収益シェアを獲得しています。医療や食品加工分野の作業者は、異なる作業で何組もの手袋を使用しなければならず、使い捨て手袋は1回限りの使用に設計されており経済的であるため、使い捨て手袋の需要が高いと予想されるからです。COVID-19の大流行により、2020年には使い捨て手袋などの個人用保護具(PPE)アイテムのニーズが劇的に高まっています。
素材別の展望
ゴム手袋市場は、素材別に天然ゴム/ラテックス、ニトリル、ネオプレン、その他に分類されます。ネオプレンセグメントは、2021年のゴム手袋市場で大きな収益シェアを示しました。これは、ネオプレンベースの手袋は伸縮に対する抵抗力が強く、その結果、優れたフィット感とグリップ力を発揮するためです。これらの要因から、食品調理従事者、実験室職員、医療従事者の間で需要が高まると予想されます。ゴム手袋には、ブチルゴムのほか、イソプレンゴム、クロロプレン、シリコーンゴム、ブチルゴムなどが使用できます。
タイプの展望
ゴム手袋市場は、タイプ別に、パウダータイプとパウダーフリータイプに分けられます。パウダーセグメントは、2021年にゴム手袋市場でかなりの収益シェアを記録しました。パウダーは、手袋の着脱を容易にし、グリップ力を向上させ、汗や湿気を軽減するため、増加します。炭酸カルシウムとコーンスターチが最も頻繁に使用される粉末です。あらゆる種類の皮膚感染を避けるため、保健当局は手袋への粉末の使用に様々な制限を課しており、米国の食品医薬品局を含むいくつかの機関によって制限されています。
流通経路の展望
ゴム手袋市場は、流通チャネルによってオンラインとオフラインに二分されます。オンラインセグメントは、2021年のゴム手袋市場においてかなりの収益シェアを示しました。しかし、世界のCOVID-19の大流行の結果、いくつかの国の政府が厳しいロックダウンを実施し、顧客が屋内にとどまったため、オンラインチャネルの採用率が劇的に増加しました。パンデミックの間、インターネット企業は供給ネットワークの拡大、低い配送コストの維持、スケールメリットの達成に懸命に取り組みました。
最終用途の展望
ゴム手袋市場は、最終用途別に、医療・ヘルスケア、自動車、石油・ガス、飲食品、金属・機械、化学・石油化学、医薬品、クリーンルーム、その他に分類されます。2021年のゴム手袋市場では、食品&飲料分野が大きな収益シェアを記録しました。手袋の使用は、食品との素手での接触を減らすために頻繁に行われる方法です。手袋は、食品事業において最も一般的に利用される個人用保護具の一つです。ほぼすべてのフードサービスおよび食品加工施設は、現場に手袋を備えています。手袋の多くは、手から食品、食品から表面への接触を防ぐために設計された1枚だけの手袋となります。
地域別の展望
ゴム手袋市場は地域別に見ると、北米、欧州、アジア太平洋、LAMEAで分析されています。2021年のゴム手袋市場では、欧州セグメントが最大の収益シェアを獲得しました。飲食品、金属製造、石油・ガス、自動車、化学産業における保護手袋のニーズが高まっているため、同地域ではゴム手袋の需要が高まっています。また、ドイツやイタリアなどの国々ではCOVID-19が急速に広まっているため、医療用手袋の需要が急増しています。感染症や伝染病予防の重要性に対する国民の意識が高まっていることが、北米における医療・ヘルスケア支出の増加の要因であると考えられます。
目次
第1章 市場の範囲と調査手法
- 市場の定義
- 目的
- 市場規模
- セグメンテーション
- ゴム手袋の世界市場、製品別
- ゴム手袋の世界市場、素材別
- ゴム手袋の世界市場、タイプ別
- ゴム手袋の世界市場、流通経路別
- ゴム手袋の世界市場、エンドユース別
- ゴム手袋の世界市場、地域別
- 調査手法
第2章 市場概要
- イントロダクション
- 概要説明
- 市場の構成とシナリオ
- 概要説明
- 市場に影響を与える主な要因
- 市場促進要因
- 市場抑制要因
第3章 ゴム手袋市場で展開されている戦略
第4章 ゴム手袋の世界市場:製品別
- 使い捨ての世界市場:地域別
- 耐久性の高い世界市場:地域別
第5章 ゴム手袋の世界市場:素材別
- 天然ゴム/ラテックスの世界市場:地域別
- ニトリルの世界市場:地域別
- ネオプレンの世界市場:地域別
- 世界の地域別その他市場
第6章 ゴム手袋の世界市場:タイプ別
- パウダーの世界市場:地域別
- パウダーフリーの世界市場:地域別
第7章 ゴム手袋の世界市場:流通チャネル別
- オフラインの世界市場:地域別
- 世界のオンライン市場:地域別
第8章 ゴム手袋の世界市場:エンドユース別
- 医療・ヘルスケアの世界市場:地域別
- 自動車用手袋の世界市場:地域別
- 化学・石油化学の世界市場:地域別
- 金属・機械の世界市場:地域別
- 石油・ガスの地域別世界市場
- 医薬品の世界市場:地域別
- クリーンルームの世界市場:地域別
- 飲食品の世界市場:地域別
- その他の世界市場:地域別
第9章 ゴム手袋の世界市場:地域別
- 北米
- 北米のゴム手袋市場:国別
- 米国
- カナダ
- メキシコ
- その他北米地域
- 北米のゴム手袋市場:国別
- 欧州
- 欧州のゴム手袋市場:国別
- ドイツ
- 英国
- フランス
- ロシア
- スペイン
- イタリア
- その他欧州
- 欧州のゴム手袋市場:国別
- アジア太平洋地域
- アジア太平洋地域のゴム手袋市場:国別
- 中国
- 日本
- インド
- 韓国
- シンガポール
- マレーシア
- その他アジア太平洋地域
- アジア太平洋地域のゴム手袋市場:国別
- LAMEA
- LAMEAのゴム手袋市場:国別
- ブラジル
- アルゼンチン
- UAE
- サウジアラビア
- 南アフリカ共和国
- ナイジェリア
- LAMEAの他の地域
- LAMEAのゴム手袋市場:国別
第10章 企業プロファイル
- Ansell Ltd.
- Kimberly-Clark Corporation
- Unigloves(UK)Limited
- MCR Safety
- Top Glove Corporation Bhd
- Hartalega Holdings Berhad
- The Glove Company
- Mapa Professional(Newell Brands, Inc.)
- Adenna LLC
- Atlantic Safety Products, Inc.
LIST OF TABLES
- TABLE 1 Global Rubber Gloves Market, 2018 - 2021, USD Million
- TABLE 2 Global Rubber Gloves Market, 2022 - 2028, USD Million
- TABLE 3 Global Rubber Gloves Market by Product, 2018 - 2021, USD Million
- TABLE 4 Global Rubber Gloves Market by Product, 2022 - 2028, USD Million
- TABLE 5 Global Disposable Market by Region, 2018 - 2021, USD Million
- TABLE 6 Global Disposable Market by Region, 2022 - 2028, USD Million
- TABLE 7 Global Durable Market by Region, 2018 - 2021, USD Million
- TABLE 8 Global Durable Market by Region, 2022 - 2028, USD Million
- TABLE 9 Global Rubber Gloves Market by Material, 2018 - 2021, USD Million
- TABLE 10 Global Rubber Gloves Market by Material, 2022 - 2028, USD Million
- TABLE 11 Global Natural Rubber/Latex Market by Region, 2018 - 2021, USD Million
- TABLE 12 Global Natural Rubber/Latex Market by Region, 2022 - 2028, USD Million
- TABLE 13 Global Nitrile Market by Region, 2018 - 2021, USD Million
- TABLE 14 Global Nitrile Market by Region, 2022 - 2028, USD Million
- TABLE 15 Global Neoprene Market by Region, 2018 - 2021, USD Million
- TABLE 16 Global Neoprene Market by Region, 2022 - 2028, USD Million
- TABLE 17 Global Others Market by Region, 2018 - 2021, USD Million
- TABLE 18 Global Others Market by Region, 2022 - 2028, USD Million
- TABLE 19 Global Rubber Gloves Market by Type, 2018 - 2021, USD Million
- TABLE 20 Global Rubber Gloves Market by Type, 2022 - 2028, USD Million
- TABLE 21 Global Powdered Market by Region, 2018 - 2021, USD Million
- TABLE 22 Global Powdered Market by Region, 2022 - 2028, USD Million
- TABLE 23 Global Powder-free Market by Region, 2018 - 2021, USD Million
- TABLE 24 Global Powder-free Market by Region, 2022 - 2028, USD Million
- TABLE 25 Global Rubber Gloves Market by Distribution Channel, 2018 - 2021, USD Million
- TABLE 26 Global Rubber Gloves Market by Distribution Channel, 2022 - 2028, USD Million
- TABLE 27 Global Offline Market by Region, 2018 - 2021, USD Million
- TABLE 28 Global Offline Market by Region, 2022 - 2028, USD Million
- TABLE 29 Global Online Market by Region, 2018 - 2021, USD Million
- TABLE 30 Global Online Market by Region, 2022 - 2028, USD Million
- TABLE 31 Global Rubber Gloves Market by End-use, 2018 - 2021, USD Million
- TABLE 32 Global Rubber Gloves Market by End-use, 2022 - 2028, USD Million
- TABLE 33 Global Medical & Healthcare Market by Region, 2018 - 2021, USD Million
- TABLE 34 Global Medical & Healthcare Market by Region, 2022 - 2028, USD Million
- TABLE 35 Global Automotive Market by Region, 2018 - 2021, USD Million
- TABLE 36 Global Automotive Market by Region, 2022 - 2028, USD Million
- TABLE 37 Global Chemical & Petrochemical Market by Region, 2018 - 2021, USD Million
- TABLE 38 Global Chemical & Petrochemical Market by Region, 2022 - 2028, USD Million
- TABLE 39 Global Metal & Machinery Market by Region, 2018 - 2021, USD Million
- TABLE 40 Global Metal & Machinery Market by Region, 2022 - 2028, USD Million
- TABLE 41 Global Oil & Gas Market by Region, 2018 - 2021, USD Million
- TABLE 42 Global Oil & Gas Market by Region, 2022 - 2028, USD Million
- TABLE 43 Global Pharmaceutical Market by Region, 2018 - 2021, USD Million
- TABLE 44 Global Pharmaceutical Market by Region, 2022 - 2028, USD Million
- TABLE 45 Global Cleanroom Market by Region, 2018 - 2021, USD Million
- TABLE 46 Global Cleanroom Market by Region, 2022 - 2028, USD Million
- TABLE 47 Global Food & Beverage Market by Region, 2018 - 2021, USD Million
- TABLE 48 Global Food & Beverage Market by Region, 2022 - 2028, USD Million
- TABLE 49 Global Others Market by Region, 2018 - 2021, USD Million
- TABLE 50 Global Others Market by Region, 2022 - 2028, USD Million
- TABLE 51 Global Rubber Gloves Market by Region, 2018 - 2021, USD Million
- TABLE 52 Global Rubber Gloves Market by Region, 2022 - 2028, USD Million
- TABLE 53 North America Rubber Gloves Market, 2018 - 2021, USD Million
- TABLE 54 North America Rubber Gloves Market, 2022 - 2028, USD Million
- TABLE 55 North America Rubber Gloves Market by Product, 2018 - 2021, USD Million
- TABLE 56 North America Rubber Gloves Market by Product, 2022 - 2028, USD Million
- TABLE 57 North America Disposable Market by Country, 2018 - 2021, USD Million
- TABLE 58 North America Disposable Market by Country, 2022 - 2028, USD Million
- TABLE 59 North America Durable Market by Country, 2018 - 2021, USD Million
- TABLE 60 North America Durable Market by Country, 2022 - 2028, USD Million
- TABLE 61 North America Rubber Gloves Market by Material, 2018 - 2021, USD Million
- TABLE 62 North America Rubber Gloves Market by Material, 2022 - 2028, USD Million
- TABLE 63 North America Natural Rubber/Latex Market by Country, 2018 - 2021, USD Million
- TABLE 64 North America Natural Rubber/Latex Market by Country, 2022 - 2028, USD Million
- TABLE 65 North America Nitrile Market by Country, 2018 - 2021, USD Million
- TABLE 66 North America Nitrile Market by Country, 2022 - 2028, USD Million
- TABLE 67 North America Neoprene Market by Country, 2018 - 2021, USD Million
- TABLE 68 North America Neoprene Market by Country, 2022 - 2028, USD Million
- TABLE 69 North America Others Market by Country, 2018 - 2021, USD Million
- TABLE 70 North America Others Market by Country, 2022 - 2028, USD Million
- TABLE 71 North America Rubber Gloves Market by Type, 2018 - 2021, USD Million
- TABLE 72 North America Rubber Gloves Market by Type, 2022 - 2028, USD Million
- TABLE 73 North America Powdered Market by Country, 2018 - 2021, USD Million
- TABLE 74 North America Powdered Market by Country, 2022 - 2028, USD Million
- TABLE 75 North America Powder-free Market by Country, 2018 - 2021, USD Million
- TABLE 76 North America Powder-free Market by Country, 2022 - 2028, USD Million
- TABLE 77 North America Rubber Gloves Market by Distribution Channel, 2018 - 2021, USD Million
- TABLE 78 North America Rubber Gloves Market by Distribution Channel, 2022 - 2028, USD Million
- TABLE 79 North America Offline Market by Country, 2018 - 2021, USD Million
- TABLE 80 North America Offline Market by Country, 2022 - 2028, USD Million
- TABLE 81 North America Online Market by Country, 2018 - 2021, USD Million
- TABLE 82 North America Online Market by Country, 2022 - 2028, USD Million
- TABLE 83 North America Rubber Gloves Market by End-use, 2018 - 2021, USD Million
- TABLE 84 North America Rubber Gloves Market by End-use, 2022 - 2028, USD Million
- TABLE 85 North America Medical & Healthcare Market by Country, 2018 - 2021, USD Million
- TABLE 86 North America Medical & Healthcare Market by Country, 2022 - 2028, USD Million
- TABLE 87 North America Automotive Market by Country, 2018 - 2021, USD Million
- TABLE 88 North America Automotive Market by Country, 2022 - 2028, USD Million
- TABLE 89 North America Chemical & Petrochemical Market by Country, 2018 - 2021, USD Million
- TABLE 90 North America Chemical & Petrochemical Market by Country, 2022 - 2028, USD Million
- TABLE 91 North America Metal & Machinery Market by Country, 2018 - 2021, USD Million
- TABLE 92 North America Metal & Machinery Market by Country, 2022 - 2028, USD Million
- TABLE 93 North America Oil & Gas Market by Country, 2018 - 2021, USD Million
- TABLE 94 North America Oil & Gas Market by Country, 2022 - 2028, USD Million
- TABLE 95 North America Pharmaceutical Market by Country, 2018 - 2021, USD Million
- TABLE 96 North America Pharmaceutical Market by Country, 2022 - 2028, USD Million
- TABLE 97 North America Cleanroom Market by Country, 2018 - 2021, USD Million
- TABLE 98 North America Cleanroom Market by Country, 2022 - 2028, USD Million
- TABLE 99 North America Food & Beverage Market by Country, 2018 - 2021, USD Million
- TABLE 100 North America Food & Beverage Market by Country, 2022 - 2028, USD Million
- TABLE 101 North America Others Market by Country, 2018 - 2021, USD Million
- TABLE 102 North America Others Market by Country, 2022 - 2028, USD Million
- TABLE 103 North America Rubber Gloves Market by Country, 2018 - 2021, USD Million
- TABLE 104 North America Rubber Gloves Market by Country, 2022 - 2028, USD Million
- TABLE 105 US Rubber Gloves Market, 2018 - 2021, USD Million
- TABLE 106 US Rubber Gloves Market, 2022 - 2028, USD Million
- TABLE 107 US Rubber Gloves Market by Product, 2018 - 2021, USD Million
- TABLE 108 US Rubber Gloves Market by Product, 2022 - 2028, USD Million
- TABLE 109 US Rubber Gloves Market by Material, 2018 - 2021, USD Million
- TABLE 110 US Rubber Gloves Market by Material, 2022 - 2028, USD Million
- TABLE 111 US Rubber Gloves Market by Type, 2018 - 2021, USD Million
- TABLE 112 US Rubber Gloves Market by Type, 2022 - 2028, USD Million
- TABLE 113 US Rubber Gloves Market by Distribution Channel, 2018 - 2021, USD Million
- TABLE 114 US Rubber Gloves Market by Distribution Channel, 2022 - 2028, USD Million
- TABLE 115 US Rubber Gloves Market by End-use, 2018 - 2021, USD Million
- TABLE 116 US Rubber Gloves Market by End-use, 2022 - 2028, USD Million
- TABLE 117 Canada Rubber Gloves Market, 2018 - 2021, USD Million
- TABLE 118 Canada Rubber Gloves Market, 2022 - 2028, USD Million
- TABLE 119 Canada Rubber Gloves Market by Product, 2018 - 2021, USD Million
- TABLE 120 Canada Rubber Gloves Market by Product, 2022 - 2028, USD Million
- TABLE 121 Canada Rubber Gloves Market by Material, 2018 - 2021, USD Million
- TABLE 122 Canada Rubber Gloves Market by Material, 2022 - 2028, USD Million
- TABLE 123 Canada Rubber Gloves Market by Type, 2018 - 2021, USD Million
- TABLE 124 Canada Rubber Gloves Market by Type, 2022 - 2028, USD Million
- TABLE 125 Canada Rubber Gloves Market by Distribution Channel, 2018 - 2021, USD Million
- TABLE 126 Canada Rubber Gloves Market by Distribution Channel, 2022 - 2028, USD Million
- TABLE 127 Canada Rubber Gloves Market by End-use, 2018 - 2021, USD Million
- TABLE 128 Canada Rubber Gloves Market by End-use, 2022 - 2028, USD Million
- TABLE 129 Mexico Rubber Gloves Market, 2018 - 2021, USD Million
- TABLE 130 Mexico Rubber Gloves Market, 2022 - 2028, USD Million
- TABLE 131 Mexico Rubber Gloves Market by Product, 2018 - 2021, USD Million
- TABLE 132 Mexico Rubber Gloves Market by Product, 2022 - 2028, USD Million
- TABLE 133 Mexico Rubber Gloves Market by Material, 2018 - 2021, USD Million
- TABLE 134 Mexico Rubber Gloves Market by Material, 2022 - 2028, USD Million
- TABLE 135 Mexico Rubber Gloves Market by Type, 2018 - 2021, USD Million
- TABLE 136 Mexico Rubber Gloves Market by Type, 2022 - 2028, USD Million
- TABLE 137 Mexico Rubber Gloves Market by Distribution Channel, 2018 - 2021, USD Million
- TABLE 138 Mexico Rubber Gloves Market by Distribution Channel, 2022 - 2028, USD Million
- TABLE 139 Mexico Rubber Gloves Market by End-use, 2018 - 2021, USD Million
- TABLE 140 Mexico Rubber Gloves Market by End-use, 2022 - 2028, USD Million
- TABLE 141 Rest of North America Rubber Gloves Market, 2018 - 2021, USD Million
- TABLE 142 Rest of North America Rubber Gloves Market, 2022 - 2028, USD Million
- TABLE 143 Rest of North America Rubber Gloves Market by Product, 2018 - 2021, USD Million
- TABLE 144 Rest of North America Rubber Gloves Market by Product, 2022 - 2028, USD Million
- TABLE 145 Rest of North America Rubber Gloves Market by Material, 2018 - 2021, USD Million
- TABLE 146 Rest of North America Rubber Gloves Market by Material, 2022 - 2028, USD Million
- TABLE 147 Rest of North America Rubber Gloves Market by Type, 2018 - 2021, USD Million
- TABLE 148 Rest of North America Rubber Gloves Market by Type, 2022 - 2028, USD Million
- TABLE 149 Rest of North America Rubber Gloves Market by Distribution Channel, 2018 - 2021, USD Million
- TABLE 150 Rest of North America Rubber Gloves Market by Distribution Channel, 2022 - 2028, USD Million
- TABLE 151 Rest of North America Rubber Gloves Market by End-use, 2018 - 2021, USD Million
- TABLE 152 Rest of North America Rubber Gloves Market by End-use, 2022 - 2028, USD Million
- TABLE 153 Europe Rubber Gloves Market, 2018 - 2021, USD Million
- TABLE 154 Europe Rubber Gloves Market, 2022 - 2028, USD Million
- TABLE 155 Europe Rubber Gloves Market by Product, 2018 - 2021, USD Million
- TABLE 156 Europe Rubber Gloves Market by Product, 2022 - 2028, USD Million
- TABLE 157 Europe Disposable Market by Country, 2018 - 2021, USD Million
- TABLE 158 Europe Disposable Market by Country, 2022 - 2028, USD Million
- TABLE 159 Europe Durable Market by Country, 2018 - 2021, USD Million
- TABLE 160 Europe Durable Market by Country, 2022 - 2028, USD Million
- TABLE 161 Europe Rubber Gloves Market by Material, 2018 - 2021, USD Million
- TABLE 162 Europe Rubber Gloves Market by Material, 2022 - 2028, USD Million
- TABLE 163 Europe Natural Rubber/Latex Market by Country, 2018 - 2021, USD Million
- TABLE 164 Europe Natural Rubber/Latex Market by Country, 2022 - 2028, USD Million
- TABLE 165 Europe Nitrile Market by Country, 2018 - 2021, USD Million
- TABLE 166 Europe Nitrile Market by Country, 2022 - 2028, USD Million
- TABLE 167 Europe Neoprene Market by Country, 2018 - 2021, USD Million
- TABLE 168 Europe Neoprene Market by Country, 2022 - 2028, USD Million
- TABLE 169 Europe Others Market by Country, 2018 - 2021, USD Million
- TABLE 170 Europe Others Market by Country, 2022 - 2028, USD Million
- TABLE 171 Europe Rubber Gloves Market by Type, 2018 - 2021, USD Million
- TABLE 172 Europe Rubber Gloves Market by Type, 2022 - 2028, USD Million
- TABLE 173 Europe Powdered Market by Country, 2018 - 2021, USD Million
- TABLE 174 Europe Powdered Market by Country, 2022 - 2028, USD Million
- TABLE 175 Europe Powder-free Market by Country, 2018 - 2021, USD Million
- TABLE 176 Europe Powder-free Market by Country, 2022 - 2028, USD Million
- TABLE 177 Europe Rubber Gloves Market by Distribution Channel, 2018 - 2021, USD Million
- TABLE 178 Europe Rubber Gloves Market by Distribution Channel, 2022 - 2028, USD Million
- TABLE 179 Europe Offline Market by Country, 2018 - 2021, USD Million
- TABLE 180 Europe Offline Market by Country, 2022 - 2028, USD Million
- TABLE 181 Europe Online Market by Country, 2018 - 2021, USD Million
- TABLE 182 Europe Online Market by Country, 2022 - 2028, USD Million
- TABLE 183 Europe Rubber Gloves Market by End-use, 2018 - 2021, USD Million
- TABLE 184 Europe Rubber Gloves Market by End-use, 2022 - 2028, USD Million
- TABLE 185 Europe Medical & Healthcare Market by Country, 2018 - 2021, USD Million
- TABLE 186 Europe Medical & Healthcare Market by Country, 2022 - 2028, USD Million
- TABLE 187 Europe Automotive Market by Country, 2018 - 2021, USD Million
- TABLE 188 Europe Automotive Market by Country, 2022 - 2028, USD Million
- TABLE 189 Europe Chemical & Petrochemical Market by Country, 2018 - 2021, USD Million
- TABLE 190 Europe Chemical & Petrochemical Market by Country, 2022 - 2028, USD Million
- TABLE 191 Europe Metal & Machinery Market by Country, 2018 - 2021, USD Million
- TABLE 192 Europe Metal & Machinery Market by Country, 2022 - 2028, USD Million
- TABLE 193 Europe Oil & Gas Market by Country, 2018 - 2021, USD Million
- TABLE 194 Europe Oil & Gas Market by Country, 2022 - 2028, USD Million
- TABLE 195 Europe Pharmaceutical Market by Country, 2018 - 2021, USD Million
- TABLE 196 Europe Pharmaceutical Market by Country, 2022 - 2028, USD Million
- TABLE 197 Europe Cleanroom Market by Country, 2018 - 2021, USD Million
- TABLE 198 Europe Cleanroom Market by Country, 2022 - 2028, USD Million
- TABLE 199 Europe Food & Beverage Market by Country, 2018 - 2021, USD Million
- TABLE 200 Europe Food & Beverage Market by Country, 2022 - 2028, USD Million
- TABLE 201 Europe Others Market by Country, 2018 - 2021, USD Million
- TABLE 202 Europe Others Market by Country, 2022 - 2028, USD Million
- TABLE 203 Europe Rubber Gloves Market by Country, 2018 - 2021, USD Million
- TABLE 204 Europe Rubber Gloves Market by Country, 2022 - 2028, USD Million
- TABLE 205 Germany Rubber Gloves Market, 2018 - 2021, USD Million
- TABLE 206 Germany Rubber Gloves Market, 2022 - 2028, USD Million
- TABLE 207 Germany Rubber Gloves Market by Product, 2018 - 2021, USD Million
- TABLE 208 Germany Rubber Gloves Market by Product, 2022 - 2028, USD Million
- TABLE 209 Germany Rubber Gloves Market by Material, 2018 - 2021, USD Million
- TABLE 210 Germany Rubber Gloves Market by Material, 2022 - 2028, USD Million
- TABLE 211 Germany Rubber Gloves Market by Type, 2018 - 2021, USD Million
- TABLE 212 Germany Rubber Gloves Market by Type, 2022 - 2028, USD Million
- TABLE 213 Germany Rubber Gloves Market by Distribution Channel, 2018 - 2021, USD Million
- TABLE 214 Germany Rubber Gloves Market by Distribution Channel, 2022 - 2028, USD Million
- TABLE 215 Germany Rubber Gloves Market by End-use, 2018 - 2021, USD Million
- TABLE 216 Germany Rubber Gloves Market by End-use, 2022 - 2028, USD Million
- TABLE 217 UK Rubber Gloves Market, 2018 - 2021, USD Million
- TABLE 218 UK Rubber Gloves Market, 2022 - 2028, USD Million
- TABLE 219 UK Rubber Gloves Market by Product, 2018 - 2021, USD Million
- TABLE 220 UK Rubber Gloves Market by Product, 2022 - 2028, USD Million
- TABLE 221 UK Rubber Gloves Market by Material, 2018 - 2021, USD Million
- TABLE 222 UK Rubber Gloves Market by Material, 2022 - 2028, USD Million
- TABLE 223 UK Rubber Gloves Market by Type, 2018 - 2021, USD Million
- TABLE 224 UK Rubber Gloves Market by Type, 2022 - 2028, USD Million
- TABLE 225 UK Rubber Gloves Market by Distribution Channel, 2018 - 2021, USD Million
- TABLE 226 UK Rubber Gloves Market by Distribution Channel, 2022 - 2028, USD Million
- TABLE 227 UK Rubber Gloves Market by End-use, 2018 - 2021, USD Million
- TABLE 228 UK Rubber Gloves Market by End-use, 2022 - 2028, USD Million
- TABLE 229 France Rubber Gloves Market, 2018 - 2021, USD Million
- TABLE 230 France Rubber Gloves Market, 2022 - 2028, USD Million
- TABLE 231 France Rubber Gloves Market by Product, 2018 - 2021, USD Million
- TABLE 232 France Rubber Gloves Market by Product, 2022 - 2028, USD Million
- TABLE 233 France Rubber Gloves Market by Material, 2018 - 2021, USD Million
- TABLE 234 France Rubber Gloves Market by Material, 2022 - 2028, USD Million
- TABLE 235 France Rubber Gloves Market by Type, 2018 - 2021, USD Million
- TABLE 236 France Rubber Gloves Market by Type, 2022 - 2028, USD Million
- TABLE 237 France Rubber Gloves Market by Distribution Channel, 2018 - 2021, USD Million
- TABLE 238 France Rubber Gloves Market by Distribution Channel, 2022 - 2028, USD Million
- TABLE 239 France Rubber Gloves Market by End-use, 2018 - 2021, USD Million
- TABLE 240 France Rubber Gloves Market by End-use, 2022 - 2028, USD Million
- TABLE 241 Russia Rubber Gloves Market, 2018 - 2021, USD Million
- TABLE 242 Russia Rubber Gloves Market, 2022 - 2028, USD Million
- TABLE 243 Russia Rubber Gloves Market by Product, 2018 - 2021, USD Million
- TABLE 244 Russia Rubber Gloves Market by Product, 2022 - 2028, USD Million
- TABLE 245 Russia Rubber Gloves Market by Material, 2018 - 2021, USD Million
- TABLE 246 Russia Rubber Gloves Market by Material, 2022 - 2028, USD Million
- TABLE 247 Russia Rubber Gloves Market by Type, 2018 - 2021, USD Million
- TABLE 248 Russia Rubber Gloves Market by Type, 2022 - 2028, USD Million
- TABLE 249 Russia Rubber Gloves Market by Distribution Channel, 2018 - 2021, USD Million
- TABLE 250 Russia Rubber Gloves Market by Distribution Channel, 2022 - 2028, USD Million
- TABLE 251 Russia Rubber Gloves Market by End-use, 2018 - 2021, USD Million
- TABLE 252 Russia Rubber Gloves Market by End-use, 2022 - 2028, USD Million
- TABLE 253 Spain Rubber Gloves Market, 2018 - 2021, USD Million
- TABLE 254 Spain Rubber Gloves Market, 2022 - 2028, USD Million
- TABLE 255 Spain Rubber Gloves Market by Product, 2018 - 2021, USD Million
- TABLE 256 Spain Rubber Gloves Market by Product, 2022 - 2028, USD Million
- TABLE 257 Spain Rubber Gloves Market by Material, 2018 - 2021, USD Million
- TABLE 258 Spain Rubber Gloves Market by Material, 2022 - 2028, USD Million
- TABLE 259 Spain Rubber Gloves Market by Type, 2018 - 2021, USD Million
- TABLE 260 Spain Rubber Gloves Market by Type, 2022 - 2028, USD Million
- TABLE 261 Spain Rubber Gloves Market by Distribution Channel, 2018 - 2021, USD Million
- TABLE 262 Spain Rubber Gloves Market by Distribution Channel, 2022 - 2028, USD Million
- TABLE 263 Spain Rubber Gloves Market by End-use, 2018 - 2021, USD Million
- TABLE 264 Spain Rubber Gloves Market by End-use, 2022 - 2028, USD Million
- TABLE 265 Italy Rubber Gloves Market, 2018 - 2021, USD Million
- TABLE 266 Italy Rubber Gloves Market, 2022 - 2028, USD Million
- TABLE 267 Italy Rubber Gloves Market by Product, 2018 - 2021, USD Million
- TABLE 268 Italy Rubber Gloves Market by Product, 2022 - 2028, USD Million
- TABLE 269 Italy Rubber Gloves Market by Material, 2018 - 2021, USD Million
- TABLE 270 Italy Rubber Gloves Market by Material, 2022 - 2028, USD Million
- TABLE 271 Italy Rubber Gloves Market by Type, 2018 - 2021, USD Million
- TABLE 272 Italy Rubber Gloves Market by Type, 2022 - 2028, USD Million
- TABLE 273 Italy Rubber Gloves Market by Distribution Channel, 2018 - 2021, USD Million
- TABLE 274 Italy Rubber Gloves Market by Distribution Channel, 2022 - 2028, USD Million
- TABLE 275 Italy Rubber Gloves Market by End-use, 2018 - 2021, USD Million
- TABLE 276 Italy Rubber Gloves Market by End-use, 2022 - 2028, USD Million
- TABLE 277 Rest of Europe Rubber Gloves Market, 2018 - 2021, USD Million
- TABLE 278 Rest of Europe Rubber Gloves Market, 2022 - 2028, USD Million
- TABLE 279 Rest of Europe Rubber Gloves Market by Product, 2018 - 2021, USD Million
- TABLE 280 Rest of Europe Rubber Gloves Market by Product, 2022 - 2028, USD Million
- TABLE 281 Rest of Europe Rubber Gloves Market by Material, 2018 - 2021, USD Million
- TABLE 282 Rest of Europe Rubber Gloves Market by Material, 2022 - 2028, USD Million
- TABLE 283 Rest of Europe Rubber Gloves Market by Type, 2018 - 2021, USD Million
- TABLE 284 Rest of Europe Rubber Gloves Market by Type, 2022 - 2028, USD Million
- TABLE 285 Rest of Europe Rubber Gloves Market by Distribution Channel, 2018 - 2021, USD Million
- TABLE 286 Rest of Europe Rubber Gloves Market by Distribution Channel, 2022 - 2028, USD Million
- TABLE 287 Rest of Europe Rubber Gloves Market by End-use, 2018 - 2021, USD Million
- TABLE 288 Rest of Europe Rubber Gloves Market by End-use, 2022 - 2028, USD Million
- TABLE 289 Asia Pacific Rubber Gloves Market, 2018 - 2021, USD Million
- TABLE 290 Asia Pacific Rubber Gloves Market, 2022 - 2028, USD Million
- TABLE 291 Asia Pacific Rubber Gloves Market by Product, 2018 - 2021, USD Million
- TABLE 292 Asia Pacific Rubber Gloves Market by Product, 2022 - 2028, USD Million
- TABLE 293 Asia Pacific Disposable Market by Country, 2018 - 2021, USD Million
- TABLE 294 Asia Pacific Disposable Market by Country, 2022 - 2028, USD Million
- TABLE 295 Asia Pacific Durable Market by Country, 2018 - 2021, USD Million
- TABLE 296 Asia Pacific Durable Market by Country, 2022 - 2028, USD Million
- TABLE 297 Asia Pacific Rubber Gloves Market by Material, 2018 - 2021, USD Million
- TABLE 298 Asia Pacific Rubber Gloves Market by Material, 2022 - 2028, USD Million
- TABLE 299 Asia Pacific Natural Rubber/Latex Market by Country, 2018 - 2021, USD Million
- TABLE 300 Asia Pacific Natural Rubber/Latex Market by Country, 2022 - 2028, USD Million
- TABLE 301 Asia Pacific Nitrile Market by Country, 2018 - 2021, USD Million
- TABLE 302 Asia Pacific Nitrile Market by Country, 2022 - 2028, USD Million
- TABLE 303 Asia Pacific Neoprene Market by Country, 2018 - 2021, USD Million
- TABLE 304 Asia Pacific Neoprene Market by Country, 2022 - 2028, USD Million
- TABLE 305 Asia Pacific Others Market by Country, 2018 - 2021, USD Million
- TABLE 306 Asia Pacific Others Market by Country, 2022 - 2028, USD Million
- TABLE 307 Asia Pacific Rubber Gloves Market by Type, 2018 - 2021, USD Million
- TABLE 308 Asia Pacific Rubber Gloves Market by Type, 2022 - 2028, USD Million
- TABLE 309 Asia Pacific Powdered Market by Country, 2018 - 2021, USD Million
- TABLE 310 Asia Pacific Powdered Market by Country, 2022 - 2028, USD Million
- TABLE 311 Asia Pacific Powder-free Market by Country, 2018 - 2021, USD Million
- TABLE 312 Asia Pacific Powder-free Market by Country, 2022 - 2028, USD Million
- TABLE 313 Asia Pacific Rubber Gloves Market by Distribution Channel, 2018 - 2021, USD Million
- TABLE 314 Asia Pacific Rubber Gloves Market by Distribution Channel, 2022 - 2028, USD Million
- TABLE 315 Asia Pacific Offline Market by Country, 2018 - 2021, USD Million
- TABLE 316 Asia Pacific Offline Market by Country, 2022 - 2028, USD Million
- TABLE 317 Asia Pacific Online Market by Country, 2018 - 2021, USD Million
- TABLE 318 Asia Pacific Online Market by Country, 2022 - 2028, USD Million
- TABLE 319 Asia Pacific Rubber Gloves Market by End-use, 2018 - 2021, USD Million
- TABLE 320 Asia Pacific Rubber Gloves Market by End-use, 2022 - 2028, USD Million
- TABLE 321 Asia Pacific Medical & Healthcare Market by Country, 2018 - 2021, USD Million
- TABLE 322 Asia Pacific Medical & Healthcare Market by Country, 2022 - 2028, USD Million
- TABLE 323 Asia Pacific Automotive Market by Country, 2018 - 2021, USD Million
- TABLE 324 Asia Pacific Automotive Market by Country, 2022 - 2028, USD Million
- TABLE 325 Asia Pacific Chemical & Petrochemical Market by Country, 2018 - 2021, USD Million
- TABLE 326 Asia Pacific Chemical & Petrochemical Market by Country, 2022 - 2028, USD Million
- TABLE 327 Asia Pacific Metal & Machinery Market by Country, 2018 - 2021, USD Million
- TABLE 328 Asia Pacific Metal & Machinery Market by Country, 2022 - 2028, USD Million
- TABLE 329 Asia Pacific Oil & Gas Market by Country, 2018 - 2021, USD Million
- TABLE 330 Asia Pacific Oil & Gas Market by Country, 2022 - 2028, USD Million
- TABLE 331 Asia Pacific Pharmaceutical Market by Country, 2018 - 2021, USD Million
- TABLE 332 Asia Pacific Pharmaceutical Market by Country, 2022 - 2028, USD Million
- TABLE 333 Asia Pacific Cleanroom Market by Country, 2018 - 2021, USD Million
- TABLE 334 Asia Pacific Cleanroom Market by Country, 2022 - 2028, USD Million
- TABLE 335 Asia Pacific Food & Beverage Market by Country, 2018 - 2021, USD Million
- TABLE 336 Asia Pacific Food & Beverage Market by Country, 2022 - 2028, USD Million
- TABLE 337 Asia Pacific Others Market by Country, 2018 - 2021, USD Million
- TABLE 338 Asia Pacific Others Market by Country, 2022 - 2028, USD Million
- TABLE 339 Asia Pacific Rubber Gloves Market by Country, 2018 - 2021, USD Million
- TABLE 340 Asia Pacific Rubber Gloves Market by Country, 2022 - 2028, USD Million
- TABLE 341 China Rubber Gloves Market, 2018 - 2021, USD Million
- TABLE 342 China Rubber Gloves Market, 2022 - 2028, USD Million
- TABLE 343 China Rubber Gloves Market by Product, 2018 - 2021, USD Million
- TABLE 344 China Rubber Gloves Market by Product, 2022 - 2028, USD Million
- TABLE 345 China Rubber Gloves Market by Material, 2018 - 2021, USD Million
- TABLE 346 China Rubber Gloves Market by Material, 2022 - 2028, USD Million
- TABLE 347 China Rubber Gloves Market by Type, 2018 - 2021, USD Million
- TABLE 348 China Rubber Gloves Market by Type, 2022 - 2028, USD Million
- TABLE 349 China Rubber Gloves Market by Distribution Channel, 2018 - 2021, USD Million
- TABLE 350 China Rubber Gloves Market by Distribution Channel, 2022 - 2028, USD Million
- TABLE 351 China Rubber Gloves Market by End-use, 2018 - 2021, USD Million
- TABLE 352 China Rubber Gloves Market by End-use, 2022 - 2028, USD Million
- TABLE 353 Japan Rubber Gloves Market, 2018 - 2021, USD Million
- TABLE 354 Japan Rubber Gloves Market, 2022 - 2028, USD Million
- TABLE 355 Japan Rubber Gloves Market by Product, 2018 - 2021, USD Million
- TABLE 356 Japan Rubber Gloves Market by Product, 2022 - 2028, USD Million
- TABLE 357 Japan Rubber Gloves Market by Material, 2018 - 2021, USD Million
- TABLE 358 Japan Rubber Gloves Market by Material, 2022 - 2028, USD Million
- TABLE 359 Japan Rubber Gloves Market by Type, 2018 - 2021, USD Million
- TABLE 360 Japan Rubber Gloves Market by Type, 2022 - 2028, USD Million
- TABLE 361 Japan Rubber Gloves Market by Distribution Channel, 2018 - 2021, USD Million
- TABLE 362 Japan Rubber Gloves Market by Distribution Channel, 2022 - 2028, USD Million
- TABLE 363 Japan Rubber Gloves Market by End-use, 2018 - 2021, USD Million
- TABLE 364 Japan Rubber Gloves Market by End-use, 2022 - 2028, USD Million
- TABLE 365 India Rubber Gloves Market, 2018 - 2021, USD Million
- TABLE 366 India Rubber Gloves Market, 2022 - 2028, USD Million
- TABLE 367 India Rubber Gloves Market by Product, 2018 - 2021, USD Million
- TABLE 368 India Rubber Gloves Market by Product, 2022 - 2028, USD Million
- TABLE 369 India Rubber Gloves Market by Material, 2018 - 2021, USD Million
- TABLE 370 India Rubber Gloves Market by Material, 2022 - 2028, USD Million
- TABLE 371 India Rubber Gloves Market by Type, 2018 - 2021, USD Million
- TABLE 372 India Rubber Gloves Market by Type, 2022 - 2028, USD Million
- TABLE 373 India Rubber Gloves Market by Distribution Channel, 2018 - 2021, USD Million
- TABLE 374 India Rubber Gloves Market by Distribution Channel, 2022 - 2028, USD Million
- TABLE 375 India Rubber Gloves Market by End-use, 2018 - 2021, USD Million
- TABLE 376 India Rubber Gloves Market by End-use, 2022 - 2028, USD Million
- TABLE 377 South Korea Rubber Gloves Market, 2018 - 2021, USD Million
- TABLE 378 South Korea Rubber Gloves Market, 2022 - 2028, USD Million
- TABLE 379 South Korea Rubber Gloves Market by Product, 2018 - 2021, USD Million
- TABLE 380 South Korea Rubber Gloves Market by Product, 2022 - 2028, USD Million
- TABLE 381 South Korea Rubber Gloves Market by Material, 2018 - 2021, USD Million
- TABLE 382 South Korea Rubber Gloves Market by Material, 2022 - 2028, USD Million
- TABLE 383 South Korea Rubber Gloves Market by Type, 2018 - 2021, USD Million
- TABLE 384 South Korea Rubber Gloves Market by Type, 2022 - 2028, USD Million
- TABLE 385 South Korea Rubber Gloves Market by Distribution Channel, 2018 - 2021, USD Million
- TABLE 386 South Korea Rubber Gloves Market by Distribution Channel, 2022 - 2028, USD Million
- TABLE 387 South Korea Rubber Gloves Market by End-use, 2018 - 2021, USD Million
- TABLE 388 South Korea Rubber Gloves Market by End-use, 2022 - 2028, USD Million
- TABLE 389 Singapore Rubber Gloves Market, 2018 - 2021, USD Million
- TABLE 390 Singapore Rubber Gloves Market, 2022 - 2028, USD Million
- TABLE 391 Singapore Rubber Gloves Market by Product, 2018 - 2021, USD Million
- TABLE 392 Singapore Rubber Gloves Market by Product, 2022 - 2028, USD Million
- TABLE 393 Singapore Rubber Gloves Market by Material, 2018 - 2021, USD Million
- TABLE 394 Singapore Rubber Gloves Market by Material, 2022 - 2028, USD Million
- TABLE 395 Singapore Rubber Gloves Market by Type, 2018 - 2021, USD Million
- TABLE 396 Singapore Rubber Gloves Market by Type, 2022 - 2028, USD Million
- TABLE 397 Singapore Rubber Gloves Market by Distribution Channel, 2018 - 2021, USD Million
- TABLE 398 Singapore Rubber Gloves Market by Distribution Channel, 2022 - 2028, USD Million
- TABLE 399 Singapore Rubber Gloves Market by End-use, 2018 - 2021, USD Million
- TABLE 400 Singapore Rubber Gloves Market by End-use, 2022 - 2028, USD Million
- TABLE 401 Malaysia Rubber Gloves Market, 2018 - 2021, USD Million
- TABLE 402 Malaysia Rubber Gloves Market, 2022 - 2028, USD Million
- TABLE 403 Malaysia Rubber Gloves Market by Product, 2018 - 2021, USD Million
- TABLE 404 Malaysia Rubber Gloves Market by Product, 2022 - 2028, USD Million
- TABLE 405 Malaysia Rubber Gloves Market by Material, 2018 - 2021, USD Million
- TABLE 406 Malaysia Rubber Gloves Market by Material, 2022 - 2028, USD Million
- TABLE 407 Malaysia Rubber Gloves Market by Type, 2018 - 2021, USD Million
- TABLE 408 Malaysia Rubber Gloves Market by Type, 2022 - 2028, USD Million
- TABLE 409 Malaysia Rubber Gloves Market by Distribution Channel, 2018 - 2021, USD Million
- TABLE 410 Malaysia Rubber Gloves Market by Distribution Channel, 2022 - 2028, USD Million
- TABLE 411 Malaysia Rubber Gloves Market by End-use, 2018 - 2021, USD Million
- TABLE 412 Malaysia Rubber Gloves Market by End-use, 2022 - 2028, USD Million
- TABLE 413 Rest of Asia Pacific Rubber Gloves Market, 2018 - 2021, USD Million
- TABLE 414 Rest of Asia Pacific Rubber Gloves Market, 2022 - 2028, USD Million
- TABLE 415 Rest of Asia Pacific Rubber Gloves Market by Product, 2018 - 2021, USD Million
- TABLE 416 Rest of Asia Pacific Rubber Gloves Market by Product, 2022 - 2028, USD Million
- TABLE 417 Rest of Asia Pacific Rubber Gloves Market by Material, 2018 - 2021, USD Million
- TABLE 418 Rest of Asia Pacific Rubber Gloves Market by Material, 2022 - 2028, USD Million
- TABLE 419 Rest of Asia Pacific Rubber Gloves Market by Type, 2018 - 2021, USD Million
- TABLE 420 Rest of Asia Pacific Rubber Gloves Market by Type, 2022 - 2028, USD Million
- TABLE 421 Rest of Asia Pacific Rubber Gloves Market by Distribution Channel, 2018 - 2021, USD Million
- TABLE 422 Rest of Asia Pacific Rubber Gloves Market by Distribution Channel, 2022 - 2028, USD Million
- TABLE 423 Rest of Asia Pacific Rubber Gloves Market by End-use, 2018 - 2021, USD Million
- TABLE 424 Rest of Asia Pacific Rubber Gloves Market by End-use, 2022 - 2028, USD Million
- TABLE 425 LAMEA Rubber Gloves Market, 2018 - 2021, USD Million
- TABLE 426 LAMEA Rubber Gloves Market, 2022 - 2028, USD Million
- TABLE 427 LAMEA Rubber Gloves Market by Product, 2018 - 2021, USD Million
- TABLE 428 LAMEA Rubber Gloves Market by Product, 2022 - 2028, USD Million
- TABLE 429 LAMEA Disposable Market by Country, 2018 - 2021, USD Million
- TABLE 430 LAMEA Disposable Market by Country, 2022 - 2028, USD Million
- TABLE 431 LAMEA Durable Market by Country, 2018 - 2021, USD Million
- TABLE 432 LAMEA Durable Market by Country, 2022 - 2028, USD Million
- TABLE 433 LAMEA Rubber Gloves Market by Material, 2018 - 2021, USD Million
- TABLE 434 LAMEA Rubber Gloves Market by Material, 2022 - 2028, USD Million
- TABLE 435 LAMEA Natural Rubber/Latex Market by Country, 2018 - 2021, USD Million
- TABLE 436 LAMEA Natural Rubber/Latex Market by Country, 2022 - 2028, USD Million
- TABLE 437 LAMEA Nitrile Market by Country, 2018 - 2021, USD Million
- TABLE 438 LAMEA Nitrile Market by Country, 2022 - 2028, USD Million
- TABLE 439 LAMEA Neoprene Market by Country, 2018 - 2021, USD Million
- TABLE 440 LAMEA Neoprene Market by Country, 2022 - 2028, USD Million
- TABLE 441 LAMEA Others Market by Country, 2018 - 2021, USD Million
- TABLE 442 LAMEA Others Market by Country, 2022 - 2028, USD Million
- TABLE 443 LAMEA Rubber Gloves Market by Type, 2018 - 2021, USD Million
- TABLE 444 LAMEA Rubber Gloves Market by Type, 2022 - 2028, USD Million
- TABLE 445 LAMEA Powdered Market by Country, 2018 - 2021, USD Million
- TABLE 446 LAMEA Powdered Market by Country, 2022 - 2028, USD Million
- TABLE 447 LAMEA Powder-free Market by Country, 2018 - 2021, USD Million
- TABLE 448 LAMEA Powder-free Market by Country, 2022 - 2028, USD Million
- TABLE 449 LAMEA Rubber Gloves Market by Distribution Channel, 2018 - 2021, USD Million
- TABLE 450 LAMEA Rubber Gloves Market by Distribution Channel, 2022 - 2028, USD Million
- TABLE 451 LAMEA Offline Market by Country, 2018 - 2021, USD Million
- TABLE 452 LAMEA Offline Market by Country, 2022 - 2028, USD Million
- TABLE 453 LAMEA Online Market by Country, 2018 - 2021, USD Million
- TABLE 454 LAMEA Online Market by Country, 2022 - 2028, USD Million
- TABLE 455 LAMEA Rubber Gloves Market by End-use, 2018 - 2021, USD Million
- TABLE 456 LAMEA Rubber Gloves Market by End-use, 2022 - 2028, USD Million
- TABLE 457 LAMEA Medical & Healthcare Market by Country, 2018 - 2021, USD Million
- TABLE 458 LAMEA Medical & Healthcare Market by Country, 2022 - 2028, USD Million
- TABLE 459 LAMEA Automotive Market by Country, 2018 - 2021, USD Million
- TABLE 460 LAMEA Automotive Market by Country, 2022 - 2028, USD Million
- TABLE 461 LAMEA Chemical & Petrochemical Market by Country, 2018 - 2021, USD Million
- TABLE 462 LAMEA Chemical & Petrochemical Market by Country, 2022 - 2028, USD Million
- TABLE 463 LAMEA Metal & Machinery Market by Country, 2018 - 2021, USD Million
- TABLE 464 LAMEA Metal & Machinery Market by Country, 2022 - 2028, USD Million
- TABLE 465 LAMEA Oil & Gas Market by Country, 2018 - 2021, USD Million
- TABLE 466 LAMEA Oil & Gas Market by Country, 2022 - 2028, USD Million
- TABLE 467 LAMEA Pharmaceutical Market by Country, 2018 - 2021, USD Million
- TABLE 468 LAMEA Pharmaceutical Market by Country, 2022 - 2028, USD Million
- TABLE 469 LAMEA Cleanroom Market by Country, 2018 - 2021, USD Million
- TABLE 470 LAMEA Cleanroom Market by Country, 2022 - 2028, USD Million
- TABLE 471 LAMEA Food & Beverage Market by Country, 2018 - 2021, USD Million
- TABLE 472 LAMEA Food & Beverage Market by Country, 2022 - 2028, USD Million
- TABLE 473 LAMEA Others Market by Country, 2018 - 2021, USD Million
- TABLE 474 LAMEA Others Market by Country, 2022 - 2028, USD Million
- TABLE 475 LAMEA Rubber Gloves Market by Country, 2018 - 2021, USD Million
- TABLE 476 LAMEA Rubber Gloves Market by Country, 2022 - 2028, USD Million
- TABLE 477 Brazil Rubber Gloves Market, 2018 - 2021, USD Million
- TABLE 478 Brazil Rubber Gloves Market, 2022 - 2028, USD Million
- TABLE 479 Brazil Rubber Gloves Market by Product, 2018 - 2021, USD Million
- TABLE 480 Brazil Rubber Gloves Market by Product, 2022 - 2028, USD Million
- TABLE 481 Brazil Rubber Gloves Market by Material, 2018 - 2021, USD Million
- TABLE 482 Brazil Rubber Gloves Market by Material, 2022 - 2028, USD Million
- TABLE 483 Brazil Rubber Gloves Market by Type, 2018 - 2021, USD Million
- TABLE 484 Brazil Rubber Gloves Market by Type, 2022 - 2028, USD Million
- TABLE 485 Brazil Rubber Gloves Market by Distribution Channel, 2018 - 2021, USD Million
- TABLE 486 Brazil Rubber Gloves Market by Distribution Channel, 2022 - 2028, USD Million
- TABLE 487 Brazil Rubber Gloves Market by End-use, 2018 - 2021, USD Million
- TABLE 488 Brazil Rubber Gloves Market by End-use, 2022 - 2028, USD Million
- TABLE 489 Argentina Rubber Gloves Market, 2018 - 2021, USD Million
- TABLE 490 Argentina Rubber Gloves Market, 2022 - 2028, USD Million
- TABLE 491 Argentina Rubber Gloves Market by Product, 2018 - 2021, USD Million
- TABLE 492 Argentina Rubber Gloves Market by Product, 2022 - 2028, USD Million
- TABLE 493 Argentina Rubber Gloves Market by Material, 2018 - 2021, USD Million
- TABLE 494 Argentina Rubber Gloves Market by Material, 2022 - 2028, USD Million
- TABLE 495 Argentina Rubber Gloves Market by Type, 2018 - 2021, USD Million
- TABLE 496 Argentina Rubber Gloves Market by Type, 2022 - 2028, USD Million
- TABLE 497 Argentina Rubber Gloves Market by Distribution Channel, 2018 - 2021, USD Million
- TABLE 498 Argentina Rubber Gloves Market by Distribution Channel, 2022 - 2028, USD Million
- TABLE 499 Argentina Rubber Gloves Market by End-use, 2018 - 2021, USD Million
- TABLE 500 Argentina Rubber Gloves Market by End-use, 2022 - 2028, USD Million
- TABLE 501 UAE Rubber Gloves Market, 2018 - 2021, USD Million
- TABLE 502 UAE Rubber Gloves Market, 2022 - 2028, USD Million
- TABLE 503 UAE Rubber Gloves Market by Product, 2018 - 2021, USD Million
- TABLE 504 UAE Rubber Gloves Market by Product, 2022 - 2028, USD Million
- TABLE 505 UAE Rubber Gloves Market by Material, 2018 - 2021, USD Million
- TABLE 506 UAE Rubber Gloves Market by Material, 2022 - 2028, USD Million
- TABLE 507 UAE Rubber Gloves Market by Type, 2018 - 2021, USD Million
- TABLE 508 UAE Rubber Gloves Market by Type, 2022 - 2028, USD Million
- TABLE 509 UAE Rubber Gloves Market by Distribution Channel, 2018 - 2021, USD Million
- TABLE 510 UAE Rubber Gloves Market by Distribution Channel, 2022 - 2028, USD Million
- TABLE 511 UAE Rubber Gloves Market by End-use, 2018 - 2021, USD Million
- TABLE 512 UAE Rubber Gloves Market by End-use, 2022 - 2028, USD Million
- TABLE 513 Saudi Arabia Rubber Gloves Market, 2018 - 2021, USD Million
- TABLE 514 Saudi Arabia Rubber Gloves Market, 2022 - 2028, USD Million
- TABLE 515 Saudi Arabia Rubber Gloves Market by Product, 2018 - 2021, USD Million
- TABLE 516 Saudi Arabia Rubber Gloves Market by Product, 2022 - 2028, USD Million
- TABLE 517 Saudi Arabia Rubber Gloves Market by Material, 2018 - 2021, USD Million
- TABLE 518 Saudi Arabia Rubber Gloves Market by Material, 2022 - 2028, USD Million
- TABLE 519 Saudi Arabia Rubber Gloves Market by Type, 2018 - 2021, USD Million
- TABLE 520 Saudi Arabia Rubber Gloves Market by Type, 2022 - 2028, USD Million
- TABLE 521 Saudi Arabia Rubber Gloves Market by Distribution Channel, 2018 - 2021, USD Million
- TABLE 522 Saudi Arabia Rubber Gloves Market by Distribution Channel, 2022 - 2028, USD Million
- TABLE 523 Saudi Arabia Rubber Gloves Market by End-use, 2018 - 2021, USD Million
- TABLE 524 Saudi Arabia Rubber Gloves Market by End-use, 2022 - 2028, USD Million
- TABLE 525 South Africa Rubber Gloves Market, 2018 - 2021, USD Million
- TABLE 526 South Africa Rubber Gloves Market, 2022 - 2028, USD Million
- TABLE 527 South Africa Rubber Gloves Market by Product, 2018 - 2021, USD Million
- TABLE 528 South Africa Rubber Gloves Market by Product, 2022 - 2028, USD Million
- TABLE 529 South Africa Rubber Gloves Market by Material, 2018 - 2021, USD Million
- TABLE 530 South Africa Rubber Gloves Market by Material, 2022 - 2028, USD Million
- TABLE 531 South Africa Rubber Gloves Market by Type, 2018 - 2021, USD Million
- TABLE 532 South Africa Rubber Gloves Market by Type, 2022 - 2028, USD Million
- TABLE 533 South Africa Rubber Gloves Market by Distribution Channel, 2018 - 2021, USD Million
- TABLE 534 South Africa Rubber Gloves Market by Distribution Channel, 2022 - 2028, USD Million
- TABLE 535 South Africa Rubber Gloves Market by End-use, 2018 - 2021, USD Million
- TABLE 536 South Africa Rubber Gloves Market by End-use, 2022 - 2028, USD Million
- TABLE 537 Nigeria Rubber Gloves Market, 2018 - 2021, USD Million
- TABLE 538 Nigeria Rubber Gloves Market, 2022 - 2028, USD Million
- TABLE 539 Nigeria Rubber Gloves Market by Product, 2018 - 2021, USD Million
- TABLE 540 Nigeria Rubber Gloves Market by Product, 2022 - 2028, USD Million
- TABLE 541 Nigeria Rubber Gloves Market by Material, 2018 - 2021, USD Million
- TABLE 542 Nigeria Rubber Gloves Market by Material, 2022 - 2028, USD Million
- TABLE 543 Nigeria Rubber Gloves Market by Type, 2018 - 2021, USD Million
- TABLE 544 Nigeria Rubber Gloves Market by Type, 2022 - 2028, USD Million
- TABLE 545 Nigeria Rubber Gloves Market by Distribution Channel, 2018 - 2021, USD Million
- TABLE 546 Nigeria Rubber Gloves Market by Distribution Channel, 2022 - 2028, USD Million
- TABLE 547 Nigeria Rubber Gloves Market by End-use, 2018 - 2021, USD Million
- TABLE 548 Nigeria Rubber Gloves Market by End-use, 2022 - 2028, USD Million
- TABLE 549 Rest of LAMEA Rubber Gloves Market, 2018 - 2021, USD Million
- TABLE 550 Rest of LAMEA Rubber Gloves Market, 2022 - 2028, USD Million
- TABLE 551 Rest of LAMEA Rubber Gloves Market by Product, 2018 - 2021, USD Million
- TABLE 552 Rest of LAMEA Rubber Gloves Market by Product, 2022 - 2028, USD Million
- TABLE 553 Rest of LAMEA Rubber Gloves Market by Material, 2018 - 2021, USD Million
- TABLE 554 Rest of LAMEA Rubber Gloves Market by Material, 2022 - 2028, USD Million
- TABLE 555 Rest of LAMEA Rubber Gloves Market by Type, 2018 - 2021, USD Million
- TABLE 556 Rest of LAMEA Rubber Gloves Market by Type, 2022 - 2028, USD Million
- TABLE 557 Rest of LAMEA Rubber Gloves Market by Distribution Channel, 2018 - 2021, USD Million
- TABLE 558 Rest of LAMEA Rubber Gloves Market by Distribution Channel, 2022 - 2028, USD Million
- TABLE 559 Rest of LAMEA Rubber Gloves Market by End-use, 2018 - 2021, USD Million
- TABLE 560 Rest of LAMEA Rubber Gloves Market by End-use, 2022 - 2028, USD Million
- TABLE 561 Key Information - Ansell Ltd.
- TABLE 562 Key Information - Kimberly-Clark Corporation
- TABLE 563 Key Information - Unigloves (UK) Limited.
- TABLE 564 Key Information - MCR Safety
- TABLE 565 Key Information - Top Glove Corporation Bhd
- TABLE 566 Key Information - Hartalega Holdings Berhad
- TABLE 567 Key Information - The Glove Company
- TABLE 568 Key Information - Mapa Professional
- TABLE 569 Key Information - Adenna LLC
- TABLE 570 Key Information - Atlantic Safety Products, Inc.
List of Figures
- FIG 1 Methodology for the research
- FIG 2 Global Rubber Gloves Market Share by Product, 2021
- FIG 3 Global Rubber Gloves Market Share by Product, 2028
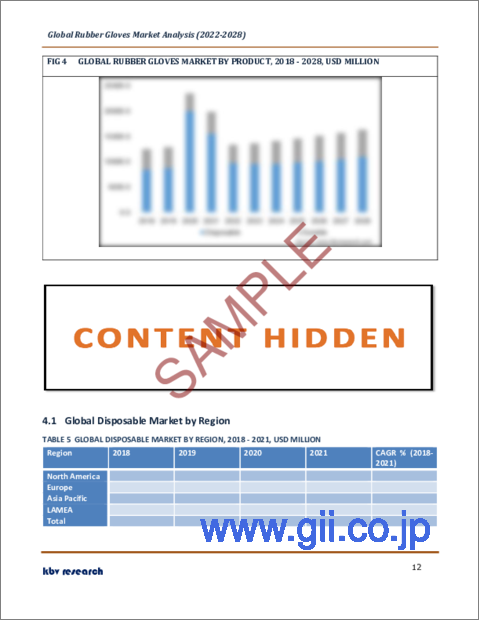
- FIG 4 Global Rubber Gloves Market by Product, 2018 - 2028, USD Million
- FIG 5 Global Rubber Gloves Market Share by Material, 2021
- FIG 6 Global Rubber Gloves Market Share by Material, 2028
- FIG 7 Global Rubber Gloves Market by Material, 2018 - 2028, USD Million
- FIG 8 Global Rubber Gloves Market Share by Type, 2021
- FIG 9 Global Rubber Gloves Market Share by Type, 2028
- FIG 10 Global Rubber Gloves Market by Type, 2018 - 2028, USD Million
- FIG 11 Global Rubber Gloves Market Share by Distribution Channel, 2021
- FIG 12 Global Rubber Gloves Market Share by Distribution Channel, 2028
- FIG 13 Global Rubber Gloves Market by Distribution Channel, 2018 - 2028, USD Million
- FIG 14 Global Rubber Gloves Market Share by End-use, 2021
- FIG 15 Global Rubber Gloves Market Share by End-use, 2028
- FIG 16 Global Rubber Gloves Market by End-use, 2018 - 2028, USD Million
- FIG 17 Global Rubber Gloves Market Share by Region, 2021
- FIG 18 Global Rubber Gloves Market Share by Region, 2028
- FIG 19 Global Rubber Gloves Market by Region, 2018 - 2028, USD Million
The Global Rubber Gloves Market size is expected to reach $16.4 billion by 2028, rising at a market growth of 3.5% CAGR during the forecast period.
Rubber gloves are created from either natural or synthetic rubber. The term 'rubber' refers to materials derived from natural or synthetic latex that are resilient, waterproof, and elastic. Rubber gloves may or may not be supported (rubber only) (rubber coating of textile glove). Its principal use is hand protection when conducting chemical-related duties.
During dishwashing, rubber gloves can be used to safeguard the hands from detergents and permit the use of hotter water. Occasionally, caregivers will use rubber gloves when changing a child's diaper to prevent contact with feces and urine. Rather than rubber gloves, medical practitioners utilize medical gloves during surgical procedures.
William Stewart Halsted, the first chief of surgery at Johns Hopkins Hospital, designed rubber gloves for his wife Caroline Hampton in 1894 after observing that her hands were affected by the daily surgeries she had performed and to prevent medical personnel from developing dermatitis from surgical chemicals. 1965 saw the invention of the first modern disposable glove by Ansell Rubber Co. Pty. Ltd.
Since the 1960s, rubber gloves have been used for dishwashing and cleaning the house. Traditional gloves are yellow or pink with long cuffs and have been manufactured in a variety of styles and hues. Even if they are still the most popular styles, users can get gloves that range in length from the wrist to the shoulders. There are also protective gloves that are pre-attached to blouses and bodysuits.
COVID - 19 Impact Analysis
The severe consequences of the coronavirus are already obvious and have influenced the market for rubber gloves in 2020. In December 2019, the World Health Organization issued a public health emergency due to the COVID-19 virus pandemic. The pandemic has spread to over 100 countries and has resulted in a worldwide death toll in the millions. Exports and imports, global manufacturing, tourism, and the financial industry have all sustained significant harm. Due to the COVID-19 pandemic, industrial glove sales have decreased. Various industrial manufacturing enterprises throughout the world have ceased production owing to a disruption in the supply of components and equipment caused by the lockdown, which has diminished the need for industrial gloves during the pandemic.
Market Growth Factors
Increased Demand from the Healthcare Industry and Other Medical Applications
It is because they prevent both patients and healthcare personnel from contracting infections, rubber gloves are mostly used in the healthcare industry. This provides the industry a significant influence on the market. Latex is made from natural rubber, and nitrile is a synthetic rubber that shields hands from bacteria, pathogens, and other environmental contaminants. Nitrile is also used for chemical processing and sanitizing solutions. The majority of physicians and other health care professionals prefer latex or nitrile rubber gloves.
Increasing Hygiene Standards among the consumers
As a result of the global pandemic, there has been a rise in awareness regarding hygiene and body care items such as rubber gloves, masks, and other personal protective equipment (PPE), which has led to an increase in sales of rubber gloves. For instance, The Top Gloves Corporation, an industry leader in the production of rubber gloves, would grow and promised to double the amount of money brought in over the next few years. As a result, new prospects have become available for producers in the market for rubber gloves.
Market Restraining Factors
Nitrile gloves have a low tactile sensitivity, which might potentially impede growth.
Nitrile Rubber is yet another type of synthetic rubber that ranks among the most popular applications found all over the world. The demand for it during World War II led to its creation as a solution. Applications that require resistance to oil, gas, and chemicals are the most typical places that will find them employed. Because of these characteristics, it is very valuable in the automobile sector, as well as in laboratory and culinary settings. It may be found in a wide range of machines as well as applications that are utilized daily.
Product Outlook
By Product, the Rubber Gloves Market is classified into Disposable, and Durable. The disposable segment garnered the highest revenue share in the rubber gloves market in 2021. It is because workers in the medical and food processing sectors are expected to have a high demand for disposable gloves since they must use many pairs of gloves for different operations and disposable gloves are designed for single use and are economical. The COVID-19 pandemic boosted the need for Personal Protective Equipment (PPE) items, such as disposable gloves, dramatically in 2020.
Material Outlook
Based on the Material, the Rubber Gloves Market is segmented into Natural Rubber/Latex, Nitrile, Neoprene, and Others. The neoprene segment witnessed a significant revenue share in the rubber gloves market in 2021. It is because neoprene-based gloves offer a stronger resistance to stretch, resulting in a superior fit and grip. These factors are anticipated to increase the demand for these items among food preparation employees, laboratory personnel, and medical personnel. In addition to butyl rubber, isoprene rubber, chloroprene, silicone rubber, and butyl rubber can be used to create rubber gloves.
Type Outlook
On the basis of Type, the Rubber Gloves Market is divided into Powdered, and Powder-free. The powdered segment recorded a substantial revenue share in the rubber gloves market in 2021. Increase as the powder makes gloves easier to wear and remove, improves grip, and reduces sweat and moisture. Calcium carbonate and cornstarch are the most often used powders. To avoid any type of skin infection, health authorities have imposed various limits on the use of powders in gloves, which are restricted by a few agencies, including the Food and Drug Administration of the United States.
Distribution Channel Outlook
Based on the Distribution Channel, the Rubber Gloves Market is bifurcated into Online and offline. The online segment witnessed a substantial revenue share in the rubber gloves market in 2021. As a result of the global COVID-19 pandemic, however, the adoption rate of online channels has increased dramatically, as governments in several countries implemented strict lockdowns and customers stayed indoors. During the pandemic, internet firms spent hard in growing their supply networks, maintaining low delivery costs, and achieving economies of scale.
End-Use Outlook
On the basis of End-use, the Rubber Gloves Market is fragmented into Medical & Healthcare, Automotive, Oil & Gas, Food & Beverage, Metal & Machinery, Chemical & Petrochemical, Pharmaceutical, Cleanroom, and Others. The food & beverages segment recorded a significant revenue share in the rubber gloves market in 2021. The usage of gloves is a frequent method for reducing bare-hand contact with food. Gloves are among the most commonly utilized personal protective equipment in the food business. Nearly all food service and food processing facilities have gloves on-site. Many of the gloves will be only one glove designed to prevent hand-to-food or food-to-surface contact.
Regional Outlook
Region-wise, the Rubber Gloves Market is analyzed across North America, Europe, Asia Pacific, and LAMEA. The Europe segment garnered the largest revenue share in the rubber gloves market in 2021. Due to the increased need for protective gloves in the food & beverage, metal manufacturing, oil & gas, automotive, and chemical industries, rubber gloves are in high demand in the area. In addition, because of the fast spread of COVID-19 in countries like Germany and Italy, there is an urgent demand for medical gloves. Greater public awareness of the significance of infection and communicable disease prevention can be attributed to the growth in medical and healthcare expenditures in North America.
The market research report covers the analysis of key stake holders of the market. Key companies profiled in the report include Ansell Ltd., Kimberly-Clark Corp., Unigloves Ltd., MCR Safety, Top Glove Corporation Bhd, Hartalega Holdings Berhad, The Glove Company, MAPA Professional, Adenna LLC and Atlantic Safety Products, Inc.
Strategies deployed in Rubber Gloves Market
2022-Jul: MCR Safety introduced MCR Safety's UltraTech 96902, an ecologically friendly glove made of a 15-gauge recycled PET and cotton fabric. The UltraTech 96902 glove is coated on the palm and fingertips with a compostable foam nitrile layer, creating this a fantastic Eco-friendly choice with excellent gripping power. Moreover, the comfortable and flexible knit wrist fits nicely and is latex-free.
2022-Apr: Unigloves introduced BioTouch, a new nitrile disposable glove. The BioTouch incorporates chemical resistance, ease, and grip with environmentally friendly, creative, biodegradable technology. Moreover, It is also consistent for usage with tablets, mobile, and touchscreen displays and has been tested to EN374 and EN1186, and are developed to medical quality standards.
2022-Jan: Kimberly-Clark launched nitrile gloves. The powder-free gloves are fabricated without vulcanization accelerators 1 or added sulfur and do not include natural rubber latex decreasing the risk of Type I and Type IV glove-linked skin reactions as well as shielding the application. Additionally, the new gloves are perfect for analysis and life sciences, production facilities, and non-sterile drug production applications.
2021-Mar: Ansell Limited completed the acquisition of the Primus brand, an Indian manufacturer and marketer of gloves. This acquisition aimed to increase Ansell's existence in this critical market and delivers the company the possibility to further propel the growth of the Life Sciences enterprise.
2019-Jun: Top Glove Corporation unveiled its flagship green product. The flagship product is an eco-friendly variant of disposable nitrile gloves developed to biodegrade in anaerobic conditions, such as in dumps.
Scope of the Study
Market Segments covered in the Report:
By Product
- Disposable
- Durable
By Material
- Natural Rubber/Latex
- Nitrile
- Neoprene
- Others
By Type
- Powdered
- Powder-free
By Distribution Channel
- Offline
- Online
By End-use
- Medical & Healthcare
- Automotive
- Chemical & Petrochemical
- Metal & Machinery
- Oil & Gas
- Pharmaceutical
- Cleanroom
- Food & Beverage
- Others
By Geography
- North America
- US
- Canada
- Mexico
- Rest of North America
- Europe
- Germany
- UK
- France
- Russia
- Spain
- Italy
- Rest of Europe
- Asia Pacific
- China
- Japan
- India
- South Korea
- Singapore
- Malaysia
- Rest of Asia Pacific
- LAMEA
- Brazil
- Argentina
- UAE
- Saudi Arabia
- South Africa
- Nigeria
- Rest of LAMEA
Companies Profiled
- Ansell Ltd.
- Kimberly-Clark Corp.
- Unigloves Ltd.
- MCR Safety
- Top Glove Corporation Bhd
- Hartalega Holdings Berhad
- The Glove Company
- MAPA Professional
- Adenna LLC
- Atlantic Safety Products, Inc.
Unique Offerings from KBV Research
- Exhaustive coverage
- Highest number of market tables and figures
- Subscription based model available
- Guaranteed best price
- Assured post sales research support with 10% customization free
Table of Contents
Chapter 1. Market Scope & Methodology
- 1.1 Market Definition
- 1.2 Objectives
- 1.3 Market Scope
- 1.4 Segmentation
- 1.4.1 Global Rubber Gloves Market, by Product
- 1.4.2 Global Rubber Gloves Market, by Material
- 1.4.3 Global Rubber Gloves Market, by Type
- 1.4.4 Global Rubber Gloves Market, by Distribution Channel
- 1.4.5 Global Rubber Gloves Market, by End-use
- 1.4.6 Global Rubber Gloves Market, by Geography
- 1.5 Methodology for the research
Chapter 2. Market Overview
- 2.1 Introduction
- 2.1.1 Overview
- 2.1.1.1 Market Composition & Scenarios
- 2.1.1 Overview
- 2.2 Key Factors Impacting the Market
- 2.2.1 Market Drivers
- 2.2.2 Market Restraints
Chapter 3. Strategies deployed in Rubber Gloves Market
Chapter 4. Global Rubber Gloves Market by Product
- 4.1 Global Disposable Market by Region
- 4.2 Global Durable Market by Region
Chapter 5. Global Rubber Gloves Market by Material
- 5.1 Global Natural Rubber/Latex Market by Region
- 5.2 Global Nitrile Market by Region
- 5.3 Global Neoprene Market by Region
- 5.4 Global Others Market by Region
Chapter 6. Global Rubber Gloves Market by Type
- 6.1 Global Powdered Market by Region
- 6.2 Global Powder-free Market by Region
Chapter 7. Global Rubber Gloves Market by Distribution Channel
- 7.1 Global Offline Market by Region
- 7.2 Global Online Market by Region
Chapter 8. Global Rubber Gloves Market by End-use
- 8.1 Global Medical & Healthcare Market by Region
- 8.2 Global Automotive Market by Region
- 8.3 Global Chemical & Petrochemical Market by Region
- 8.4 Global Metal & Machinery Market by Region
- 8.5 Global Oil & Gas Market by Region
- 8.6 Global Pharmaceutical Market by Region
- 8.7 Global Cleanroom Market by Region
- 8.8 Global Food & Beverage Market by Region
- 8.9 Global Others Market by Region
Chapter 9. Global Rubber Gloves Market by Region
- 9.1 North America Rubber Gloves Market
- 9.1.1 North America Rubber Gloves Market by Product
- 9.1.1.1 North America Disposable Market by Country
- 9.1.1.2 North America Durable Market by Country
- 9.1.2 North America Rubber Gloves Market by Material
- 9.1.2.1 North America Natural Rubber/Latex Market by Country
- 9.1.2.2 North America Nitrile Market by Country
- 9.1.2.3 North America Neoprene Market by Country
- 9.1.2.4 North America Others Market by Country
- 9.1.3 North America Rubber Gloves Market by Type
- 9.1.3.1 North America Powdered Market by Country
- 9.1.3.2 North America Powder-free Market by Country
- 9.1.4 North America Rubber Gloves Market by Distribution Channel
- 9.1.4.1 North America Offline Market by Country
- 9.1.4.2 North America Online Market by Country
- 9.1.5 North America Rubber Gloves Market by End-use
- 9.1.5.1 North America Medical & Healthcare Market by Country
- 9.1.5.2 North America Automotive Market by Country
- 9.1.5.3 North America Chemical & Petrochemical Market by Country
- 9.1.5.4 North America Metal & Machinery Market by Country
- 9.1.5.5 North America Oil & Gas Market by Country
- 9.1.5.6 North America Pharmaceutical Market by Country
- 9.1.5.7 North America Cleanroom Market by Country
- 9.1.5.8 North America Food & Beverage Market by Country
- 9.1.5.9 North America Others Market by Country
- 9.1.6 North America Rubber Gloves Market by Country
- 9.1.6.1 US Rubber Gloves Market
- 9.1.6.1.1 US Rubber Gloves Market by Product
- 9.1.6.1.2 US Rubber Gloves Market by Material
- 9.1.6.1.3 US Rubber Gloves Market by Type
- 9.1.6.1.4 US Rubber Gloves Market by Distribution Channel
- 9.1.6.1.5 US Rubber Gloves Market by End-use
- 9.1.6.2 Canada Rubber Gloves Market
- 9.1.6.2.1 Canada Rubber Gloves Market by Product
- 9.1.6.2.2 Canada Rubber Gloves Market by Material
- 9.1.6.2.3 Canada Rubber Gloves Market by Type
- 9.1.6.2.4 Canada Rubber Gloves Market by Distribution Channel
- 9.1.6.2.5 Canada Rubber Gloves Market by End-use
- 9.1.6.3 Mexico Rubber Gloves Market
- 9.1.6.3.1 Mexico Rubber Gloves Market by Product
- 9.1.6.3.2 Mexico Rubber Gloves Market by Material
- 9.1.6.3.3 Mexico Rubber Gloves Market by Type
- 9.1.6.3.4 Mexico Rubber Gloves Market by Distribution Channel
- 9.1.6.3.5 Mexico Rubber Gloves Market by End-use
- 9.1.6.4 Rest of North America Rubber Gloves Market
- 9.1.6.4.1 Rest of North America Rubber Gloves Market by Product
- 9.1.6.4.2 Rest of North America Rubber Gloves Market by Material
- 9.1.6.4.3 Rest of North America Rubber Gloves Market by Type
- 9.1.6.4.4 Rest of North America Rubber Gloves Market by Distribution Channel
- 9.1.6.4.5 Rest of North America Rubber Gloves Market by End-use
- 9.1.6.1 US Rubber Gloves Market
- 9.1.1 North America Rubber Gloves Market by Product
- 9.2 Europe Rubber Gloves Market
- 9.2.1 Europe Rubber Gloves Market by Product
- 9.2.1.1 Europe Disposable Market by Country
- 9.2.1.2 Europe Durable Market by Country
- 9.2.2 Europe Rubber Gloves Market by Material
- 9.2.2.1 Europe Natural Rubber/Latex Market by Country
- 9.2.2.2 Europe Nitrile Market by Country
- 9.2.2.3 Europe Neoprene Market by Country
- 9.2.2.4 Europe Others Market by Country
- 9.2.3 Europe Rubber Gloves Market by Type
- 9.2.3.1 Europe Powdered Market by Country
- 9.2.3.2 Europe Powder-free Market by Country
- 9.2.4 Europe Rubber Gloves Market by Distribution Channel
- 9.2.4.1 Europe Offline Market by Country
- 9.2.4.2 Europe Online Market by Country
- 9.2.5 Europe Rubber Gloves Market by End-use
- 9.2.5.1 Europe Medical & Healthcare Market by Country
- 9.2.5.2 Europe Automotive Market by Country
- 9.2.5.3 Europe Chemical & Petrochemical Market by Country
- 9.2.5.4 Europe Metal & Machinery Market by Country
- 9.2.5.5 Europe Oil & Gas Market by Country
- 9.2.5.6 Europe Pharmaceutical Market by Country
- 9.2.5.7 Europe Cleanroom Market by Country
- 9.2.5.8 Europe Food & Beverage Market by Country
- 9.2.5.9 Europe Others Market by Country
- 9.2.6 Europe Rubber Gloves Market by Country
- 9.2.6.1 Germany Rubber Gloves Market
- 9.2.6.1.1 Germany Rubber Gloves Market by Product
- 9.2.6.1.2 Germany Rubber Gloves Market by Material
- 9.2.6.1.3 Germany Rubber Gloves Market by Type
- 9.2.6.1.4 Germany Rubber Gloves Market by Distribution Channel
- 9.2.6.1.5 Germany Rubber Gloves Market by End-use
- 9.2.6.2 UK Rubber Gloves Market
- 9.2.6.2.1 UK Rubber Gloves Market by Product
- 9.2.6.2.2 UK Rubber Gloves Market by Material
- 9.2.6.2.3 UK Rubber Gloves Market by Type
- 9.2.6.2.4 UK Rubber Gloves Market by Distribution Channel
- 9.2.6.2.5 UK Rubber Gloves Market by End-use
- 9.2.6.3 France Rubber Gloves Market
- 9.2.6.3.1 France Rubber Gloves Market by Product
- 9.2.6.3.2 France Rubber Gloves Market by Material
- 9.2.6.3.3 France Rubber Gloves Market by Type
- 9.2.6.3.4 France Rubber Gloves Market by Distribution Channel
- 9.2.6.3.5 France Rubber Gloves Market by End-use
- 9.2.6.4 Russia Rubber Gloves Market
- 9.2.6.4.1 Russia Rubber Gloves Market by Product
- 9.2.6.4.2 Russia Rubber Gloves Market by Material
- 9.2.6.4.3 Russia Rubber Gloves Market by Type
- 9.2.6.4.4 Russia Rubber Gloves Market by Distribution Channel
- 9.2.6.4.5 Russia Rubber Gloves Market by End-use
- 9.2.6.5 Spain Rubber Gloves Market
- 9.2.6.5.1 Spain Rubber Gloves Market by Product
- 9.2.6.5.2 Spain Rubber Gloves Market by Material
- 9.2.6.5.3 Spain Rubber Gloves Market by Type
- 9.2.6.5.4 Spain Rubber Gloves Market by Distribution Channel
- 9.2.6.5.5 Spain Rubber Gloves Market by End-use
- 9.2.6.6 Italy Rubber Gloves Market
- 9.2.6.6.1 Italy Rubber Gloves Market by Product
- 9.2.6.6.2 Italy Rubber Gloves Market by Material
- 9.2.6.6.3 Italy Rubber Gloves Market by Type
- 9.2.6.6.4 Italy Rubber Gloves Market by Distribution Channel
- 9.2.6.6.5 Italy Rubber Gloves Market by End-use
- 9.2.6.7 Rest of Europe Rubber Gloves Market
- 9.2.6.7.1 Rest of Europe Rubber Gloves Market by Product
- 9.2.6.7.2 Rest of Europe Rubber Gloves Market by Material
- 9.2.6.7.3 Rest of Europe Rubber Gloves Market by Type
- 9.2.6.7.4 Rest of Europe Rubber Gloves Market by Distribution Channel
- 9.2.6.7.5 Rest of Europe Rubber Gloves Market by End-use
- 9.2.6.1 Germany Rubber Gloves Market
- 9.2.1 Europe Rubber Gloves Market by Product
- 9.3 Asia Pacific Rubber Gloves Market
- 9.3.1 Asia Pacific Rubber Gloves Market by Product
- 9.3.1.1 Asia Pacific Disposable Market by Country
- 9.3.1.2 Asia Pacific Durable Market by Country
- 9.3.2 Asia Pacific Rubber Gloves Market by Material
- 9.3.2.1 Asia Pacific Natural Rubber/Latex Market by Country
- 9.3.2.2 Asia Pacific Nitrile Market by Country
- 9.3.2.3 Asia Pacific Neoprene Market by Country
- 9.3.2.4 Asia Pacific Others Market by Country
- 9.3.3 Asia Pacific Rubber Gloves Market by Type
- 9.3.3.1 Asia Pacific Powdered Market by Country
- 9.3.3.2 Asia Pacific Powder-free Market by Country
- 9.3.4 Asia Pacific Rubber Gloves Market by Distribution Channel
- 9.3.4.1 Asia Pacific Offline Market by Country
- 9.3.4.2 Asia Pacific Online Market by Country
- 9.3.5 Asia Pacific Rubber Gloves Market by End-use
- 9.3.5.1 Asia Pacific Medical & Healthcare Market by Country
- 9.3.5.2 Asia Pacific Automotive Market by Country
- 9.3.5.3 Asia Pacific Chemical & Petrochemical Market by Country
- 9.3.5.4 Asia Pacific Metal & Machinery Market by Country
- 9.3.5.5 Asia Pacific Oil & Gas Market by Country
- 9.3.5.6 Asia Pacific Pharmaceutical Market by Country
- 9.3.5.7 Asia Pacific Cleanroom Market by Country
- 9.3.5.8 Asia Pacific Food & Beverage Market by Country
- 9.3.5.9 Asia Pacific Others Market by Country
- 9.3.6 Asia Pacific Rubber Gloves Market by Country
- 9.3.6.1 China Rubber Gloves Market
- 9.3.6.1.1 China Rubber Gloves Market by Product
- 9.3.6.1.2 China Rubber Gloves Market by Material
- 9.3.6.1.3 China Rubber Gloves Market by Type
- 9.3.6.1.4 China Rubber Gloves Market by Distribution Channel
- 9.3.6.1.5 China Rubber Gloves Market by End-use
- 9.3.6.2 Japan Rubber Gloves Market
- 9.3.6.2.1 Japan Rubber Gloves Market by Product
- 9.3.6.2.2 Japan Rubber Gloves Market by Material
- 9.3.6.2.3 Japan Rubber Gloves Market by Type
- 9.3.6.2.4 Japan Rubber Gloves Market by Distribution Channel
- 9.3.6.2.5 Japan Rubber Gloves Market by End-use
- 9.3.6.3 India Rubber Gloves Market
- 9.3.6.3.1 India Rubber Gloves Market by Product
- 9.3.6.3.2 India Rubber Gloves Market by Material
- 9.3.6.3.3 India Rubber Gloves Market by Type
- 9.3.6.3.4 India Rubber Gloves Market by Distribution Channel
- 9.3.6.3.5 India Rubber Gloves Market by End-use
- 9.3.6.4 South Korea Rubber Gloves Market
- 9.3.6.4.1 South Korea Rubber Gloves Market by Product
- 9.3.6.4.2 South Korea Rubber Gloves Market by Material
- 9.3.6.4.3 South Korea Rubber Gloves Market by Type
- 9.3.6.4.4 South Korea Rubber Gloves Market by Distribution Channel
- 9.3.6.4.5 South Korea Rubber Gloves Market by End-use
- 9.3.6.5 Singapore Rubber Gloves Market
- 9.3.6.5.1 Singapore Rubber Gloves Market by Product
- 9.3.6.5.2 Singapore Rubber Gloves Market by Material
- 9.3.6.5.3 Singapore Rubber Gloves Market by Type
- 9.3.6.5.4 Singapore Rubber Gloves Market by Distribution Channel
- 9.3.6.5.5 Singapore Rubber Gloves Market by End-use
- 9.3.6.6 Malaysia Rubber Gloves Market
- 9.3.6.6.1 Malaysia Rubber Gloves Market by Product
- 9.3.6.6.2 Malaysia Rubber Gloves Market by Material
- 9.3.6.6.3 Malaysia Rubber Gloves Market by Type
- 9.3.6.6.4 Malaysia Rubber Gloves Market by Distribution Channel
- 9.3.6.6.5 Malaysia Rubber Gloves Market by End-use
- 9.3.6.7 Rest of Asia Pacific Rubber Gloves Market
- 9.3.6.7.1 Rest of Asia Pacific Rubber Gloves Market by Product
- 9.3.6.7.2 Rest of Asia Pacific Rubber Gloves Market by Material
- 9.3.6.7.3 Rest of Asia Pacific Rubber Gloves Market by Type
- 9.3.6.7.4 Rest of Asia Pacific Rubber Gloves Market by Distribution Channel
- 9.3.6.7.5 Rest of Asia Pacific Rubber Gloves Market by End-use
- 9.3.6.1 China Rubber Gloves Market
- 9.3.1 Asia Pacific Rubber Gloves Market by Product
- 9.4 LAMEA Rubber Gloves Market
- 9.4.1 LAMEA Rubber Gloves Market by Product
- 9.4.1.1 LAMEA Disposable Market by Country
- 9.4.1.2 LAMEA Durable Market by Country
- 9.4.2 LAMEA Rubber Gloves Market by Material
- 9.4.2.1 LAMEA Natural Rubber/Latex Market by Country
- 9.4.2.2 LAMEA Nitrile Market by Country
- 9.4.2.3 LAMEA Neoprene Market by Country
- 9.4.2.4 LAMEA Others Market by Country
- 9.4.3 LAMEA Rubber Gloves Market by Type
- 9.4.3.1 LAMEA Powdered Market by Country
- 9.4.3.2 LAMEA Powder-free Market by Country
- 9.4.4 LAMEA Rubber Gloves Market by Distribution Channel
- 9.4.4.1 LAMEA Offline Market by Country
- 9.4.4.2 LAMEA Online Market by Country
- 9.4.5 LAMEA Rubber Gloves Market by End-use
- 9.4.5.1 LAMEA Medical & Healthcare Market by Country
- 9.4.5.2 LAMEA Automotive Market by Country
- 9.4.5.3 LAMEA Chemical & Petrochemical Market by Country
- 9.4.5.4 LAMEA Metal & Machinery Market by Country
- 9.4.5.5 LAMEA Oil & Gas Market by Country
- 9.4.5.6 LAMEA Pharmaceutical Market by Country
- 9.4.5.7 LAMEA Cleanroom Market by Country
- 9.4.5.8 LAMEA Food & Beverage Market by Country
- 9.4.5.9 LAMEA Others Market by Country
- 9.4.6 LAMEA Rubber Gloves Market by Country
- 9.4.6.1 Brazil Rubber Gloves Market
- 9.4.6.1.1 Brazil Rubber Gloves Market by Product
- 9.4.6.1.2 Brazil Rubber Gloves Market by Material
- 9.4.6.1.3 Brazil Rubber Gloves Market by Type
- 9.4.6.1.4 Brazil Rubber Gloves Market by Distribution Channel
- 9.4.6.1.5 Brazil Rubber Gloves Market by End-use
- 9.4.6.2 Argentina Rubber Gloves Market
- 9.4.6.2.1 Argentina Rubber Gloves Market by Product
- 9.4.6.2.2 Argentina Rubber Gloves Market by Material
- 9.4.6.2.3 Argentina Rubber Gloves Market by Type
- 9.4.6.2.4 Argentina Rubber Gloves Market by Distribution Channel
- 9.4.6.2.5 Argentina Rubber Gloves Market by End-use
- 9.4.6.3 UAE Rubber Gloves Market
- 9.4.6.3.1 UAE Rubber Gloves Market by Product
- 9.4.6.3.2 UAE Rubber Gloves Market by Material
- 9.4.6.3.3 UAE Rubber Gloves Market by Type
- 9.4.6.3.4 UAE Rubber Gloves Market by Distribution Channel
- 9.4.6.3.5 UAE Rubber Gloves Market by End-use
- 9.4.6.4 Saudi Arabia Rubber Gloves Market
- 9.4.6.4.1 Saudi Arabia Rubber Gloves Market by Product
- 9.4.6.4.2 Saudi Arabia Rubber Gloves Market by Material
- 9.4.6.4.3 Saudi Arabia Rubber Gloves Market by Type
- 9.4.6.4.4 Saudi Arabia Rubber Gloves Market by Distribution Channel
- 9.4.6.4.5 Saudi Arabia Rubber Gloves Market by End-use
- 9.4.6.5 South Africa Rubber Gloves Market
- 9.4.6.5.1 South Africa Rubber Gloves Market by Product
- 9.4.6.5.2 South Africa Rubber Gloves Market by Material
- 9.4.6.5.3 South Africa Rubber Gloves Market by Type
- 9.4.6.5.4 South Africa Rubber Gloves Market by Distribution Channel
- 9.4.6.5.5 South Africa Rubber Gloves Market by End-use
- 9.4.6.6 Nigeria Rubber Gloves Market
- 9.4.6.6.1 Nigeria Rubber Gloves Market by Product
- 9.4.6.6.2 Nigeria Rubber Gloves Market by Material
- 9.4.6.6.3 Nigeria Rubber Gloves Market by Type
- 9.4.6.6.4 Nigeria Rubber Gloves Market by Distribution Channel
- 9.4.6.6.5 Nigeria Rubber Gloves Market by End-use
- 9.4.6.7 Rest of LAMEA Rubber Gloves Market
- 9.4.6.7.1 Rest of LAMEA Rubber Gloves Market by Product
- 9.4.6.7.2 Rest of LAMEA Rubber Gloves Market by Material
- 9.4.6.7.3 Rest of LAMEA Rubber Gloves Market by Type
- 9.4.6.7.4 Rest of LAMEA Rubber Gloves Market by Distribution Channel
- 9.4.6.7.5 Rest of LAMEA Rubber Gloves Market by End-use
- 9.4.6.1 Brazil Rubber Gloves Market
- 9.4.1 LAMEA Rubber Gloves Market by Product
Chapter 10. Company Profiles
- 10.1 Ansell Ltd.
- 10.1.1 Company Overview
- 10.1.2 Financial Analysis
- 10.1.3 Segmental and Regional Analysis
- 10.1.4 Research & Development Expenses
- 10.1.5 Recent strategies and developments:
- 10.1.5.1 Acquisition and Mergers:
- 10.2 Kimberly-Clark Corporation
- 10.2.1 Company Overview
- 10.2.2 Financial Analysis
- 10.2.3 Segmental and Regional Analysis
- 10.2.4 Research & Development Expenses
- 10.2.5 Recent strategies and developments:
- 10.2.5.1 Product Launches and Product Expansions:
- 10.3 Unigloves (UK) Limited.
- 10.3.1 Company Overview
- 10.3.2 Recent strategies and developments:
- 10.3.2.1 Product Launches and Product Expansions:
- 10.4 MCR Safety
- 10.4.1 Company Overview
- 10.4.2 Recent strategies and developments:
- 10.4.2.1 Product Launches and Product Expansions:
- 10.5 Top Glove Corporation Bhd
- 10.5.1 Company Overview
- 10.5.2 Financial Analysis
- 10.5.3 Regional Analysis
- 10.5.4 Recent strategies and developments:
- 10.5.4.1 Product Launches and Product Expansions:
- 10.6 Hartalega Holdings Berhad
- 10.6.1 Company Overview
- 10.6.2 Financial Analysis
- 10.6.3 Regional Analysis
- 10.7 The Glove Company
- 10.7.1 Company Overview
- 10.8 Mapa Professional (Newell Brands, Inc.)
- 10.8.1 Company Overview
- 10.8.2 Financial Analysis
- 10.8.3 Segmental and Regional Analysis
- 10.8.4 Research & Development Expenses
- 10.9 Adenna LLC
- 10.9.1 Company Overview
- 10.10. Atlantic Safety Products, Inc.
- 10.10.1 Company Overview