|
|
市場調査レポート
商品コード
1127051
水質監視システムの世界市場規模、シェア、産業動向分析レポート:コンポーネント別、アプリケーション別、地域別展望と予測、2022年~2028年Global Water Quality Monitoring Systems Market Size, Share & Industry Trends Analysis Report By Component, By Application, By Regional Outlook and Forecast, 2022 - 2028 |
||||||
|
|
|||||||


| 水質監視システムの世界市場規模、シェア、産業動向分析レポート:コンポーネント別、アプリケーション別、地域別展望と予測、2022年~2028年 |
|
出版日: 2022年08月31日
発行: KBV Research
ページ情報: 英文 201 Pages
納期: 即納可能
|
- 全表示
- 概要
- 図表
- 目次
水質監視システムの世界市場規模は、予測期間中にCAGR8.3%の市場成長率で上昇し、2028年には75億米ドルに達すると予測されます。
工業化に伴う水質汚染の増加、水系伝染病の流行、政府規制の強化などが、水質モニタリングシステム市場の主な成長要因となっています。水質を分析するために、新しいセンサーが開発されています。溶存酸素センサー、濁度センサー、導電率センサー、pHセンサー、塩素センサー、ORPセンサー、温度センサーなどです。
配水システムは、オンライン水質監視(OWQM)センサーやその他の分析ツールによって監視されています。予測期間中は、新技術や独創的な技術の採用により、水質監視システムの需要や普及が進むと予想されます。主要な市場促進要因の1つは、飲料水の品質に悪影響を及ぼす汚染の増加です。
汚染の増加がもたらす気候変動の結果、暴風雨、干ばつ、洪水がより一般的になってきています。その結果、公共施設の修理や改修プロジェクトは遅滞または延期されます。このような場合、電力会社はエンドユーザーのニーズに対応する必要があります。その結果、多くのユーティリティ企業が水質を監視するシステムを導入しています。
COVID-19影響分析
施錠処置、人手不足、サプライチェーンの混乱により、パイプライン・モニタリング・システムの生産設備が完全に、あるいは部分的に停止しました。この結果、水質監視システムの生産に影響が出る。これらの分野では、封鎖期間中の通常業務の停止により、石油、上下水道などのエンドユーザーからの需要が大幅に減少しました。
市場の成長要因
幅広い用途に対応した厳格な水質基準試験
環境保護庁(EPA)、欧州飲料水指令、オーストラリア飲料水ガイドライン、中国GB3838-2002など、多くの国際機関が水利用における厳しい品質試験のガイドラインとパラメータを追求しています。これらの基準を採用していない国は、世界保健機関(WHO)の勧告を遵守しています。すべての企業やエンドユーザーはこれらの規則を遵守しなければならず、その一環として、水質検査ツールを使用して水質を判断する必要があります。
廃水処理の必要性の高まり
生産活動の活発化に伴い、水の浪費は先進国、途上国を問わず大きな問題となっています。水と天然資源を保護するために、多くの政府や非政府組織が多大な努力を払っています。世界では、多くの人々が微生物に汚染された水を消費しており、コレラ、腸チフス、赤痢、ポリオなどの疾病につながる可能性があります。
市場の抑制要因
モニタリングシステムは一般的に高価である
水質監視システムは、初期購入費、消耗品や交換部品などの運用費、メンテナンス費などが、所有コストに含まれます。また、標準的な薬液や試薬の調製には消耗品費がかかります。また、装置全体のコストのうち、分析装置のメンテナンスにかかる費用はかなりの部分を占めています。スペアパーツの在庫管理と工場での修理は、校正の次に大きな所有コストの構成要素です。
コンポーネントの見通し
水質監視システム市場は、コンポーネントによって、pHセンサ、DOセンサ、温度センサ、濁度センサ、その他に区分されます。DOセンサセグメントは、2021年に水質モニタリングシステム市場で大きな収益シェアを獲得しました。DOセンサは、酸素の存在下で発光が消光することに基づいて、水中の溶存酸素濃度を測定するために利用されます。酸素は発光の強度と寿命の両方に影響を与えるため、DOセンサーは発光の強度と寿命のいずれかを測定することができます。
アプリケーションの展望
水質監視システムの市場は、用途別に住宅、商業、工業、ユーティリティに分類されます。2021年の水質監視システム市場では、産業用セグメントがかなりの収益シェアを占めています。石油・ガスや化学など、さまざまな産業で効率的な廃水処理モニタリングのために、さまざまなタイプの分析装置が利用されています。さらに、産業廃水は、一般市民向けの下水処理施設に直接廃棄される前に前処理を受ける必要があります。
地域別の展望
地域別に見ると、水質監視システム市場は北米、欧州、アジア太平洋、LAMEAで分析されています。2021年には、北米地域が最大の収益シェアで水質監視システム市場をリードしました。これは、現代技術の使用、新興経済諸国の存在、さらに製造業や産業活動の上昇に起因するものです。また、同地域のいくつかの国の政府による厳しい規制が、同地域の市場成長を支えています。
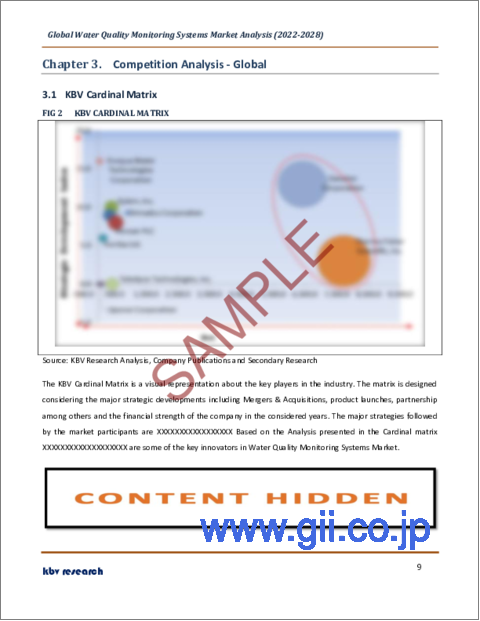
市場参加者がとっている主な戦略は、製品の上市です。カーディナルマトリックスで提示された分析に基づいて、Danaher CorporationとThermo Fisher Scientific, Inc.は、水質監視システム市場の先駆者です。Evoqua Water Technologies Corporation、Shimadzu Corporation、Xylem, Inc.などの企業は、水質監視システム市場の主要な革新者の一部です。
目次
第1章 市場範囲と調査手法
- 市場の定義
- 目的
- 市場規模
- セグメンテーション
- 水質監視システムの世界市場、コンポーネント別
- 水質監視システムの世界市場、アプリケーション別
- 水質監視システムの世界市場、地域別
- 調査手法
第2章 市場概要
- イントロダクション
- 概要説明
- 市場の構成とシナリオ
- 概要説明
- 市場に影響を与える主な要因
- 市場促進要因
- 市場の抑制要因
第3章 競合分析-世界
- KBVカーディナルマトリックス
- 最近の業界全体の戦略的展開
- パートナーシップ、コラボレーション、契約
- 製品上市と製品拡張
- 買収と合併
- 地理的拡大
- 主要成功戦略
- 主要なリーディング戦略:パーセンテージ分布(2018-2022)
- 主要な戦略的動き:(製品発表と製品拡張:2018年、11月~2022年、8月)主要なプレイヤーたち
第4章 水質監視システムの世界市場:コンポーネント別
- pHセンサーの世界市場:地域別
- DOセンサーの世界市場:地域別
- 濁度センサーの世界市場:地域別
- 温度センサーの地域別世界市場
- その他の地域別世界市場
第5章 水質監視システムの世界市場:アプリケーション別
- ユーティリティの世界市場:地域別
- 工業用品の世界市場:地域別
- 商業施設の世界市場:地域別
- 住宅用品の世界市場:地域別
第6章 水質監視システムの世界市場:地域別
- 北米
- 北米の水質監視システムの国別市場
- 米国
- カナダ
- メキシコ
- 北米以外の地域
- 北米の水質監視システムの国別市場
- 欧州
- 欧州水質監視システム市場:国別
- ドイツ
- 英国
- フランス
- ロシア
- スペイン
- イタリア
- その他欧州
- 欧州水質監視システム市場:国別
- アジア太平洋地域
- アジア太平洋地域の水質監視システムの国別市場
- 中国
- 日本
- インド
- 韓国
- シンガポール
- マレーシア
- その他アジア太平洋地域
- アジア太平洋地域の水質監視システムの国別市場
- LAMEA
- LAMEA水質監視システムの国別市場
- ブラジル
- アルゼンチン
- UAE
- サウジアラビア
- 南アフリカ
- ナイジェリア
- その他のLAMEA
- LAMEA水質監視システムの国別市場
第7章 企業プロファイル
- General Electric(GE)Co.
- Horiba Ltd.
- Danaher Corporation
- Evoqua Water Technologies Corporation
- Xylem, Inc.
- Shimadzu Corporation
- Pentair PLC
- Thermo Fisher Scientific, Inc.
- Uponor Corporation
- Teledyne Technologies, Inc.
LIST OF TABLES
- TABLE 1 Global Water Quality Monitoring Systems Market, 2018 - 2021, USD Million
- TABLE 2 Global Water Quality Monitoring Systems Market, 2022 - 2028, USD Million
- TABLE 3 Partnerships, Collaborations and Agreements- Water Quality Monitoring Systems Market
- TABLE 4 Product Launches And Product Expansions- Water Quality Monitoring Systems Market
- TABLE 5 Acquisition and Mergers- Water Quality Monitoring Systems Market
- TABLE 6 geographical expansions- Water Quality Monitoring Systems Market
- TABLE 7 Global Water Quality Monitoring Systems Market by Component, 2018 - 2021, USD Million
- TABLE 8 Global Water Quality Monitoring Systems Market by Component, 2022 - 2028, USD Million
- TABLE 9 Global pH Sensors Market by Region, 2018 - 2021, USD Million
- TABLE 10 Global pH Sensors Market by Region, 2022 - 2028, USD Million
- TABLE 11 Global DO Sensors Market by Region, 2018 - 2021, USD Million
- TABLE 12 Global DO Sensors Market by Region, 2022 - 2028, USD Million
- TABLE 13 Global Turbidity Sensors Market by Region, 2018 - 2021, USD Million
- TABLE 14 Global Turbidity Sensors Market by Region, 2022 - 2028, USD Million
- TABLE 15 Global Temperature Sensors Market by Region, 2018 - 2021, USD Million
- TABLE 16 Global Temperature Sensors Market by Region, 2022 - 2028, USD Million
- TABLE 17 Global Others Market by Region, 2018 - 2021, USD Million
- TABLE 18 Global Others Market by Region, 2022 - 2028, USD Million
- TABLE 19 Global Water Quality Monitoring Systems Market by Application, 2018 - 2021, USD Million
- TABLE 20 Global Water Quality Monitoring Systems Market by Application, 2022 - 2028, USD Million
- TABLE 21 Global Utility Market by Region, 2018 - 2021, USD Million
- TABLE 22 Global Utility Market by Region, 2022 - 2028, USD Million
- TABLE 23 Global Industrial Market by Region, 2018 - 2021, USD Million
- TABLE 24 Global Industrial Market by Region, 2022 - 2028, USD Million
- TABLE 25 Global Commercial Market by Region, 2018 - 2021, USD Million
- TABLE 26 Global Commercial Market by Region, 2022 - 2028, USD Million
- TABLE 27 Global Residential Market by Region, 2018 - 2021, USD Million
- TABLE 28 Global Residential Market by Region, 2022 - 2028, USD Million
- TABLE 29 Global Water Quality Monitoring Systems Market by Region, 2018 - 2021, USD Million
- TABLE 30 Global Water Quality Monitoring Systems Market by Region, 2022 - 2028, USD Million
- TABLE 31 North America Water Quality Monitoring Systems Market, 2018 - 2021, USD Million
- TABLE 32 North America Water Quality Monitoring Systems Market, 2022 - 2028, USD Million
- TABLE 33 North America Water Quality Monitoring Systems Market by Component, 2018 - 2021, USD Million
- TABLE 34 North America Water Quality Monitoring Systems Market by Component, 2022 - 2028, USD Million
- TABLE 35 North America pH Sensors Market by Country, 2018 - 2021, USD Million
- TABLE 36 North America pH Sensors Market by Country, 2022 - 2028, USD Million
- TABLE 37 North America DO Sensors Market by Country, 2018 - 2021, USD Million
- TABLE 38 North America DO Sensors Market by Country, 2022 - 2028, USD Million
- TABLE 39 North America Turbidity Sensors Market by Country, 2018 - 2021, USD Million
- TABLE 40 North America Turbidity Sensors Market by Country, 2022 - 2028, USD Million
- TABLE 41 North America Temperature Sensors Market by Country, 2018 - 2021, USD Million
- TABLE 42 North America Temperature Sensors Market by Country, 2022 - 2028, USD Million
- TABLE 43 North America Others Market by Country, 2018 - 2021, USD Million
- TABLE 44 North America Others Market by Country, 2022 - 2028, USD Million
- TABLE 45 North America Water Quality Monitoring Systems Market by Application, 2018 - 2021, USD Million
- TABLE 46 North America Water Quality Monitoring Systems Market by Application, 2022 - 2028, USD Million
- TABLE 47 North America Utility Market by Country, 2018 - 2021, USD Million
- TABLE 48 North America Utility Market by Country, 2022 - 2028, USD Million
- TABLE 49 North America Industrial Market by Country, 2018 - 2021, USD Million
- TABLE 50 North America Industrial Market by Country, 2022 - 2028, USD Million
- TABLE 51 North America Commercial Market by Country, 2018 - 2021, USD Million
- TABLE 52 North America Commercial Market by Country, 2022 - 2028, USD Million
- TABLE 53 North America Residential Market by Country, 2018 - 2021, USD Million
- TABLE 54 North America Residential Market by Country, 2022 - 2028, USD Million
- TABLE 55 North America Water Quality Monitoring Systems Market by Country, 2018 - 2021, USD Million
- TABLE 56 North America Water Quality Monitoring Systems Market by Country, 2022 - 2028, USD Million
- TABLE 57 US Water Quality Monitoring Systems Market, 2018 - 2021, USD Million
- TABLE 58 US Water Quality Monitoring Systems Market, 2022 - 2028, USD Million
- TABLE 59 US Water Quality Monitoring Systems Market by Component, 2018 - 2021, USD Million
- TABLE 60 US Water Quality Monitoring Systems Market by Component, 2022 - 2028, USD Million
- TABLE 61 US Water Quality Monitoring Systems Market by Application, 2018 - 2021, USD Million
- TABLE 62 US Water Quality Monitoring Systems Market by Application, 2022 - 2028, USD Million
- TABLE 63 Canada Water Quality Monitoring Systems Market, 2018 - 2021, USD Million
- TABLE 64 Canada Water Quality Monitoring Systems Market, 2022 - 2028, USD Million
- TABLE 65 Canada Water Quality Monitoring Systems Market by Component, 2018 - 2021, USD Million
- TABLE 66 Canada Water Quality Monitoring Systems Market by Component, 2022 - 2028, USD Million
- TABLE 67 Canada Water Quality Monitoring Systems Market by Application, 2018 - 2021, USD Million
- TABLE 68 Canada Water Quality Monitoring Systems Market by Application, 2022 - 2028, USD Million
- TABLE 69 Mexico Water Quality Monitoring Systems Market, 2018 - 2021, USD Million
- TABLE 70 Mexico Water Quality Monitoring Systems Market, 2022 - 2028, USD Million
- TABLE 71 Mexico Water Quality Monitoring Systems Market by Component, 2018 - 2021, USD Million
- TABLE 72 Mexico Water Quality Monitoring Systems Market by Component, 2022 - 2028, USD Million
- TABLE 73 Mexico Water Quality Monitoring Systems Market by Application, 2018 - 2021, USD Million
- TABLE 74 Mexico Water Quality Monitoring Systems Market by Application, 2022 - 2028, USD Million
- TABLE 75 Rest of North America Water Quality Monitoring Systems Market, 2018 - 2021, USD Million
- TABLE 76 Rest of North America Water Quality Monitoring Systems Market, 2022 - 2028, USD Million
- TABLE 77 Rest of North America Water Quality Monitoring Systems Market by Component, 2018 - 2021, USD Million
- TABLE 78 Rest of North America Water Quality Monitoring Systems Market by Component, 2022 - 2028, USD Million
- TABLE 79 Rest of North America Water Quality Monitoring Systems Market by Application, 2018 - 2021, USD Million
- TABLE 80 Rest of North America Water Quality Monitoring Systems Market by Application, 2022 - 2028, USD Million
- TABLE 81 Europe Water Quality Monitoring Systems Market, 2018 - 2021, USD Million
- TABLE 82 Europe Water Quality Monitoring Systems Market, 2022 - 2028, USD Million
- TABLE 83 Europe Water Quality Monitoring Systems Market by Component, 2018 - 2021, USD Million
- TABLE 84 Europe Water Quality Monitoring Systems Market by Component, 2022 - 2028, USD Million
- TABLE 85 Europe pH Sensors Market by Country, 2018 - 2021, USD Million
- TABLE 86 Europe pH Sensors Market by Country, 2022 - 2028, USD Million
- TABLE 87 Europe DO Sensors Market by Country, 2018 - 2021, USD Million
- TABLE 88 Europe DO Sensors Market by Country, 2022 - 2028, USD Million
- TABLE 89 Europe Turbidity Sensors Market by Country, 2018 - 2021, USD Million
- TABLE 90 Europe Turbidity Sensors Market by Country, 2022 - 2028, USD Million
- TABLE 91 Europe Temperature Sensors Market by Country, 2018 - 2021, USD Million
- TABLE 92 Europe Temperature Sensors Market by Country, 2022 - 2028, USD Million
- TABLE 93 Europe Others Market by Country, 2018 - 2021, USD Million
- TABLE 94 Europe Others Market by Country, 2022 - 2028, USD Million
- TABLE 95 Europe Water Quality Monitoring Systems Market by Application, 2018 - 2021, USD Million
- TABLE 96 Europe Water Quality Monitoring Systems Market by Application, 2022 - 2028, USD Million
- TABLE 97 Europe Utility Market by Country, 2018 - 2021, USD Million
- TABLE 98 Europe Utility Market by Country, 2022 - 2028, USD Million
- TABLE 99 Europe Industrial Market by Country, 2018 - 2021, USD Million
- TABLE 100 Europe Industrial Market by Country, 2022 - 2028, USD Million
- TABLE 101 Europe Commercial Market by Country, 2018 - 2021, USD Million
- TABLE 102 Europe Commercial Market by Country, 2022 - 2028, USD Million
- TABLE 103 Europe Residential Market by Country, 2018 - 2021, USD Million
- TABLE 104 Europe Residential Market by Country, 2022 - 2028, USD Million
- TABLE 105 Europe Water Quality Monitoring Systems Market by Country, 2018 - 2021, USD Million
- TABLE 106 Europe Water Quality Monitoring Systems Market by Country, 2022 - 2028, USD Million
- TABLE 107 Germany Water Quality Monitoring Systems Market, 2018 - 2021, USD Million
- TABLE 108 Germany Water Quality Monitoring Systems Market, 2022 - 2028, USD Million
- TABLE 109 Germany Water Quality Monitoring Systems Market by Component, 2018 - 2021, USD Million
- TABLE 110 Germany Water Quality Monitoring Systems Market by Component, 2022 - 2028, USD Million
- TABLE 111 Germany Water Quality Monitoring Systems Market by Application, 2018 - 2021, USD Million
- TABLE 112 Germany Water Quality Monitoring Systems Market by Application, 2022 - 2028, USD Million
- TABLE 113 UK Water Quality Monitoring Systems Market, 2018 - 2021, USD Million
- TABLE 114 UK Water Quality Monitoring Systems Market, 2022 - 2028, USD Million
- TABLE 115 UK Water Quality Monitoring Systems Market by Component, 2018 - 2021, USD Million
- TABLE 116 UK Water Quality Monitoring Systems Market by Component, 2022 - 2028, USD Million
- TABLE 117 UK Water Quality Monitoring Systems Market by Application, 2018 - 2021, USD Million
- TABLE 118 UK Water Quality Monitoring Systems Market by Application, 2022 - 2028, USD Million
- TABLE 119 France Water Quality Monitoring Systems Market, 2018 - 2021, USD Million
- TABLE 120 France Water Quality Monitoring Systems Market, 2022 - 2028, USD Million
- TABLE 121 France Water Quality Monitoring Systems Market by Component, 2018 - 2021, USD Million
- TABLE 122 France Water Quality Monitoring Systems Market by Component, 2022 - 2028, USD Million
- TABLE 123 France Water Quality Monitoring Systems Market by Application, 2018 - 2021, USD Million
- TABLE 124 France Water Quality Monitoring Systems Market by Application, 2022 - 2028, USD Million
- TABLE 125 Russia Water Quality Monitoring Systems Market, 2018 - 2021, USD Million
- TABLE 126 Russia Water Quality Monitoring Systems Market, 2022 - 2028, USD Million
- TABLE 127 Russia Water Quality Monitoring Systems Market by Component, 2018 - 2021, USD Million
- TABLE 128 Russia Water Quality Monitoring Systems Market by Component, 2022 - 2028, USD Million
- TABLE 129 Russia Water Quality Monitoring Systems Market by Application, 2018 - 2021, USD Million
- TABLE 130 Russia Water Quality Monitoring Systems Market by Application, 2022 - 2028, USD Million
- TABLE 131 Spain Water Quality Monitoring Systems Market, 2018 - 2021, USD Million
- TABLE 132 Spain Water Quality Monitoring Systems Market, 2022 - 2028, USD Million
- TABLE 133 Spain Water Quality Monitoring Systems Market by Component, 2018 - 2021, USD Million
- TABLE 134 Spain Water Quality Monitoring Systems Market by Component, 2022 - 2028, USD Million
- TABLE 135 Spain Water Quality Monitoring Systems Market by Application, 2018 - 2021, USD Million
- TABLE 136 Spain Water Quality Monitoring Systems Market by Application, 2022 - 2028, USD Million
- TABLE 137 Italy Water Quality Monitoring Systems Market, 2018 - 2021, USD Million
- TABLE 138 Italy Water Quality Monitoring Systems Market, 2022 - 2028, USD Million
- TABLE 139 Italy Water Quality Monitoring Systems Market by Component, 2018 - 2021, USD Million
- TABLE 140 Italy Water Quality Monitoring Systems Market by Component, 2022 - 2028, USD Million
- TABLE 141 Italy Water Quality Monitoring Systems Market by Application, 2018 - 2021, USD Million
- TABLE 142 Italy Water Quality Monitoring Systems Market by Application, 2022 - 2028, USD Million
- TABLE 143 Rest of Europe Water Quality Monitoring Systems Market, 2018 - 2021, USD Million
- TABLE 144 Rest of Europe Water Quality Monitoring Systems Market, 2022 - 2028, USD Million
- TABLE 145 Rest of Europe Water Quality Monitoring Systems Market by Component, 2018 - 2021, USD Million
- TABLE 146 Rest of Europe Water Quality Monitoring Systems Market by Component, 2022 - 2028, USD Million
- TABLE 147 Rest of Europe Water Quality Monitoring Systems Market by Application, 2018 - 2021, USD Million
- TABLE 148 Rest of Europe Water Quality Monitoring Systems Market by Application, 2022 - 2028, USD Million
- TABLE 149 Asia Pacific Water Quality Monitoring Systems Market, 2018 - 2021, USD Million
- TABLE 150 Asia Pacific Water Quality Monitoring Systems Market, 2022 - 2028, USD Million
- TABLE 151 Asia Pacific Water Quality Monitoring Systems Market by Component, 2018 - 2021, USD Million
- TABLE 152 Asia Pacific Water Quality Monitoring Systems Market by Component, 2022 - 2028, USD Million
- TABLE 153 Asia Pacific pH Sensors Market by Country, 2018 - 2021, USD Million
- TABLE 154 Asia Pacific pH Sensors Market by Country, 2022 - 2028, USD Million
- TABLE 155 Asia Pacific DO Sensors Market by Country, 2018 - 2021, USD Million
- TABLE 156 Asia Pacific DO Sensors Market by Country, 2022 - 2028, USD Million
- TABLE 157 Asia Pacific Turbidity Sensors Market by Country, 2018 - 2021, USD Million
- TABLE 158 Asia Pacific Turbidity Sensors Market by Country, 2022 - 2028, USD Million
- TABLE 159 Asia Pacific Temperature Sensors Market by Country, 2018 - 2021, USD Million
- TABLE 160 Asia Pacific Temperature Sensors Market by Country, 2022 - 2028, USD Million
- TABLE 161 Asia Pacific Others Market by Country, 2018 - 2021, USD Million
- TABLE 162 Asia Pacific Others Market by Country, 2022 - 2028, USD Million
- TABLE 163 Asia Pacific Water Quality Monitoring Systems Market by Application, 2018 - 2021, USD Million
- TABLE 164 Asia Pacific Water Quality Monitoring Systems Market by Application, 2022 - 2028, USD Million
- TABLE 165 Asia Pacific Utility Market by Country, 2018 - 2021, USD Million
- TABLE 166 Asia Pacific Utility Market by Country, 2022 - 2028, USD Million
- TABLE 167 Asia Pacific Industrial Market by Country, 2018 - 2021, USD Million
- TABLE 168 Asia Pacific Industrial Market by Country, 2022 - 2028, USD Million
- TABLE 169 Asia Pacific Commercial Market by Country, 2018 - 2021, USD Million
- TABLE 170 Asia Pacific Commercial Market by Country, 2022 - 2028, USD Million
- TABLE 171 Asia Pacific Residential Market by Country, 2018 - 2021, USD Million
- TABLE 172 Asia Pacific Residential Market by Country, 2022 - 2028, USD Million
- TABLE 173 Asia Pacific Water Quality Monitoring Systems Market by Country, 2018 - 2021, USD Million
- TABLE 174 Asia Pacific Water Quality Monitoring Systems Market by Country, 2022 - 2028, USD Million
- TABLE 175 China Water Quality Monitoring Systems Market, 2018 - 2021, USD Million
- TABLE 176 China Water Quality Monitoring Systems Market, 2022 - 2028, USD Million
- TABLE 177 China Water Quality Monitoring Systems Market by Component, 2018 - 2021, USD Million
- TABLE 178 China Water Quality Monitoring Systems Market by Component, 2022 - 2028, USD Million
- TABLE 179 China Water Quality Monitoring Systems Market by Application, 2018 - 2021, USD Million
- TABLE 180 China Water Quality Monitoring Systems Market by Application, 2022 - 2028, USD Million
- TABLE 181 Japan Water Quality Monitoring Systems Market, 2018 - 2021, USD Million
- TABLE 182 Japan Water Quality Monitoring Systems Market, 2022 - 2028, USD Million
- TABLE 183 Japan Water Quality Monitoring Systems Market by Component, 2018 - 2021, USD Million
- TABLE 184 Japan Water Quality Monitoring Systems Market by Component, 2022 - 2028, USD Million
- TABLE 185 Japan Water Quality Monitoring Systems Market by Application, 2018 - 2021, USD Million
- TABLE 186 Japan Water Quality Monitoring Systems Market by Application, 2022 - 2028, USD Million
- TABLE 187 India Water Quality Monitoring Systems Market, 2018 - 2021, USD Million
- TABLE 188 India Water Quality Monitoring Systems Market, 2022 - 2028, USD Million
- TABLE 189 India Water Quality Monitoring Systems Market by Component, 2018 - 2021, USD Million
- TABLE 190 India Water Quality Monitoring Systems Market by Component, 2022 - 2028, USD Million
- TABLE 191 India Water Quality Monitoring Systems Market by Application, 2018 - 2021, USD Million
- TABLE 192 India Water Quality Monitoring Systems Market by Application, 2022 - 2028, USD Million
- TABLE 193 South Korea Water Quality Monitoring Systems Market, 2018 - 2021, USD Million
- TABLE 194 South Korea Water Quality Monitoring Systems Market, 2022 - 2028, USD Million
- TABLE 195 South Korea Water Quality Monitoring Systems Market by Component, 2018 - 2021, USD Million
- TABLE 196 South Korea Water Quality Monitoring Systems Market by Component, 2022 - 2028, USD Million
- TABLE 197 South Korea Water Quality Monitoring Systems Market by Application, 2018 - 2021, USD Million
- TABLE 198 South Korea Water Quality Monitoring Systems Market by Application, 2022 - 2028, USD Million
- TABLE 199 Singapore Water Quality Monitoring Systems Market, 2018 - 2021, USD Million
- TABLE 200 Singapore Water Quality Monitoring Systems Market, 2022 - 2028, USD Million
- TABLE 201 Singapore Water Quality Monitoring Systems Market by Component, 2018 - 2021, USD Million
- TABLE 202 Singapore Water Quality Monitoring Systems Market by Component, 2022 - 2028, USD Million
- TABLE 203 Singapore Water Quality Monitoring Systems Market by Application, 2018 - 2021, USD Million
- TABLE 204 Singapore Water Quality Monitoring Systems Market by Application, 2022 - 2028, USD Million
- TABLE 205 Malaysia Water Quality Monitoring Systems Market, 2018 - 2021, USD Million
- TABLE 206 Malaysia Water Quality Monitoring Systems Market, 2022 - 2028, USD Million
- TABLE 207 Malaysia Water Quality Monitoring Systems Market by Component, 2018 - 2021, USD Million
- TABLE 208 Malaysia Water Quality Monitoring Systems Market by Component, 2022 - 2028, USD Million
- TABLE 209 Malaysia Water Quality Monitoring Systems Market by Application, 2018 - 2021, USD Million
- TABLE 210 Malaysia Water Quality Monitoring Systems Market by Application, 2022 - 2028, USD Million
- TABLE 211 Rest of Asia Pacific Water Quality Monitoring Systems Market, 2018 - 2021, USD Million
- TABLE 212 Rest of Asia Pacific Water Quality Monitoring Systems Market, 2022 - 2028, USD Million
- TABLE 213 Rest of Asia Pacific Water Quality Monitoring Systems Market by Component, 2018 - 2021, USD Million
- TABLE 214 Rest of Asia Pacific Water Quality Monitoring Systems Market by Component, 2022 - 2028, USD Million
- TABLE 215 Rest of Asia Pacific Water Quality Monitoring Systems Market by Application, 2018 - 2021, USD Million
- TABLE 216 Rest of Asia Pacific Water Quality Monitoring Systems Market by Application, 2022 - 2028, USD Million
- TABLE 217 LAMEA Water Quality Monitoring Systems Market, 2018 - 2021, USD Million
- TABLE 218 LAMEA Water Quality Monitoring Systems Market, 2022 - 2028, USD Million
- TABLE 219 LAMEA Water Quality Monitoring Systems Market by Component, 2018 - 2021, USD Million
- TABLE 220 LAMEA Water Quality Monitoring Systems Market by Component, 2022 - 2028, USD Million
- TABLE 221 LAMEA pH Sensors Market by Country, 2018 - 2021, USD Million
- TABLE 222 LAMEA pH Sensors Market by Country, 2022 - 2028, USD Million
- TABLE 223 LAMEA DO Sensors Market by Country, 2018 - 2021, USD Million
- TABLE 224 LAMEA DO Sensors Market by Country, 2022 - 2028, USD Million
- TABLE 225 LAMEA Turbidity Sensors Market by Country, 2018 - 2021, USD Million
- TABLE 226 LAMEA Turbidity Sensors Market by Country, 2022 - 2028, USD Million
- TABLE 227 LAMEA Temperature Sensors Market by Country, 2018 - 2021, USD Million
- TABLE 228 LAMEA Temperature Sensors Market by Country, 2022 - 2028, USD Million
- TABLE 229 LAMEA Others Market by Country, 2018 - 2021, USD Million
- TABLE 230 LAMEA Others Market by Country, 2022 - 2028, USD Million
- TABLE 231 LAMEA Water Quality Monitoring Systems Market by Application, 2018 - 2021, USD Million
- TABLE 232 LAMEA Water Quality Monitoring Systems Market by Application, 2022 - 2028, USD Million
- TABLE 233 LAMEA Utility Market by Country, 2018 - 2021, USD Million
- TABLE 234 LAMEA Utility Market by Country, 2022 - 2028, USD Million
- TABLE 235 LAMEA Industrial Market by Country, 2018 - 2021, USD Million
- TABLE 236 LAMEA Industrial Market by Country, 2022 - 2028, USD Million
- TABLE 237 LAMEA Commercial Market by Country, 2018 - 2021, USD Million
- TABLE 238 LAMEA Commercial Market by Country, 2022 - 2028, USD Million
- TABLE 239 LAMEA Residential Market by Country, 2018 - 2021, USD Million
- TABLE 240 LAMEA Residential Market by Country, 2022 - 2028, USD Million
- TABLE 241 LAMEA Water Quality Monitoring Systems Market by Country, 2018 - 2021, USD Million
- TABLE 242 LAMEA Water Quality Monitoring Systems Market by Country, 2022 - 2028, USD Million
- TABLE 243 Brazil Water Quality Monitoring Systems Market, 2018 - 2021, USD Million
- TABLE 244 Brazil Water Quality Monitoring Systems Market, 2022 - 2028, USD Million
- TABLE 245 Brazil Water Quality Monitoring Systems Market by Component, 2018 - 2021, USD Million
- TABLE 246 Brazil Water Quality Monitoring Systems Market by Component, 2022 - 2028, USD Million
- TABLE 247 Brazil Water Quality Monitoring Systems Market by Application, 2018 - 2021, USD Million
- TABLE 248 Brazil Water Quality Monitoring Systems Market by Application, 2022 - 2028, USD Million
- TABLE 249 Argentina Water Quality Monitoring Systems Market, 2018 - 2021, USD Million
- TABLE 250 Argentina Water Quality Monitoring Systems Market, 2022 - 2028, USD Million
- TABLE 251 Argentina Water Quality Monitoring Systems Market by Component, 2018 - 2021, USD Million
- TABLE 252 Argentina Water Quality Monitoring Systems Market by Component, 2022 - 2028, USD Million
- TABLE 253 Argentina Water Quality Monitoring Systems Market by Application, 2018 - 2021, USD Million
- TABLE 254 Argentina Water Quality Monitoring Systems Market by Application, 2022 - 2028, USD Million
- TABLE 255 UAE Water Quality Monitoring Systems Market, 2018 - 2021, USD Million
- TABLE 256 UAE Water Quality Monitoring Systems Market, 2022 - 2028, USD Million
- TABLE 257 UAE Water Quality Monitoring Systems Market by Component, 2018 - 2021, USD Million
- TABLE 258 UAE Water Quality Monitoring Systems Market by Component, 2022 - 2028, USD Million
- TABLE 259 UAE Water Quality Monitoring Systems Market by Application, 2018 - 2021, USD Million
- TABLE 260 UAE Water Quality Monitoring Systems Market by Application, 2022 - 2028, USD Million
- TABLE 261 Saudi Arabia Water Quality Monitoring Systems Market, 2018 - 2021, USD Million
- TABLE 262 Saudi Arabia Water Quality Monitoring Systems Market, 2022 - 2028, USD Million
- TABLE 263 Saudi Arabia Water Quality Monitoring Systems Market by Component, 2018 - 2021, USD Million
- TABLE 264 Saudi Arabia Water Quality Monitoring Systems Market by Component, 2022 - 2028, USD Million
- TABLE 265 Saudi Arabia Water Quality Monitoring Systems Market by Application, 2018 - 2021, USD Million
- TABLE 266 Saudi Arabia Water Quality Monitoring Systems Market by Application, 2022 - 2028, USD Million
- TABLE 267 South Africa Water Quality Monitoring Systems Market, 2018 - 2021, USD Million
- TABLE 268 South Africa Water Quality Monitoring Systems Market, 2022 - 2028, USD Million
- TABLE 269 South Africa Water Quality Monitoring Systems Market by Component, 2018 - 2021, USD Million
- TABLE 270 South Africa Water Quality Monitoring Systems Market by Component, 2022 - 2028, USD Million
- TABLE 271 South Africa Water Quality Monitoring Systems Market by Application, 2018 - 2021, USD Million
- TABLE 272 South Africa Water Quality Monitoring Systems Market by Application, 2022 - 2028, USD Million
- TABLE 273 Nigeria Water Quality Monitoring Systems Market, 2018 - 2021, USD Million
- TABLE 274 Nigeria Water Quality Monitoring Systems Market, 2022 - 2028, USD Million
- TABLE 275 Nigeria Water Quality Monitoring Systems Market by Component, 2018 - 2021, USD Million
- TABLE 276 Nigeria Water Quality Monitoring Systems Market by Component, 2022 - 2028, USD Million
- TABLE 277 Nigeria Water Quality Monitoring Systems Market by Application, 2018 - 2021, USD Million
- TABLE 278 Nigeria Water Quality Monitoring Systems Market by Application, 2022 - 2028, USD Million
- TABLE 279 Rest of LAMEA Water Quality Monitoring Systems Market, 2018 - 2021, USD Million
- TABLE 280 Rest of LAMEA Water Quality Monitoring Systems Market, 2022 - 2028, USD Million
- TABLE 281 Rest of LAMEA Water Quality Monitoring Systems Market by Component, 2018 - 2021, USD Million
- TABLE 282 Rest of LAMEA Water Quality Monitoring Systems Market by Component, 2022 - 2028, USD Million
- TABLE 283 Rest of LAMEA Water Quality Monitoring Systems Market by Application, 2018 - 2021, USD Million
- TABLE 284 Rest of LAMEA Water Quality Monitoring Systems Market by Application, 2022 - 2028, USD Million
- TABLE 285 KEY INFORMATION - GENERAL ELECTRIC (GE) CO.
- TABLE 286 key Information - Horiba Ltd.
- TABLE 287 Key Information - Danaher Corporation
- TABLE 288 key information - Evoqua Water Technologies Corporation
- TABLE 289 key information - Xylem, Inc.
- TABLE 290 Key Information - Shimadzu Corporation
- TABLE 291 Key Information - Pentair PLC
- TABLE 292 Key Information - Thermo Fisher Scientific, Inc.
- TABLE 293 Key Information - Uponor Corporation
- TABLE 294 Key Information - Teledyne Technologies, Inc.
List of Figures
- FIG 1 Methodology for the research
- FIG 2 KBV Cardinal Matrix
- FIG 3 Key Leading Strategies: Percentage Distribution (2018-2022)
- FIG 4 Key Strategic Move: (Product Launches and Product Expansions : 2018, nov - 2022, aug) Leading Players
- FIG 5 Global Water Quality Monitoring Systems Market share by Component, 2021
- FIG 6 Global Water Quality Monitoring Systems Market share by Component, 2028
- FIG 7 Global Water Quality Monitoring Systems Market by Component, 2018 - 2028, USD Million
- FIG 8 Global Water Quality Monitoring Systems Market share by Application, 2021
- FIG 9 Global Water Quality Monitoring Systems Market share by Application, 2028
- FIG 10 Global Water Quality Monitoring Systems Market by Application, 2018 - 2028, USD Million
- FIG 11 Global Water Quality Monitoring Systems Market share by Region, 2021
- FIG 12 Global Water Quality Monitoring Systems Market share by Region, 2028
- FIG 13 Global Water Quality Monitoring Systems Market by Region, 2018 - 2028, USD Million
- FIG 14 Swot analysis: General electric (GE) Co.
- FIG 15 Recent strategies and developments: Horiba Ltd.
- FIG 16 Recent strategies and developments: Danaher Corporation
- FIG 17 Recent strategies and developments: Evoqua Water Technologies Corporation
- FIG 18 Recent strategies and developments: Xylem, Inc.
The Global Water Quality Monitoring Systems Market size is expected to reach $7.5 billion by 2028, rising at a market growth of 8.3% CAGR during the forecast period.
A system for monitoring various aspects of water quality, including hardware and software, is known as a "water quality monitoring system." It is a trustworthy analytical system designed to improve water quality. Water bodies must be regularly tested for contaminants in order to remain safe. Temperature, macroinvertebrates, phosphates, pH, nitrates, dissolved oxygen, and other parameters are measured through this system.
The standard of water resources directly impacts how people live their lives. Large water bodies in both urban and rural areas frequently receive contaminated water discharge due to environmental deterioration and extensive industrialization. Water becomes contaminated as a result, endangering human life. As a result, it is crucial to implement systems for monitoring water quality in order to assess it.
The rise in industrialization-related water pollution, the surge in the prevalence of waterborne diseases, and the rise in government regulations are the main growth factors for the market for water quality monitoring systems. To analyze the water quality, new sensors have been developed. These include dissolved oxygen sensors, turbidity sensors, conductivity sensors, pH sensors, chlorine sensors, ORP sensors, and temperature sensors.
The water distribution system is monitored by Online Water Quality Monitoring (OWQM) sensors, along with other analytical tools. During the forecast period, it is anticipated that the adoption of new technologies and creative techniques will increase demand for and popularity of water quality monitoring systems. One of the key market drivers is the increasing pollution that is negatively affecting the quality of drinking water.
Storms, droughts, and floods have become more common as a result of climatic changes brought on by rising pollution. Utility repair and retrofitting projects are consequently slowed down or put off. In such cases, utilities should accommodate end-user needs. As a result, numerous utilities are implementing systems for monitoring water quality.
COVID-19 Impact Analysis
Due to lockdown procedures, a lack of labor, and supply chain disruption, production facilities for pipeline monitoring systems were either completely or partially stopped. As a result of this, the production of water monitoring systems would be affected. Due to the suspension of regular business operations in these sectors during the lockdown, demand from end users for things like petroleum, water, and wastewater, and other goods & services significantly decreased.
Market Growth Factors
Strict Water Quality Standards Testing For A Wide Range Of Applications
Strict quality testing guidelines and parameters for water utilization are being pursued by numerous international organizations, including the Environmental Protection Agency (EPA), European Drinking Water Directive, Australian Drinking Water Guidelines, and China's GB3838-2002, among others. Countries that have not adopted these standards adhere to the World Health Organization's recommendations (WHO). All businesses & other end users must abide by these rules, and as part of that compliance, they must use water quality testing tools to determine the water's quality.
Increasing Need For Treatment Of Wastewater
With rising manufacturing activity, water waste has become a significant issue in both developed and developing nations. In order to conserve water and natural resources, numerous governments and non-governmental organizations are making great efforts. Worldwide, a large number of people consume water that is tainted with micro-organisms, which can lead to diseases like cholera, typhoid, dysentery, and polio, among others.
Market Restraining Factors
Monitoring Systems Are Generally Expensive
The initial purchase price, operational costs, which include the cost of consumables and replacement parts, and maintenance fees are all included in the ownership costs of water quality monitoring systems. Standard chemical solutions and reagent preparation involve consumable costs. In addition, a significant portion of the equipment's overall cost goes toward analyzer maintenance. The management of spare parts inventories and in-plant repairs are the next-largest components of instrument cost of ownership after calibration.
Component Outlook
Based on component, the water quality monitoring system market is segmented into pH sensors, DO sensors, temperature sensors, turbidity sensors and others. The DO sensors segment acquired a significant revenue share in the water quality monitoring systems market in 2021. DO sensors are utilized to measure dissolved oxygen concentration in water based on the quenching of luminescence in the presence of oxygen. The DO sensors can measure either the intensity or the lifetime of the luminescence as oxygen it affects both.
Application Outlook
On the basis of application, the water quality monitoring system market is fragmented into residential, commercial, industrial and utility. The industrial segment covered a substantial revenue share in the water quality monitoring system market in 2021. Different types of analyzers are utilized for efficient wastewater treatment monitoring in a variety of industries, including oil & gas and chemicals. Additionally, industrial wastewater must undergo pretreatment before being disposed of directly into sewage treatment facilities for the general public.
Regional Outlook
Region wise, the water quality monitoring system market is analyzed across North America, Europe, Asia Pacific and LAMEA. In 2021, the North America region led the water quality monitoring systems market with the largest revenue share. This is because of the usage of contemporary technologies, the presence of developed economies, as well as the rise in manufacturing and industrial activities. Along with this, the strict governmental regulations of the governments of several nations in the region are supporting regional market growth.
The major strategies followed by the market participants are Product Launches. Based on the Analysis presented in the Cardinal matrix; Danaher Corporation and Thermo Fisher Scientific, Inc. are the forerunners in the Water Quality Monitoring Systems Market. Companies such as Evoqua Water Technologies Corporation, Shimadzu Corporation and Xylem, Inc. are some of the key innovators in Water Quality Monitoring Systems Market.
The market research report covers the analysis of key stake holders of the market. Key companies profiled in the report include General Electric (GE) Co., Horiba Ltd., Danaher Corporation, Evoqua Water Technologies Corporation, Xylem, Inc., Shimadzu Corporation, Pentair PLC, Thermo Fisher Scientific, Inc., Uponor Corporation, and Teledyne Technologies, Inc.
Recent Strategies deployed in Water Quality Monitoring Systems Market
Partnerships, Collaborations and Agreements:
Aug-2021: HORIBA formed a partnership with Covalent Metrology, a leading North American provider of analytical services. This partnership aimed to expand engineering and scientific access to world-class expertise and chemical analysis instruments.
May-2021: Danaher came into a partnership with LightDeck Diagnostics, a developer of on-the-spot diagnostic products. Under this partnership, Hach would sell LightDeck's Gen 2 Microcystin/Cylindrospermopsin test that would simultaneously identify two of the most common toxins generated by harmful blooms.
Product Launches and Product Expansions:
Aug-2022: Aquatic Informatics introduced Rio, the next generation in cloud-based compliance and operations data management solutions. This product would expand the capabilities of the consumers by allowing them to be proactive in their compliance and more efficient in maintaining daily operations by offerings visibility into water quality procedures.
Jul-2022: Shimadzu released the latest Nexera XS inert, a bioinert and biocompatible ultra-high performance liquid chromatograph (UHPLC). The latest Nexera XS inert UHPLC would feature a metal-free sample flow path, which would prevent unwanted interaction with biopolymers that are prone to adsorption onto exposed metal sites.
Apr-2022: Xylem released the DB600 Data Monitoring Buoy Solution, a compact, user-friendly assembly, and plug-n-play device. This product would be implemented by a single person, in water depths up to 20 meters and current speeds of up to 4 knots, and features everything needed to transfer real-time water quality data directly to a smart device, with industrial field reliability.
Nov-2021: Thermo Fisher Scientific introduced Thermo Scientific HyPeak Chromatography System. Through an advanced zero dead-leg, ring flush valve manifold, the system would enable the easy and accurate operation and also contribute to optimal system volumes and decreased buffer use leading to enhanced product yield.
Jul-2021: HORIBA Advanced Techno released the HD-960LR, a new dissolved oxygen monitor for semiconductor and semiconductor manufacturing equipment manufacturers. This product would monitor the dissolved oxygen content of chemicals with better precision in the semiconductor manufacturing procedure.
May-2021: Shimadzu introduced the TOC-1000e, the first analyzer in the eTOC series of online TOC analyzers designed for pure water applications. This product aims at high sensitivity, miniaturization, and a mercury-free oxidation technique. The pioneering TOC-1000e system would be the world's smallest as well as lightest cabinet and offer high-sensitivity detection, which would make it ideal for fields offering high-purity water applications.
Mar-2021: Shimadzu launched its Advanced i-Series liquid chromatography series. This series would have more pressure resistance and would apply analytical intelligence (AI) automated features to complete remote work like auto-diagnostics and auto-recovery functions, real-time remote mobile phase monitoring (1 L-5 L bottles), i-PeakFinder for automatic peak integration, and several other beneficial features.
Jul-2020: YSI, a Xylem brand released two new powerful handheld meters: The YSI ProSwap Digital Water Quality Meter and the ProQuatro Multiparameter Meter. These products feature built-in spot sampling pH meter, temperature as well as optional depth sensors, and a profiling conductivity-temperature-depth system.
Acquisitions and Mergers:
Aug-2022: Pentair took over Manitowoc Ice from Welbilt, a leading provider of commercial ice makers. This acquisition aimed to enable Pentair to improve and provide the total water management capabilities to an expanded network of channel partners and customers, further setting up Pentair as a leader in a growing industry.
Apr-2022: Evoqua Water Technologies completed its acquisition of Frontier Water Systems, a leading supplier of engineered equipment packages. This acquisition aimed to add up to Evoqua's portfolio of advanced wastewater treatment technologies.
Oct-2021: Xylem took over Anadolu Flygt, Turkey's market leader in the supply, installation, and after-sales service for pump and water treatment systems. This acquisition aimed to expand Xylem's smart water product line into Turkey.
May-2021: Aquatic Informatics took over Sedaru, a leading provider of water utility management software. This acquisition aimed to join Danaher's Water Quality platform. This acquisition would assist in offering step-change value to our water utility customers.
Dec-2020: Evoqua Water Technologies took over Ultrapure & Industrial Services' industrial water business. This acquisition aimed to expand the service capabilities of Evoqua in the markets of Houston and Dallas and the regions.
Jul-2020: Danaher acquired Aquatic Informatics, a water data management software company. This acquisition aimed to integrate software, hardware, and services together to assist municipal, environmental, and industrial consumers save money, enhancing asset performance, and decreasing risk.
Geographical Expansions:
Jun-2022: Evoqua Water Technologies expanded its geographical footprint by opening a new manufacturing facility based in Singapore. This expansion aimed to grow innovative water treatment solutions in the region.
Apr-2022: HORIBA expanded its geographical footprint by establishing its new facility in Magdeburg-Barleben in Saxony-Anhal. This facility would meet the rising demand for the latest technologies in the fields of electromobility, new energy and process, and environmental engineering.
Dec-2021: HORIBA Precision Instruments expanded its global footprint by relocating its company building to an industrial park near the Beijing Capital International Airport. This relocation would expand the production area and enhance efficiency in an effort to set up a production system that would triple the capacity by 2025.
Mar-2021: Evoqua Water Technologies expanded its global footprint by opening the Global Engineering and Technology Center, located in Chennai, India. This expansion aimed to support Evoqua's growth and market development plans for the local region and the Asia-Pacific market.
Scope of the Study
Market Segments covered in the Report:
By Component
- pH Sensors
- DO Sensors
- Turbidity Sensors
- Temperature Sensors
- Others
By Application
- Utility
- Industrial
- Commercial
- Residential
By Geography
- North America
- US
- Canada
- Mexico
- Rest of North America
- Europe
- Germany
- UK
- France
- Russia
- Spain
- Italy
- Rest of Europe
- Asia Pacific
- China
- Japan
- India
- South Korea
- Singapore
- Malaysia
- Rest of Asia Pacific
- LAMEA
- Brazil
- Argentina
- UAE
- Saudi Arabia
- South Africa
- Nigeria
- Rest of LAMEA
Companies Profiled
- General Electric (GE) Co.
- Horiba Ltd.
- Danaher Corporation
- Evoqua Water Technologies Corporation
- Xylem, Inc.
- Shimadzu Corporation
- Pentair PLC
- Thermo Fisher Scientific, Inc.
- Uponor Corporation
- Teledyne Technologies, Inc.
Unique Offerings from KBV Research
- Exhaustive coverage
- Highest number of market tables and figures
- Subscription based model available
- Guaranteed best price
- Assured post sales research support with 10% customization free
Table of Contents
Chapter 1. Market Scope & Methodology
- 1.1 Market Definition
- 1.2 Objectives
- 1.3 Market Scope
- 1.4 Segmentation
- 1.4.1 Global Water Quality Monitoring Systems Market, by Component
- 1.4.2 Global Water Quality Monitoring Systems Market, by Application
- 1.4.3 Global Water Quality Monitoring Systems Market, by Geography
- 1.5 Methodology for the research
Chapter 2. Market Overview
- 2.1 Introduction
- 2.1.1 Overview
- 2.1.1.1 Market Composition & Scenario
- 2.1.1 Overview
- 2.2 Key Factors Impacting the Market
- 2.2.1 Market Drivers
- 2.2.2 Market Restraints
Chapter 3. Competition Analysis - Global
- 3.1 KBV Cardinal Matrix
- 3.2 Recent Industry Wide Strategic Developments
- 3.2.1 Partnerships, Collaborations and Agreements
- 3.2.2 Product Launches and Product Expansions
- 3.2.3 Acquisition and Mergers
- 3.2.4 Geographical Expansions
- 3.3 Top Winning Strategies
- 3.3.1 Key Leading Strategies: Percentage Distribution (2018-2022)
- 3.3.2 Key Strategic Move: (Product Launches and Product Expansions : 2018, Nov - 2022, Aug) Leading Players
Chapter 4. Global Water Quality Monitoring Systems Market by Component
- 4.1 Global pH Sensors Market by Region
- 4.2 Global DO Sensors Market by Region
- 4.3 Global Turbidity Sensors Market by Region
- 4.4 Global Temperature Sensors Market by Region
- 4.5 Global Others Market by Region
Chapter 5. Global Water Quality Monitoring Systems Market by Application
- 5.1 Global Utility Market by Region
- 5.2 Global Industrial Market by Region
- 5.3 Global Commercial Market by Region
- 5.4 Global Residential Market by Region
Chapter 6. Global Water Quality Monitoring Systems Market by Region
- 6.1 North America Water Quality Monitoring Systems Market
- 6.1.1 North America Water Quality Monitoring Systems Market by Component
- 6.1.1.1 North America pH Sensors Market by Country
- 6.1.1.2 North America DO Sensors Market by Country
- 6.1.1.3 North America Turbidity Sensors Market by Country
- 6.1.1.4 North America Temperature Sensors Market by Country
- 6.1.1.5 North America Others Market by Country
- 6.1.2 North America Water Quality Monitoring Systems Market by Application
- 6.1.2.1 North America Utility Market by Country
- 6.1.2.2 North America Industrial Market by Country
- 6.1.2.3 North America Commercial Market by Country
- 6.1.2.4 North America Residential Market by Country
- 6.1.3 North America Water Quality Monitoring Systems Market by Country
- 6.1.3.1 US Water Quality Monitoring Systems Market
- 6.1.3.1.1 US Water Quality Monitoring Systems Market by Component
- 6.1.3.1.2 US Water Quality Monitoring Systems Market by Application
- 6.1.3.2 Canada Water Quality Monitoring Systems Market
- 6.1.3.2.1 Canada Water Quality Monitoring Systems Market by Component
- 6.1.3.2.2 Canada Water Quality Monitoring Systems Market by Application
- 6.1.3.3 Mexico Water Quality Monitoring Systems Market
- 6.1.3.3.1 Mexico Water Quality Monitoring Systems Market by Component
- 6.1.3.3.2 Mexico Water Quality Monitoring Systems Market by Application
- 6.1.3.4 Rest of North America Water Quality Monitoring Systems Market
- 6.1.3.4.1 Rest of North America Water Quality Monitoring Systems Market by Component
- 6.1.3.4.2 Rest of North America Water Quality Monitoring Systems Market by Application
- 6.1.3.1 US Water Quality Monitoring Systems Market
- 6.1.1 North America Water Quality Monitoring Systems Market by Component
- 6.2 Europe Water Quality Monitoring Systems Market
- 6.2.1 Europe Water Quality Monitoring Systems Market by Component
- 6.2.1.1 Europe pH Sensors Market by Country
- 6.2.1.2 Europe DO Sensors Market by Country
- 6.2.1.3 Europe Turbidity Sensors Market by Country
- 6.2.1.4 Europe Temperature Sensors Market by Country
- 6.2.1.5 Europe Others Market by Country
- 6.2.2 Europe Water Quality Monitoring Systems Market by Application
- 6.2.2.1 Europe Utility Market by Country
- 6.2.2.2 Europe Industrial Market by Country
- 6.2.2.3 Europe Commercial Market by Country
- 6.2.2.4 Europe Residential Market by Country
- 6.2.3 Europe Water Quality Monitoring Systems Market by Country
- 6.2.3.1 Germany Water Quality Monitoring Systems Market
- 6.2.3.1.1 Germany Water Quality Monitoring Systems Market by Component
- 6.2.3.1.2 Germany Water Quality Monitoring Systems Market by Application
- 6.2.3.2 UK Water Quality Monitoring Systems Market
- 6.2.3.2.1 UK Water Quality Monitoring Systems Market by Component
- 6.2.3.2.2 UK Water Quality Monitoring Systems Market by Application
- 6.2.3.3 France Water Quality Monitoring Systems Market
- 6.2.3.3.1 France Water Quality Monitoring Systems Market by Component
- 6.2.3.3.2 France Water Quality Monitoring Systems Market by Application
- 6.2.3.4 Russia Water Quality Monitoring Systems Market
- 6.2.3.4.1 Russia Water Quality Monitoring Systems Market by Component
- 6.2.3.4.2 Russia Water Quality Monitoring Systems Market by Application
- 6.2.3.5 Spain Water Quality Monitoring Systems Market
- 6.2.3.5.1 Spain Water Quality Monitoring Systems Market by Component
- 6.2.3.5.2 Spain Water Quality Monitoring Systems Market by Application
- 6.2.3.6 Italy Water Quality Monitoring Systems Market
- 6.2.3.6.1 Italy Water Quality Monitoring Systems Market by Component
- 6.2.3.6.2 Italy Water Quality Monitoring Systems Market by Application
- 6.2.3.7 Rest of Europe Water Quality Monitoring Systems Market
- 6.2.3.7.1 Rest of Europe Water Quality Monitoring Systems Market by Component
- 6.2.3.7.2 Rest of Europe Water Quality Monitoring Systems Market by Application
- 6.2.3.1 Germany Water Quality Monitoring Systems Market
- 6.2.1 Europe Water Quality Monitoring Systems Market by Component
- 6.3 Asia Pacific Water Quality Monitoring Systems Market
- 6.3.1 Asia Pacific Water Quality Monitoring Systems Market by Component
- 6.3.1.1 Asia Pacific pH Sensors Market by Country
- 6.3.1.2 Asia Pacific DO Sensors Market by Country
- 6.3.1.3 Asia Pacific Turbidity Sensors Market by Country
- 6.3.1.4 Asia Pacific Temperature Sensors Market by Country
- 6.3.1.5 Asia Pacific Others Market by Country
- 6.3.2 Asia Pacific Water Quality Monitoring Systems Market by Application
- 6.3.2.1 Asia Pacific Utility Market by Country
- 6.3.2.2 Asia Pacific Industrial Market by Country
- 6.3.2.3 Asia Pacific Commercial Market by Country
- 6.3.2.4 Asia Pacific Residential Market by Country
- 6.3.3 Asia Pacific Water Quality Monitoring Systems Market by Country
- 6.3.3.1 China Water Quality Monitoring Systems Market
- 6.3.3.1.1 China Water Quality Monitoring Systems Market by Component
- 6.3.3.1.2 China Water Quality Monitoring Systems Market by Application
- 6.3.3.2 Japan Water Quality Monitoring Systems Market
- 6.3.3.2.1 Japan Water Quality Monitoring Systems Market by Component
- 6.3.3.2.2 Japan Water Quality Monitoring Systems Market by Application
- 6.3.3.3 India Water Quality Monitoring Systems Market
- 6.3.3.3.1 India Water Quality Monitoring Systems Market by Component
- 6.3.3.3.2 India Water Quality Monitoring Systems Market by Application
- 6.3.3.4 South Korea Water Quality Monitoring Systems Market
- 6.3.3.4.1 South Korea Water Quality Monitoring Systems Market by Component
- 6.3.3.4.2 South Korea Water Quality Monitoring Systems Market by Application
- 6.3.3.5 Singapore Water Quality Monitoring Systems Market
- 6.3.3.5.1 Singapore Water Quality Monitoring Systems Market by Component
- 6.3.3.5.2 Singapore Water Quality Monitoring Systems Market by Application
- 6.3.3.6 Malaysia Water Quality Monitoring Systems Market
- 6.3.3.6.1 Malaysia Water Quality Monitoring Systems Market by Component
- 6.3.3.6.2 Malaysia Water Quality Monitoring Systems Market by Application
- 6.3.3.7 Rest of Asia Pacific Water Quality Monitoring Systems Market
- 6.3.3.7.1 Rest of Asia Pacific Water Quality Monitoring Systems Market by Component
- 6.3.3.7.2 Rest of Asia Pacific Water Quality Monitoring Systems Market by Application
- 6.3.3.1 China Water Quality Monitoring Systems Market
- 6.3.1 Asia Pacific Water Quality Monitoring Systems Market by Component
- 6.4 LAMEA Water Quality Monitoring Systems Market
- 6.4.1 LAMEA Water Quality Monitoring Systems Market by Component
- 6.4.1.1 LAMEA pH Sensors Market by Country
- 6.4.1.2 LAMEA DO Sensors Market by Country
- 6.4.1.3 LAMEA Turbidity Sensors Market by Country
- 6.4.1.4 LAMEA Temperature Sensors Market by Country
- 6.4.1.5 LAMEA Others Market by Country
- 6.4.2 LAMEA Water Quality Monitoring Systems Market by Application
- 6.4.2.1 LAMEA Utility Market by Country
- 6.4.2.2 LAMEA Industrial Market by Country
- 6.4.2.3 LAMEA Commercial Market by Country
- 6.4.2.4 LAMEA Residential Market by Country
- 6.4.3 LAMEA Water Quality Monitoring Systems Market by Country
- 6.4.3.1 Brazil Water Quality Monitoring Systems Market
- 6.4.3.1.1 Brazil Water Quality Monitoring Systems Market by Component
- 6.4.3.1.2 Brazil Water Quality Monitoring Systems Market by Application
- 6.4.3.2 Argentina Water Quality Monitoring Systems Market
- 6.4.3.2.1 Argentina Water Quality Monitoring Systems Market by Component
- 6.4.3.2.2 Argentina Water Quality Monitoring Systems Market by Application
- 6.4.3.3 UAE Water Quality Monitoring Systems Market
- 6.4.3.3.1 UAE Water Quality Monitoring Systems Market by Component
- 6.4.3.3.2 UAE Water Quality Monitoring Systems Market by Application
- 6.4.3.4 Saudi Arabia Water Quality Monitoring Systems Market
- 6.4.3.4.1 Saudi Arabia Water Quality Monitoring Systems Market by Component
- 6.4.3.4.2 Saudi Arabia Water Quality Monitoring Systems Market by Application
- 6.4.3.5 South Africa Water Quality Monitoring Systems Market
- 6.4.3.5.1 South Africa Water Quality Monitoring Systems Market by Component
- 6.4.3.5.2 South Africa Water Quality Monitoring Systems Market by Application
- 6.4.3.6 Nigeria Water Quality Monitoring Systems Market
- 6.4.3.6.1 Nigeria Water Quality Monitoring Systems Market by Component
- 6.4.3.6.2 Nigeria Water Quality Monitoring Systems Market by Application
- 6.4.3.7 Rest of LAMEA Water Quality Monitoring Systems Market
- 6.4.3.7.1 Rest of LAMEA Water Quality Monitoring Systems Market by Component
- 6.4.3.7.2 Rest of LAMEA Water Quality Monitoring Systems Market by Application
- 6.4.3.1 Brazil Water Quality Monitoring Systems Market
- 6.4.1 LAMEA Water Quality Monitoring Systems Market by Component
Chapter 7. Company Profiles
- 7.1 General Electric (GE) Co.
- 7.1.1 Company Overview
- 7.1.2 Financial Analysis
- 7.1.3 Segmental and Regional Analysis
- 7.1.4 Research & Development Expense
- 7.1.1 SWOT Analysis
- 7.2 Horiba Ltd.
- 7.2.1 Company Overview
- 7.2.2 Financial Analysis
- 7.2.3 Regional & Segmental Analysis
- 7.2.4 Research & Development Expenses
- 7.2.5 Recent strategies and developments:
- 7.2.5.1 Partnerships, Collaborations, and Agreements:
- 7.2.5.2 Product Launches and Product Expansions:
- 7.2.5.3 Geographical Expansions:
- 7.3 Danaher Corporation
- 7.3.1 Company Overview
- 7.3.2 Financial Analysis
- 7.3.3 Segmental and Regional Analysis
- 7.3.4 Research & Development Expense
- 7.3.5 Recent strategies and developments:
- 7.3.5.1 Partnerships, Collaborations, and Agreements:
- 7.3.5.2 Product Launches and Product Expansions:
- 7.3.5.3 Acquisition and Mergers:
- 7.4 Evoqua Water Technologies Corporation
- 7.4.1 Company Overview
- 7.4.2 Financial Analysis
- 7.4.3 Segmental and Regional Analysis
- 7.4.4 Research and Development Expense
- 7.4.5 Recent strategies and developments:
- 7.4.5.1 Product Launches and Product Expansions:
- 7.4.5.2 Acquisition and Mergers:
- 7.4.5.3 Geographical Expansions:
- 7.5 Xylem, Inc.
- 7.5.1 Company Overview
- 7.5.2 Financial Analysis
- 7.5.3 Segmental and Regional Analysis
- 7.5.4 Research & Development Expense
- 7.5.5 Recent strategies and developments:
- 7.5.5.1 Product Launches and Product Expansions:
- 7.5.5.2 Acquisition and Mergers:
- 7.6 Shimadzu Corporation
- 7.6.1 Company Overview
- 7.6.2 Financial Analysis
- 7.6.3 Segmental and Regional Analysis
- 7.6.4 Recent strategies and developments:
- 7.6.4.1 Product Launches and Product Expansions:
- 7.7 Pentair PLC
- 7.7.1 Company Overview
- 7.7.2 Financial Analysis
- 7.7.3 Segmental and Regional Analysis
- 7.7.4 Research & Development Expense
- 7.7.5 Recent strategies and developments:
- 7.7.5.1 Acquisition and Mergers:
- 7.8 Thermo Fisher Scientific, Inc.
- 7.8.1 Company Overview
- 7.8.2 Financial Analysis
- 7.8.3 Segmental and Regional Analysis
- 7.8.4 Research & Development Expense
- 7.8.5 Recent strategies and developments:
- 7.8.5.1 Product Launches and Product Expansions:
- 7.9 Uponor Corporation
- 7.9.1 Company Overview
- 7.9.2 Financial Analysis
- 7.9.3 Segmental and Regional Analysis
- 7.9.4 Research & Development Expenses
- 7.10. Teledyne Technologies, Inc.
- 7.10.1 Company Overview
- 7.10.2 Financial Analysis
- 7.10.3 Segmental and Regional Analysis
- 7.10.4 Research & Development Expenses