|
|
市場調査レポート
商品コード
1126398
世界の自動廃棄物収集システム市場規模、シェア、産業動向分析レポート:タイプ別(完全真空システム、重力真空システム)、オペレーション別(定置式、移動式)、アプリケーション別、地域別展望・予測、2022年~2028年Global Automated Waste Collection System Market Size, Share & Industry Trends Analysis Report By Type (Full Vacuum System and Gravity Vacuum System), By Operation (Stationary and Mobile), By Application, By Regional Outlook and Forecast, 2022 - 2028 |
||||||
|
|
|||||||


| 世界の自動廃棄物収集システム市場規模、シェア、産業動向分析レポート:タイプ別(完全真空システム、重力真空システム)、オペレーション別(定置式、移動式)、アプリケーション別、地域別展望・予測、2022年~2028年 |
|
出版日: 2022年08月31日
発行: KBV Research
ページ情報: 英文 206 Pages
納期: 即納可能
|
- 全表示
- 概要
- 図表
- 目次
自動廃棄物収集システムの世界市場規模は、2028年までに5億4450万米ドルに達し、予測期間中にCAGR10.9%の市場成長率で上昇すると予想されています。
廃棄物を処理・収集する革新的な方法として、スマート廃棄物収集があります。モノのインターネット(IoT)技術に基づくスマート廃棄物収集は、ゴミの発生行動や動向に関する情報を提供します。自治体、町村、ゴミ収集業者は、廃棄物処理を最適化し、持続可能性を向上させ、その結果、より良い財務決定を行うことができるようになりました。
廃棄物収集業務は、一般的に停滞したものでした。そして、廃棄物管理の近代化に人々が気づき始めたのは、ごく最近のことです。廃棄物収集当局は、IoT技術や新しいイノベーションが実用化されるにつれ、予算削減や積極的な環境目標に対処する方法として、ますますスマートなソリューションに目を向けるようになってきているのです。
COVID-19インパクト分析
自動廃棄物収集システムおよび住宅や商業スペースに設置されるこれらのシステムを構成するコンポーネントの生産および製造における国全体のロックダウンや遅延により、COVID-19の発生は自動廃棄物収集システム業界の成長に影響を与えています。新型コロナウイルスは、多くの国や地域で急速に蔓延し、個人の生活や地域社会全体に大きな影響を及ぼしています。当初は健康被害が問題視されましたが、現在では国際貿易、経済、金融システムに深刻な脅威を与えています。
市場の成長要因
アプリケーションと用途の急増
ヘルスケア施設では、自動廃棄物収集システムが強く望まれています。廃棄物管理・収集システムは、密閉された特殊なパイプラインを通じて、患者の床から中央収集作業所まで、ほぼ時速60マイルで物質を移動させる。廃棄物、コンポスト、汚れたリネンはすべて、異なる経路で適切な回収容器に運ばれます。このため、ヘルスケア、ホスピタリティ、小売などの企業では、自動収集ソリューションに多くの資金を投入しています。
労働者や作業員の怪我を減らし、安全性の高いオペレーションを提供する
固形廃棄物を収集する作業者は、過酷な作業や揮発性物質、危険な汚染物質や感染性の物質にさらされるため、特に健康や環境に対する危険にさらされやすいといえます。従来の廃棄物収集業務では、物質を収集車に物理的に積み込む必要があります。一般的に、高齢の従業員が多く、重いものを何度も持ち上げるため、怪我をする従業員が増えています。
市場抑制要因
新しい技術の導入に対する人々の抵抗と認識不足
現代において、自動廃棄物収集システムの採用は、その高い柔軟性と効率性により、先進国のみならず多くの発展途上国でも顕著に見られます。しかし、発展途上国や技術的に弱い国では、自動廃棄物収集システムの導入が非常に少ないのが現状です。この新しく高度な技術を利用することに対する国民の抵抗が、自動廃棄物収集システムの市場開拓を阻む主な障壁の一つとなっているのです。
タイプ別展望
タイプ別では、自動廃棄物収集システム市場は、フルバキュームシステムとグラビティバキュームシステムに二分されます。2021年、フルバキュームシステムセグメントは、自動廃棄物収集システム市場の最大の収益シェアを獲得しました。フルバキューム自動廃棄物収集システムの需要は、その高い効率性と最適化のために急増しています。市場は、スタジアム、病院、食品市場、空港、教育機関など、多くの用途に関して検討されています。
運用の展望
オペレーションに基づき、自動廃棄物収集システム市場は、定置型とモバイル型に分けられます。2021年には、モバイルセグメントが自動廃棄物収集システム市場で大きな収益シェアを記録しました。市場のこのセグメントの成長の増加は、この操作の中で顧客に提供される利便性の増加の結果です。さらに、モバイル廃棄物収集は、住宅だけでなく商業廃棄物の収集のプロセス全体を大幅に加速するため、非常に時間効率の良い方法です。
アプリケーションの展望
自動廃棄物収集システム市場は、アプリケーション別に、空港、病院、産業、食品市場、スポーツスタジアム、その他に分類されます。2021年、スポーティングスタジアムセグメントは、自動廃棄物収集システム市場の有望な収益シェアを獲得しました。このセグメントの成長の急増は、これらのスポーツスタジアムを非常に速いスピードで、イベントが始まる前に清掃できるシステムに対する高い要求があるという事実によるものです。
地域別の展望
地域別では、自動廃棄物収集システム市場は、北米、欧州、アジア太平洋、LAMEAで分析されています。2021年、欧州は自動廃棄物収集システム市場の最大の収益シェアを占めました。人口が増加しているため、この地域の市場は非常に速いペースで成長しています。さらに、都市の人口が増え、政府が公衆衛生を守るために廃棄物の正しい処分に重点を置くようになると、自動廃棄物収集システムの需要が増加することが予想されます。
目次
第1章 市場範囲と調査手法
- 市場の定義
- 目的
- 市場規模
- セグメンテーション
- 自動廃棄物収集システムの世界市場、タイプ別
- 自動廃棄物収集システムの世界市場、操作別
- 自動廃棄物収集システムの世界市場、用途別
- 自動廃棄物収集システムの世界市場、地域別
- 調査手法
第2章 市場概要
- イントロダクション
- 概要の説明
- 市場の構成とシナリオ
- 概要の説明
- 市場に影響を与える主な要因
- 市場促進要因
- 市場の抑制要因
第3章 自動廃棄物収集システムの世界市場:タイプ別
- フルバキュームシステムの世界市場:地域別
- グラビティバキュームシステムの世界市場:地域別
第4章 自動廃棄物収集システムの世界市場:操作別
- 定置式の世界市場:地域別
- モバイルの世界市場:地域別
第5章 自動廃棄物収集システムの世界市場:用途別
- 世界の産業別市場:地域別
- 病院の世界市場:地域別
- 食品市場の世界市場:地域別
- 空港の世界市場:地域別
- スポーツスタジアムの世界市場:地域別
- 地域別世界のその他市場
第6章 自動廃棄物収集システムの世界市場:地域別
- 北米
- 北米の自動廃棄物収集システムの国別市場
- 米国
- カナダ
- メキシコ
- 北米以外の地域
- 北米の自動廃棄物収集システムの国別市場
- 欧州
- 欧州の自動廃棄物収集システム市場:国別
- ドイツ
- 英国
- フランス
- ロシア
- スペイン
- イタリア
- その他欧州
- 欧州の自動廃棄物収集システム市場:国別
- アジア太平洋地域
- アジア太平洋地域の自動廃棄物収集システム市場:国別
- 中国
- 日本
- インド
- 韓国
- シンガポール
- マレーシア
- その他アジア太平洋地域
- アジア太平洋地域の自動廃棄物収集システム市場:国別
- LAMEA
- LAMEAの自動廃棄物収集システム市場:国別
- ブラジル
- アルゼンチン
- UAE
- サウジアラビア
- 南アフリカ
- ナイジェリア
- その他のLAMEA
- LAMEAの自動廃棄物収集システム市場:国別
第7章 企業プロファイル
- Caverion Corporation
- AMCS Group
- AWC Berhad
- Envac AB
- Aerbin ApS
- Green Wave Solutions
- Logiwaste AB
- Stream Environment SDN BHD
- MariMatic Oy(MariMatic Group)
LIST OF TABLES
- TABLE 1 Global Automated Waste Collection System Market, 2018 - 2021, USD Thousands
- TABLE 2 Global Automated Waste Collection System Market, 2022 - 2028, USD Thousands
- TABLE 3 Global Automated Waste Collection System Market by Type, 2018 - 2021, USD Thousands
- TABLE 4 Global Automated Waste Collection System Market by Type, 2022 - 2028, USD Thousands
- TABLE 5 Global Full Vacuum System Market by Region, 2018 - 2021, USD Thousands
- TABLE 6 Global Full Vacuum System Market by Region, 2022 - 2028, USD Thousands
- TABLE 7 Global Gravity Vacuum System Market by Region, 2018 - 2021, USD Thousands
- TABLE 8 Global Gravity Vacuum System Market by Region, 2022 - 2028, USD Thousands
- TABLE 9 Global Automated Waste Collection System Market by Operation, 2018 - 2021, USD Thousands
- TABLE 10 Global Automated Waste Collection System Market by Operation, 2022 - 2028, USD Thousands
- TABLE 11 Global Stationary Market by Region, 2018 - 2021, USD Thousands
- TABLE 12 Global Stationary Market by Region, 2022 - 2028, USD Thousands
- TABLE 13 Global Mobile Market by Region, 2018 - 2021, USD Thousands
- TABLE 14 Global Mobile Market by Region, 2022 - 2028, USD Thousands
- TABLE 15 Global Automated Waste Collection System Market by Application, 2018 - 2021, USD Thousands
- TABLE 16 Global Automated Waste Collection System Market by Application, 2022 - 2028, USD Thousands
- TABLE 17 Global Industries Market by Region, 2018 - 2021, USD Thousands
- TABLE 18 Global Industries Market by Region, 2022 - 2028, USD Thousands
- TABLE 19 Global Hospitals Market by Region, 2018 - 2021, USD Thousands
- TABLE 20 Global Hospitals Market by Region, 2022 - 2028, USD Thousands
- TABLE 21 Global Food Markets Market by Region, 2018 - 2021, USD Thousands
- TABLE 22 Global Food Markets Market by Region, 2022 - 2028, USD Thousands
- TABLE 23 Global Airports Market by Region, 2018 - 2021, USD Thousands
- TABLE 24 Global Airports Market by Region, 2022 - 2028, USD Thousands
- TABLE 25 Global Sporting Stadium Market by Region, 2018 - 2021, USD Thousands
- TABLE 26 Global Sporting Stadium Market by Region, 2022 - 2028, USD Thousands
- TABLE 27 Global Others Market by Region, 2018 - 2021, USD Thousands
- TABLE 28 Global Others Market by Region, 2022 - 2028, USD Thousands
- TABLE 29 Global Automated Waste Collection System Market by Region, 2018 - 2021, USD Thousands
- TABLE 30 Global Automated Waste Collection System Market by Region, 2022 - 2028, USD Thousands
- TABLE 31 North America Automated Waste Collection System Market, 2018 - 2021, USD Thousands
- TABLE 32 North America Automated Waste Collection System Market, 2022 - 2028, USD Thousands
- TABLE 33 North America Automated Waste Collection System Market by Type, 2018 - 2021, USD Thousands
- TABLE 34 North America Automated Waste Collection System Market by Type, 2022 - 2028, USD Thousands
- TABLE 35 North America Full Vacuum System Market by Country, 2018 - 2021, USD Thousands
- TABLE 36 North America Full Vacuum System Market by Country, 2022 - 2028, USD Thousands
- TABLE 37 North America Gravity Vacuum System Market by Country, 2018 - 2021, USD Thousands
- TABLE 38 North America Gravity Vacuum System Market by Country, 2022 - 2028, USD Thousands
- TABLE 39 North America Automated Waste Collection System Market by Operation, 2018 - 2021, USD Thousands
- TABLE 40 North America Automated Waste Collection System Market by Operation, 2022 - 2028, USD Thousands
- TABLE 41 North America Stationary Market by Country, 2018 - 2021, USD Thousands
- TABLE 42 North America Stationary Market by Country, 2022 - 2028, USD Thousands
- TABLE 43 North America Mobile Market by Country, 2018 - 2021, USD Thousands
- TABLE 44 North America Mobile Market by Country, 2022 - 2028, USD Thousands
- TABLE 45 North America Automated Waste Collection System Market by Application, 2018 - 2021, USD Thousands
- TABLE 46 North America Automated Waste Collection System Market by Application, 2022 - 2028, USD Thousands
- TABLE 47 North America Industries Market by Country, 2018 - 2021, USD Thousands
- TABLE 48 North America Industries Market by Country, 2022 - 2028, USD Thousands
- TABLE 49 North America Hospitals Market by Country, 2018 - 2021, USD Thousands
- TABLE 50 North America Hospitals Market by Country, 2022 - 2028, USD Thousands
- TABLE 51 North America Food Markets Market by Country, 2018 - 2021, USD Thousands
- TABLE 52 North America Food Markets Market by Country, 2022 - 2028, USD Thousands
- TABLE 53 North America Airports Market by Country, 2018 - 2021, USD Thousands
- TABLE 54 North America Airports Market by Country, 2022 - 2028, USD Thousands
- TABLE 55 North America Sporting Stadium Market by Country, 2018 - 2021, USD Thousands
- TABLE 56 North America Sporting Stadium Market by Country, 2022 - 2028, USD Thousands
- TABLE 57 North America Others Market by Country, 2018 - 2021, USD Thousands
- TABLE 58 North America Others Market by Country, 2022 - 2028, USD Thousands
- TABLE 59 North America Automated Waste Collection System Market by Country, 2018 - 2021, USD Thousands
- TABLE 60 North America Automated Waste Collection System Market by Country, 2022 - 2028, USD Thousands
- TABLE 61 US Automated Waste Collection System Market, 2018 - 2021, USD Thousands
- TABLE 62 US Automated Waste Collection System Market, 2022 - 2028, USD Thousands
- TABLE 63 US Automated Waste Collection System Market by Type, 2018 - 2021, USD Thousands
- TABLE 64 US Automated Waste Collection System Market by Type, 2022 - 2028, USD Thousands
- TABLE 65 US Automated Waste Collection System Market by Operation, 2018 - 2021, USD Thousands
- TABLE 66 US Automated Waste Collection System Market by Operation, 2022 - 2028, USD Thousands
- TABLE 67 US Automated Waste Collection System Market by Application, 2018 - 2021, USD Thousands
- TABLE 68 US Automated Waste Collection System Market by Application, 2022 - 2028, USD Thousands
- TABLE 69 Canada Automated Waste Collection System Market, 2018 - 2021, USD Thousands
- TABLE 70 Canada Automated Waste Collection System Market, 2022 - 2028, USD Thousands
- TABLE 71 Canada Automated Waste Collection System Market by Type, 2018 - 2021, USD Thousands
- TABLE 72 Canada Automated Waste Collection System Market by Type, 2022 - 2028, USD Thousands
- TABLE 73 Canada Automated Waste Collection System Market by Operation, 2018 - 2021, USD Thousands
- TABLE 74 Canada Automated Waste Collection System Market by Operation, 2022 - 2028, USD Thousands
- TABLE 75 Canada Automated Waste Collection System Market by Application, 2018 - 2021, USD Thousands
- TABLE 76 Canada Automated Waste Collection System Market by Application, 2022 - 2028, USD Thousands
- TABLE 77 Mexico Automated Waste Collection System Market, 2018 - 2021, USD Thousands
- TABLE 78 Mexico Automated Waste Collection System Market, 2022 - 2028, USD Thousands
- TABLE 79 Mexico Automated Waste Collection System Market by Type, 2018 - 2021, USD Thousands
- TABLE 80 Mexico Automated Waste Collection System Market by Type, 2022 - 2028, USD Thousands
- TABLE 81 Mexico Automated Waste Collection System Market by Operation, 2018 - 2021, USD Thousands
- TABLE 82 Mexico Automated Waste Collection System Market by Operation, 2022 - 2028, USD Thousands
- TABLE 83 Mexico Automated Waste Collection System Market by Application, 2018 - 2021, USD Thousands
- TABLE 84 Mexico Automated Waste Collection System Market by Application, 2022 - 2028, USD Thousands
- TABLE 85 Rest of North America Automated Waste Collection System Market, 2018 - 2021, USD Thousands
- TABLE 86 Rest of North America Automated Waste Collection System Market, 2022 - 2028, USD Thousands
- TABLE 87 Rest of North America Automated Waste Collection System Market by Type, 2018 - 2021, USD Thousands
- TABLE 88 Rest of North America Automated Waste Collection System Market by Type, 2022 - 2028, USD Thousands
- TABLE 89 Rest of North America Automated Waste Collection System Market by Operation, 2018 - 2021, USD Thousands
- TABLE 90 Rest of North America Automated Waste Collection System Market by Operation, 2022 - 2028, USD Thousands
- TABLE 91 Rest of North America Automated Waste Collection System Market by Application, 2018 - 2021, USD Thousands
- TABLE 92 Rest of North America Automated Waste Collection System Market by Application, 2022 - 2028, USD Thousands
- TABLE 93 Europe Automated Waste Collection System Market, 2018 - 2021, USD Thousands
- TABLE 94 Europe Automated Waste Collection System Market, 2022 - 2028, USD Thousands
- TABLE 95 Europe Automated Waste Collection System Market by Type, 2018 - 2021, USD Thousands
- TABLE 96 Europe Automated Waste Collection System Market by Type, 2022 - 2028, USD Thousands
- TABLE 97 Europe Full Vacuum System Market by Country, 2018 - 2021, USD Thousands
- TABLE 98 Europe Full Vacuum System Market by Country, 2022 - 2028, USD Thousands
- TABLE 99 Europe Gravity Vacuum System Market by Country, 2018 - 2021, USD Thousands
- TABLE 100 Europe Gravity Vacuum System Market by Country, 2022 - 2028, USD Thousands
- TABLE 101 Europe Automated Waste Collection System Market by Operation, 2018 - 2021, USD Thousands
- TABLE 102 Europe Automated Waste Collection System Market by Operation, 2022 - 2028, USD Thousands
- TABLE 103 Europe Stationary Market by Country, 2018 - 2021, USD Thousands
- TABLE 104 Europe Stationary Market by Country, 2022 - 2028, USD Thousands
- TABLE 105 Europe Mobile Market by Country, 2018 - 2021, USD Thousands
- TABLE 106 Europe Mobile Market by Country, 2022 - 2028, USD Thousands
- TABLE 107 Europe Automated Waste Collection System Market by Application, 2018 - 2021, USD Thousands
- TABLE 108 Europe Automated Waste Collection System Market by Application, 2022 - 2028, USD Thousands
- TABLE 109 Europe Industries Market by Country, 2018 - 2021, USD Thousands
- TABLE 110 Europe Industries Market by Country, 2022 - 2028, USD Thousands
- TABLE 111 Europe Hospitals Market by Country, 2018 - 2021, USD Thousands
- TABLE 112 Europe Hospitals Market by Country, 2022 - 2028, USD Thousands
- TABLE 113 Europe Food Markets Market by Country, 2018 - 2021, USD Thousands
- TABLE 114 Europe Food Markets Market by Country, 2022 - 2028, USD Thousands
- TABLE 115 Europe Airports Market by Country, 2018 - 2021, USD Thousands
- TABLE 116 Europe Airports Market by Country, 2022 - 2028, USD Thousands
- TABLE 117 Europe Sporting Stadium Market by Country, 2018 - 2021, USD Thousands
- TABLE 118 Europe Sporting Stadium Market by Country, 2022 - 2028, USD Thousands
- TABLE 119 Europe Others Market by Country, 2018 - 2021, USD Thousands
- TABLE 120 Europe Others Market by Country, 2022 - 2028, USD Thousands
- TABLE 121 Europe Automated Waste Collection System Market by Country, 2018 - 2021, USD Thousands
- TABLE 122 Europe Automated Waste Collection System Market by Country, 2022 - 2028, USD Thousands
- TABLE 123 Germany Automated Waste Collection System Market, 2018 - 2021, USD Thousands
- TABLE 124 Germany Automated Waste Collection System Market, 2022 - 2028, USD Thousands
- TABLE 125 Germany Automated Waste Collection System Market by Type, 2018 - 2021, USD Thousands
- TABLE 126 Germany Automated Waste Collection System Market by Type, 2022 - 2028, USD Thousands
- TABLE 127 Germany Automated Waste Collection System Market by Operation, 2018 - 2021, USD Thousands
- TABLE 128 Germany Automated Waste Collection System Market by Operation, 2022 - 2028, USD Thousands
- TABLE 129 Germany Automated Waste Collection System Market by Application, 2018 - 2021, USD Thousands
- TABLE 130 Germany Automated Waste Collection System Market by Application, 2022 - 2028, USD Thousands
- TABLE 131 UK Automated Waste Collection System Market, 2018 - 2021, USD Thousands
- TABLE 132 UK Automated Waste Collection System Market, 2022 - 2028, USD Thousands
- TABLE 133 UK Automated Waste Collection System Market by Type, 2018 - 2021, USD Thousands
- TABLE 134 UK Automated Waste Collection System Market by Type, 2022 - 2028, USD Thousands
- TABLE 135 UK Automated Waste Collection System Market by Operation, 2018 - 2021, USD Thousands
- TABLE 136 UK Automated Waste Collection System Market by Operation, 2022 - 2028, USD Thousands
- TABLE 137 UK Automated Waste Collection System Market by Application, 2018 - 2021, USD Thousands
- TABLE 138 UK Automated Waste Collection System Market by Application, 2022 - 2028, USD Thousands
- TABLE 139 France Automated Waste Collection System Market, 2018 - 2021, USD Thousands
- TABLE 140 France Automated Waste Collection System Market, 2022 - 2028, USD Thousands
- TABLE 141 France Automated Waste Collection System Market by Type, 2018 - 2021, USD Thousands
- TABLE 142 France Automated Waste Collection System Market by Type, 2022 - 2028, USD Thousands
- TABLE 143 France Automated Waste Collection System Market by Operation, 2018 - 2021, USD Thousands
- TABLE 144 France Automated Waste Collection System Market by Operation, 2022 - 2028, USD Thousands
- TABLE 145 France Automated Waste Collection System Market by Application, 2018 - 2021, USD Thousands
- TABLE 146 France Automated Waste Collection System Market by Application, 2022 - 2028, USD Thousands
- TABLE 147 Russia Automated Waste Collection System Market, 2018 - 2021, USD Thousands
- TABLE 148 Russia Automated Waste Collection System Market, 2022 - 2028, USD Thousands
- TABLE 149 Russia Automated Waste Collection System Market by Type, 2018 - 2021, USD Thousands
- TABLE 150 Russia Automated Waste Collection System Market by Type, 2022 - 2028, USD Thousands
- TABLE 151 Russia Automated Waste Collection System Market by Operation, 2018 - 2021, USD Thousands
- TABLE 152 Russia Automated Waste Collection System Market by Operation, 2022 - 2028, USD Thousands
- TABLE 153 Russia Automated Waste Collection System Market by Application, 2018 - 2021, USD Thousands
- TABLE 154 Russia Automated Waste Collection System Market by Application, 2022 - 2028, USD Thousands
- TABLE 155 Spain Automated Waste Collection System Market, 2018 - 2021, USD Thousands
- TABLE 156 Spain Automated Waste Collection System Market, 2022 - 2028, USD Thousands
- TABLE 157 Spain Automated Waste Collection System Market by Type, 2018 - 2021, USD Thousands
- TABLE 158 Spain Automated Waste Collection System Market by Type, 2022 - 2028, USD Thousands
- TABLE 159 Spain Automated Waste Collection System Market by Operation, 2018 - 2021, USD Thousands
- TABLE 160 Spain Automated Waste Collection System Market by Operation, 2022 - 2028, USD Thousands
- TABLE 161 Spain Automated Waste Collection System Market by Application, 2018 - 2021, USD Thousands
- TABLE 162 Spain Automated Waste Collection System Market by Application, 2022 - 2028, USD Thousands
- TABLE 163 Italy Automated Waste Collection System Market, 2018 - 2021, USD Thousands
- TABLE 164 Italy Automated Waste Collection System Market, 2022 - 2028, USD Thousands
- TABLE 165 Italy Automated Waste Collection System Market by Type, 2018 - 2021, USD Thousands
- TABLE 166 Italy Automated Waste Collection System Market by Type, 2022 - 2028, USD Thousands
- TABLE 167 Italy Automated Waste Collection System Market by Operation, 2018 - 2021, USD Thousands
- TABLE 168 Italy Automated Waste Collection System Market by Operation, 2022 - 2028, USD Thousands
- TABLE 169 Italy Automated Waste Collection System Market by Application, 2018 - 2021, USD Thousands
- TABLE 170 Italy Automated Waste Collection System Market by Application, 2022 - 2028, USD Thousands
- TABLE 171 Rest of Europe Automated Waste Collection System Market, 2018 - 2021, USD Thousands
- TABLE 172 Rest of Europe Automated Waste Collection System Market, 2022 - 2028, USD Thousands
- TABLE 173 Rest of Europe Automated Waste Collection System Market by Type, 2018 - 2021, USD Thousands
- TABLE 174 Rest of Europe Automated Waste Collection System Market by Type, 2022 - 2028, USD Thousands
- TABLE 175 Rest of Europe Automated Waste Collection System Market by Operation, 2018 - 2021, USD Thousands
- TABLE 176 Rest of Europe Automated Waste Collection System Market by Operation, 2022 - 2028, USD Thousands
- TABLE 177 Rest of Europe Automated Waste Collection System Market by Application, 2018 - 2021, USD Thousands
- TABLE 178 Rest of Europe Automated Waste Collection System Market by Application, 2022 - 2028, USD Thousands
- TABLE 179 Asia Pacific Automated Waste Collection System Market, 2018 - 2021, USD Thousands
- TABLE 180 Asia Pacific Automated Waste Collection System Market, 2022 - 2028, USD Thousands
- TABLE 181 Asia Pacific Automated Waste Collection System Market by Type, 2018 - 2021, USD Thousands
- TABLE 182 Asia Pacific Automated Waste Collection System Market by Type, 2022 - 2028, USD Thousands
- TABLE 183 Asia Pacific Full Vacuum System Market by Country, 2018 - 2021, USD Thousands
- TABLE 184 Asia Pacific Full Vacuum System Market by Country, 2022 - 2028, USD Thousands
- TABLE 185 Asia Pacific Gravity Vacuum System Market by Country, 2018 - 2021, USD Thousands
- TABLE 186 Asia Pacific Gravity Vacuum System Market by Country, 2022 - 2028, USD Thousands
- TABLE 187 Asia Pacific Automated Waste Collection System Market by Operation, 2018 - 2021, USD Thousands
- TABLE 188 Asia Pacific Automated Waste Collection System Market by Operation, 2022 - 2028, USD Thousands
- TABLE 189 Asia Pacific Stationary Market by Country, 2018 - 2021, USD Thousands
- TABLE 190 Asia Pacific Stationary Market by Country, 2022 - 2028, USD Thousands
- TABLE 191 Asia Pacific Mobile Market by Country, 2018 - 2021, USD Thousands
- TABLE 192 Asia Pacific Mobile Market by Country, 2022 - 2028, USD Thousands
- TABLE 193 Asia Pacific Automated Waste Collection System Market by Application, 2018 - 2021, USD Thousands
- TABLE 194 Asia Pacific Automated Waste Collection System Market by Application, 2022 - 2028, USD Thousands
- TABLE 195 Asia Pacific Industries Market by Country, 2018 - 2021, USD Thousands
- TABLE 196 Asia Pacific Industries Market by Country, 2022 - 2028, USD Thousands
- TABLE 197 Asia Pacific Hospitals Market by Country, 2018 - 2021, USD Thousands
- TABLE 198 Asia Pacific Hospitals Market by Country, 2022 - 2028, USD Thousands
- TABLE 199 Asia Pacific Food Markets Market by Country, 2018 - 2021, USD Thousands
- TABLE 200 Asia Pacific Food Markets Market by Country, 2022 - 2028, USD Thousands
- TABLE 201 Asia Pacific Airports Market by Country, 2018 - 2021, USD Thousands
- TABLE 202 Asia Pacific Airports Market by Country, 2022 - 2028, USD Thousands
- TABLE 203 Asia Pacific Sporting Stadium Market by Country, 2018 - 2021, USD Thousands
- TABLE 204 Asia Pacific Sporting Stadium Market by Country, 2022 - 2028, USD Thousands
- TABLE 205 Asia Pacific Others Market by Country, 2018 - 2021, USD Thousands
- TABLE 206 Asia Pacific Others Market by Country, 2022 - 2028, USD Thousands
- TABLE 207 Asia Pacific Automated Waste Collection System Market by Country, 2018 - 2021, USD Thousands
- TABLE 208 Asia Pacific Automated Waste Collection System Market by Country, 2022 - 2028, USD Thousands
- TABLE 209 China Automated Waste Collection System Market, 2018 - 2021, USD Thousands
- TABLE 210 China Automated Waste Collection System Market, 2022 - 2028, USD Thousands
- TABLE 211 China Automated Waste Collection System Market by Type, 2018 - 2021, USD Thousands
- TABLE 212 China Automated Waste Collection System Market by Type, 2022 - 2028, USD Thousands
- TABLE 213 China Automated Waste Collection System Market by Operation, 2018 - 2021, USD Thousands
- TABLE 214 China Automated Waste Collection System Market by Operation, 2022 - 2028, USD Thousands
- TABLE 215 China Automated Waste Collection System Market by Application, 2018 - 2021, USD Thousands
- TABLE 216 China Automated Waste Collection System Market by Application, 2022 - 2028, USD Thousands
- TABLE 217 Japan Automated Waste Collection System Market, 2018 - 2021, USD Thousands
- TABLE 218 Japan Automated Waste Collection System Market, 2022 - 2028, USD Thousands
- TABLE 219 Japan Automated Waste Collection System Market by Type, 2018 - 2021, USD Thousands
- TABLE 220 Japan Automated Waste Collection System Market by Type, 2022 - 2028, USD Thousands
- TABLE 221 Japan Automated Waste Collection System Market by Operation, 2018 - 2021, USD Thousands
- TABLE 222 Japan Automated Waste Collection System Market by Operation, 2022 - 2028, USD Thousands
- TABLE 223 Japan Automated Waste Collection System Market by Application, 2018 - 2021, USD Thousands
- TABLE 224 Japan Automated Waste Collection System Market by Application, 2022 - 2028, USD Thousands
- TABLE 225 India Automated Waste Collection System Market, 2018 - 2021, USD Thousands
- TABLE 226 India Automated Waste Collection System Market, 2022 - 2028, USD Thousands
- TABLE 227 India Automated Waste Collection System Market by Type, 2018 - 2021, USD Thousands
- TABLE 228 India Automated Waste Collection System Market by Type, 2022 - 2028, USD Thousands
- TABLE 229 India Automated Waste Collection System Market by Operation, 2018 - 2021, USD Thousands
- TABLE 230 India Automated Waste Collection System Market by Operation, 2022 - 2028, USD Thousands
- TABLE 231 India Automated Waste Collection System Market by Application, 2018 - 2021, USD Thousands
- TABLE 232 India Automated Waste Collection System Market by Application, 2022 - 2028, USD Thousands
- TABLE 233 South Korea Automated Waste Collection System Market, 2018 - 2021, USD Thousands
- TABLE 234 South Korea Automated Waste Collection System Market, 2022 - 2028, USD Thousands
- TABLE 235 South Korea Automated Waste Collection System Market by Type, 2018 - 2021, USD Thousands
- TABLE 236 South Korea Automated Waste Collection System Market by Type, 2022 - 2028, USD Thousands
- TABLE 237 South Korea Automated Waste Collection System Market by Operation, 2018 - 2021, USD Thousands
- TABLE 238 South Korea Automated Waste Collection System Market by Operation, 2022 - 2028, USD Thousands
- TABLE 239 South Korea Automated Waste Collection System Market by Application, 2018 - 2021, USD Thousands
- TABLE 240 South Korea Automated Waste Collection System Market by Application, 2022 - 2028, USD Thousands
- TABLE 241 Singapore Automated Waste Collection System Market, 2018 - 2021, USD Thousands
- TABLE 242 Singapore Automated Waste Collection System Market, 2022 - 2028, USD Thousands
- TABLE 243 Singapore Automated Waste Collection System Market by Type, 2018 - 2021, USD Thousands
- TABLE 244 Singapore Automated Waste Collection System Market by Type, 2022 - 2028, USD Thousands
- TABLE 245 Singapore Automated Waste Collection System Market by Operation, 2018 - 2021, USD Thousands
- TABLE 246 Singapore Automated Waste Collection System Market by Operation, 2022 - 2028, USD Thousands
- TABLE 247 Singapore Automated Waste Collection System Market by Application, 2018 - 2021, USD Thousands
- TABLE 248 Singapore Automated Waste Collection System Market by Application, 2022 - 2028, USD Thousands
- TABLE 249 Malaysia Automated Waste Collection System Market, 2018 - 2021, USD Thousands
- TABLE 250 Malaysia Automated Waste Collection System Market, 2022 - 2028, USD Thousands
- TABLE 251 Malaysia Automated Waste Collection System Market by Type, 2018 - 2021, USD Thousands
- TABLE 252 Malaysia Automated Waste Collection System Market by Type, 2022 - 2028, USD Thousands
- TABLE 253 Malaysia Automated Waste Collection System Market by Operation, 2018 - 2021, USD Thousands
- TABLE 254 Malaysia Automated Waste Collection System Market by Operation, 2022 - 2028, USD Thousands
- TABLE 255 Malaysia Automated Waste Collection System Market by Application, 2018 - 2021, USD Thousands
- TABLE 256 Malaysia Automated Waste Collection System Market by Application, 2022 - 2028, USD Thousands
- TABLE 257 Rest of Asia Pacific Automated Waste Collection System Market, 2018 - 2021, USD Thousands
- TABLE 258 Rest of Asia Pacific Automated Waste Collection System Market, 2022 - 2028, USD Thousands
- TABLE 259 Rest of Asia Pacific Automated Waste Collection System Market by Type, 2018 - 2021, USD Thousands
- TABLE 260 Rest of Asia Pacific Automated Waste Collection System Market by Type, 2022 - 2028, USD Thousands
- TABLE 261 Rest of Asia Pacific Automated Waste Collection System Market by Operation, 2018 - 2021, USD Thousands
- TABLE 262 Rest of Asia Pacific Automated Waste Collection System Market by Operation, 2022 - 2028, USD Thousands
- TABLE 263 Rest of Asia Pacific Automated Waste Collection System Market by Application, 2018 - 2021, USD Thousands
- TABLE 264 Rest of Asia Pacific Automated Waste Collection System Market by Application, 2022 - 2028, USD Thousands
- TABLE 265 LAMEA Automated Waste Collection System Market, 2018 - 2021, USD Thousands
- TABLE 266 LAMEA Automated Waste Collection System Market, 2022 - 2028, USD Thousands
- TABLE 267 LAMEA Automated Waste Collection System Market by Type, 2018 - 2021, USD Thousands
- TABLE 268 LAMEA Automated Waste Collection System Market by Type, 2022 - 2028, USD Thousands
- TABLE 269 LAMEA Full Vacuum System Market by Country, 2018 - 2021, USD Thousands
- TABLE 270 LAMEA Full Vacuum System Market by Country, 2022 - 2028, USD Thousands
- TABLE 271 LAMEA Gravity Vacuum System Market by Country, 2018 - 2021, USD Thousands
- TABLE 272 LAMEA Gravity Vacuum System Market by Country, 2022 - 2028, USD Thousands
- TABLE 273 LAMEA Automated Waste Collection System Market by Operation, 2018 - 2021, USD Thousands
- TABLE 274 LAMEA Automated Waste Collection System Market by Operation, 2022 - 2028, USD Thousands
- TABLE 275 LAMEA Stationary Market by Country, 2018 - 2021, USD Thousands
- TABLE 276 LAMEA Stationary Market by Country, 2022 - 2028, USD Thousands
- TABLE 277 LAMEA Mobile Market by Country, 2018 - 2021, USD Thousands
- TABLE 278 LAMEA Mobile Market by Country, 2022 - 2028, USD Thousands
- TABLE 279 LAMEA Automated Waste Collection System Market by Application, 2018 - 2021, USD Thousands
- TABLE 280 LAMEA Automated Waste Collection System Market by Application, 2022 - 2028, USD Thousands
- TABLE 281 LAMEA Industries Market by Country, 2018 - 2021, USD Thousands
- TABLE 282 LAMEA Industries Market by Country, 2022 - 2028, USD Thousands
- TABLE 283 LAMEA Hospitals Market by Country, 2018 - 2021, USD Thousands
- TABLE 284 LAMEA Hospitals Market by Country, 2022 - 2028, USD Thousands
- TABLE 285 LAMEA Food Markets Market by Country, 2018 - 2021, USD Thousands
- TABLE 286 LAMEA Food Markets Market by Country, 2022 - 2028, USD Thousands
- TABLE 287 LAMEA Airports Market by Country, 2018 - 2021, USD Thousands
- TABLE 288 LAMEA Airports Market by Country, 2022 - 2028, USD Thousands
- TABLE 289 LAMEA Sporting Stadium Market by Country, 2018 - 2021, USD Thousands
- TABLE 290 LAMEA Sporting Stadium Market by Country, 2022 - 2028, USD Thousands
- TABLE 291 LAMEA Others Market by Country, 2018 - 2021, USD Thousands
- TABLE 292 LAMEA Others Market by Country, 2022 - 2028, USD Thousands
- TABLE 293 LAMEA Automated Waste Collection System Market by Country, 2018 - 2021, USD Thousands
- TABLE 294 LAMEA Automated Waste Collection System Market by Country, 2022 - 2028, USD Thousands
- TABLE 295 Brazil Automated Waste Collection System Market, 2018 - 2021, USD Thousands
- TABLE 296 Brazil Automated Waste Collection System Market, 2022 - 2028, USD Thousands
- TABLE 297 Brazil Automated Waste Collection System Market by Type, 2018 - 2021, USD Thousands
- TABLE 298 Brazil Automated Waste Collection System Market by Type, 2022 - 2028, USD Thousands
- TABLE 299 Brazil Automated Waste Collection System Market by Operation, 2018 - 2021, USD Thousands
- TABLE 300 Brazil Automated Waste Collection System Market by Operation, 2022 - 2028, USD Thousands
- TABLE 301 Brazil Automated Waste Collection System Market by Application, 2018 - 2021, USD Thousands
- TABLE 302 Brazil Automated Waste Collection System Market by Application, 2022 - 2028, USD Thousands
- TABLE 303 Argentina Automated Waste Collection System Market, 2018 - 2021, USD Thousands
- TABLE 304 Argentina Automated Waste Collection System Market, 2022 - 2028, USD Thousands
- TABLE 305 Argentina Automated Waste Collection System Market by Type, 2018 - 2021, USD Thousands
- TABLE 306 Argentina Automated Waste Collection System Market by Type, 2022 - 2028, USD Thousands
- TABLE 307 Argentina Automated Waste Collection System Market by Operation, 2018 - 2021, USD Thousands
- TABLE 308 Argentina Automated Waste Collection System Market by Operation, 2022 - 2028, USD Thousands
- TABLE 309 Argentina Automated Waste Collection System Market by Application, 2018 - 2021, USD Thousands
- TABLE 310 Argentina Automated Waste Collection System Market by Application, 2022 - 2028, USD Thousands
- TABLE 311 UAE Automated Waste Collection System Market, 2018 - 2021, USD Thousands
- TABLE 312 UAE Automated Waste Collection System Market, 2022 - 2028, USD Thousands
- TABLE 313 UAE Automated Waste Collection System Market by Type, 2018 - 2021, USD Thousands
- TABLE 314 UAE Automated Waste Collection System Market by Type, 2022 - 2028, USD Thousands
- TABLE 315 UAE Automated Waste Collection System Market by Operation, 2018 - 2021, USD Thousands
- TABLE 316 UAE Automated Waste Collection System Market by Operation, 2022 - 2028, USD Thousands
- TABLE 317 UAE Automated Waste Collection System Market by Application, 2018 - 2021, USD Thousands
- TABLE 318 UAE Automated Waste Collection System Market by Application, 2022 - 2028, USD Thousands
- TABLE 319 Saudi Arabia Automated Waste Collection System Market, 2018 - 2021, USD Thousands
- TABLE 320 Saudi Arabia Automated Waste Collection System Market, 2022 - 2028, USD Thousands
- TABLE 321 Saudi Arabia Automated Waste Collection System Market by Type, 2018 - 2021, USD Thousands
- TABLE 322 Saudi Arabia Automated Waste Collection System Market by Type, 2022 - 2028, USD Thousands
- TABLE 323 Saudi Arabia Automated Waste Collection System Market by Operation, 2018 - 2021, USD Thousands
- TABLE 324 Saudi Arabia Automated Waste Collection System Market by Operation, 2022 - 2028, USD Thousands
- TABLE 325 Saudi Arabia Automated Waste Collection System Market by Application, 2018 - 2021, USD Thousands
- TABLE 326 Saudi Arabia Automated Waste Collection System Market by Application, 2022 - 2028, USD Thousands
- TABLE 327 South Africa Automated Waste Collection System Market, 2018 - 2021, USD Thousands
- TABLE 328 South Africa Automated Waste Collection System Market, 2022 - 2028, USD Thousands
- TABLE 329 South Africa Automated Waste Collection System Market by Type, 2018 - 2021, USD Thousands
- TABLE 330 South Africa Automated Waste Collection System Market by Type, 2022 - 2028, USD Thousands
- TABLE 331 South Africa Automated Waste Collection System Market by Operation, 2018 - 2021, USD Thousands
- TABLE 332 South Africa Automated Waste Collection System Market by Operation, 2022 - 2028, USD Thousands
- TABLE 333 South Africa Automated Waste Collection System Market by Application, 2018 - 2021, USD Thousands
- TABLE 334 South Africa Automated Waste Collection System Market by Application, 2022 - 2028, USD Thousands
- TABLE 335 Nigeria Automated Waste Collection System Market, 2018 - 2021, USD Thousands
- TABLE 336 Nigeria Automated Waste Collection System Market, 2022 - 2028, USD Thousands
- TABLE 337 Nigeria Automated Waste Collection System Market by Type, 2018 - 2021, USD Thousands
- TABLE 338 Nigeria Automated Waste Collection System Market by Type, 2022 - 2028, USD Thousands
- TABLE 339 Nigeria Automated Waste Collection System Market by Operation, 2018 - 2021, USD Thousands
- TABLE 340 Nigeria Automated Waste Collection System Market by Operation, 2022 - 2028, USD Thousands
- TABLE 341 Nigeria Automated Waste Collection System Market by Application, 2018 - 2021, USD Thousands
- TABLE 342 Nigeria Automated Waste Collection System Market by Application, 2022 - 2028, USD Thousands
- TABLE 343 Rest of LAMEA Automated Waste Collection System Market, 2018 - 2021, USD Thousands
- TABLE 344 Rest of LAMEA Automated Waste Collection System Market, 2022 - 2028, USD Thousands
- TABLE 345 Rest of LAMEA Automated Waste Collection System Market by Type, 2018 - 2021, USD Thousands
- TABLE 346 Rest of LAMEA Automated Waste Collection System Market by Type, 2022 - 2028, USD Thousands
- TABLE 347 Rest of LAMEA Automated Waste Collection System Market by Operation, 2018 - 2021, USD Thousands
- TABLE 348 Rest of LAMEA Automated Waste Collection System Market by Operation, 2022 - 2028, USD Thousands
- TABLE 349 Rest of LAMEA Automated Waste Collection System Market by Application, 2018 - 2021, USD Thousands
- TABLE 350 Rest of LAMEA Automated Waste Collection System Market by Application, 2022 - 2028, USD Thousands
- TABLE 351 Key Information - Caverion Corporation
- TABLE 352 Key Information - AMCS Group
- TABLE 353 Key Information - AWC Berhad
- TABLE 354 Key Information - Envac AB
- TABLE 355 Key Information - Aerbin ApS
- TABLE 356 Key Information - Green Wave Solutions
- TABLE 357 Key Information - Logiwaste AB
- TABLE 358 Key Information - Stream Environment SDN BHD
- TABLE 359 Key Information - MariMatic Oy
List of Figures
- FIG 1 Methodology for the research
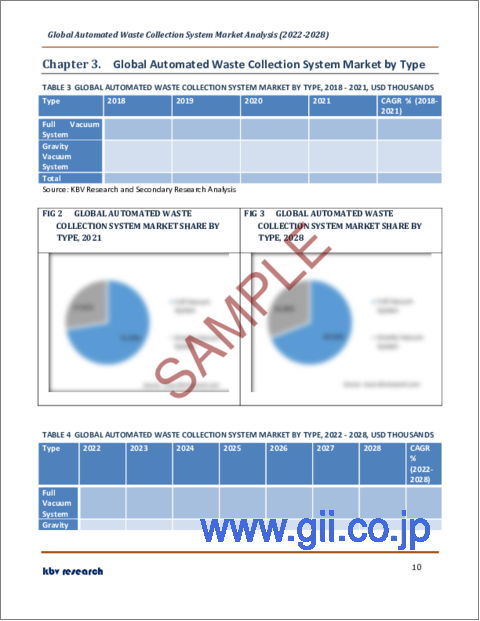
- FIG 2 Global Automated Waste Collection System Market share by Type, 2021
- FIG 3 Global Automated Waste Collection System Market share by Type, 2028
- FIG 4 Global Automated Waste Collection System Market by Type, 2018 - 2028, USD Thousands
- FIG 5 Global Automated Waste Collection System Market share by Operation, 2021
- FIG 6 Global Automated Waste Collection System Market share by Operation, 2028
- FIG 7 Global Automated Waste Collection System Market by Operation, 2018 - 2028, USD Thousands
- FIG 8 Global Automated Waste Collection System Market share by Application, 2021
- FIG 9 Global Automated Waste Collection System Market share by Application, 2028
- FIG 10 Global Automated Waste Collection System Market by Application, 2018 - 2028, USD Thousands
- FIG 11 Global Automated Waste Collection System Market share by Region, 2021
- FIG 12 Global Automated Waste Collection System Market share by Region, 2028
- FIG 13 Global Automated Waste Collection System Market by Region, 2018 - 2028, USD Thousands
- FIG 14 Recent strategies and developments: AMCS Group
The Global Automated Waste Collection System Market size is expected to reach $544.5 Million by 2028, rising at a market growth of 10.9% CAGR during the forecast period.
Automated Waste Collection Systems (AWCS), also known as a Pneumatic Waste Conveying System, is an automated machine that delivers domestic or municipal solid waste from waste chutes along with outdoor load stations into a sealed container up to 2.5 kilometers away through underground pipes at a high speed. The entire container is then picked up by a flatbed armroll vehicle at predetermined intervals.
This method drastically cuts the amount of labor needed while accelerating the entire garbage collecting process. Additionally, users can observe differences from traditional waste collection techniques, such as the need for more frequent waste removal to avoid the smell of rotting garbage, increased security levels due to reduced labor requirements and truck accessibility, and a reduction in fire hazards and vermin access.
An innovative method of processing and collecting waste is smart waste collection. Smart waste collection, which is based on Internet of Things (IoT) technology, offers information on the behavior and trends of trash generation. Municipalities, townships, and garbage collectors may now optimize their waste operations, improve their sustainability, and make better financial decisions as a result.
The waste collection operation has typically been a stagnant one. And it's only recently that people began to notice modernizations in the practices of waste management. Waste collection authorities are turning more and more to smart solutions as a way to deal with budget cuts and aggressive environmental goals as IoT technology and new innovations become commercially available.
COVID-19 Impact Analysis
Due to country-wide lockdowns and delays in the production and manufacturing of automated waste collection systems and the components that make up these systems, which are installed in residential and commercial spaces, the COVID-19 outbreak has had an impact on the growth of the automated waste collection system industry. The novel coronavirus has spread rapidly over a number of nations and regions, having a profound effect on both individual lives and the community as a whole. It began as a human health concern, but it now poses a serious threat to international trade, the economy, and the financial system.
Market Growth Factors
The Rapid Surge In The Number Of Applications And Uses Of This Technology
Healthcare establishments strongly prefer automated waste collection systems. Through a sealed, specialized pipe network, the waste management and collection systems move materials at a nearly 60 mph rate from loading stations from patient floors to a central collecting operation. Waste, composting, and soiled linen are all transported to the right collection receptacles via different channels. This is causing businesses like healthcare, hospitality, and retail to invest more money in automated collecting solutions.
Offers Highly Safe Operations Along With A Reduction In The Number Of Injuries To Labor And Workers
Workers who collect solid waste are particularly vulnerable to dangers to their health and the environment due to exposure to demanding workloads, volatile substances, and potentially dangerous or even infectious contaminants. In conventional waste collection operations, materials must be physically loaded into the collection vehicles. In general, an older workforce along with significantly heavy, repetitive physical lifting produces a growing number of injured employees.
Market Restraining Factors
People's Resistance To The Adoption Of A Novel Technology Along With A Lack Of Awareness
In the modern era, the adoption of automated waste collection systems is significantly high in a number of developing as well as developed nations due to the higher flexibility and efficiency it offers. However, in several underdeveloped and technologically weak countries, the adoption of automated waste collection systems is very low. The public's resistance to using this new and highly advanced technology is one of the main barriers preventing the market for automated waste collection systems from developing.
Type Outlook
On the basis of Type, the Automated Waste Collection System Market is bifurcated into Full vacuum system and Gravity vacuum system. In 2021, the full vacuum system segment acquired the largest revenue share of the automated waste collection system market. The demand for full vacuum automated waste collection systems is on a spike owing to their high efficiency and optimization. The market is examined with respect to a number of uses, such as stadiums, hospitals, food markets, airports, and educational institutions.
Operation Outlook
Based on Operation, the Automated Waste Collection System Market is divided into Stationary and Mobile. In 2021, the mobile segment recorded a significant revenue share of the automated waste collection system market. The increasing growth of this segment of the market is a result of the increased convenience that is offered to customers within this operation. Moreover, mobile waste collection is a very time-effective method as it significantly accelerates the entire process of collecting residential as well as commercial waste.
Application Outlook
By Application, the Automated Waste Collection System Market is segregated into Airports, Hospitals, Industries, Food markets, Sporting stadium, and Others. In 2021, the Sporting stadium segment acquired a promising revenue share of the automated waste collection system market. The surge in the growth of this segment is due to the fact that there is a high requirement for a system that can clean these sports stadiums at a very fast speed and before the event starts.
Regional Outlook
Region-Wise, the Automated Waste Collection System Market is analyzed across North America, Europe, Asia-Pacific, and LAMEA. In 2021, Europe held the largest revenue share of the automated waste collection system market. Due to its growing population, the regional market is growing at a very rapid pace. Additionally, as cities become more populated and the government places more emphasis on the correct disposal of waste to protect public health, there will be an increase in demand for automated waste collection systems.
The market research report covers the analysis of key stake holders of the market. Key companies profiled in the report include Caverion Corporation, AMCS Group, AWC Berhad, Envac AB, Aerbin ApS, Green Wave Solutions, Logiwaste AB, Stream Environment SDN BHD, and MariMatic Oy (MariMatic Group).
Scope of the Study
Market Segments covered in the Report:
By Type
- Full Vacuum System
- Gravity Vacuum System
By Operation
- Stationary
- Mobile
By Application
- Industries
- Hospitals
- Food Markets
- Airports
- Sporting Stadium
- Others
By Geography
- North America
- US
- Canada
- Mexico
- Rest of North America
- Europe
- Germany
- UK
- France
- Russia
- Spain
- Italy
- Rest of Europe
- Asia Pacific
- China
- Japan
- India
- South Korea
- Singapore
- Malaysia
- Rest of Asia Pacific
- LAMEA
- Brazil
- Argentina
- UAE
- Saudi Arabia
- South Africa
- Nigeria
- Rest of LAMEA
Companies Profiled
- Caverion Corporation
- AMCS Group
- AWC Berhad
- Envac AB
- Aerbin ApS
- Green Wave Solutions
- Logiwaste AB
- Stream Environment SDN BHD
- MariMatic Oy (MariMatic Group)
Unique Offerings from KBV Research
- Exhaustive coverage
- Highest number of market tables and figures
- Subscription based model available
- Guaranteed best price
- Assured post sales research support with 10% customization free
Table of Contents
Chapter 1. Market Scope & Methodology
- 1.1 Market Definition
- 1.2 Objectives
- 1.3 Market Scope
- 1.4 Segmentation
- 1.4.1 Global Automated Waste Collection System Market, by Type
- 1.4.2 Global Automated Waste Collection System Market, by Operation
- 1.4.3 Global Automated Waste Collection System Market, by Application
- 1.4.4 Global Automated Waste Collection System Market, by Geography
- 1.5 Methodology for the research
Chapter 2. Market Overview
- 2.1 Introduction
- 2.1.1 Overview
- 2.1.1.1 Market composition and scenario
- 2.1.1 Overview
- 2.2 Key Factors Impacting the Market
- 2.2.1 Market Drivers
- 2.2.2 Market Restraints
Chapter 3. Global Automated Waste Collection System Market by Type
- 3.1 Global Full Vacuum System Market by Region
- 3.2 Global Gravity Vacuum System Market by Region
Chapter 4. Global Automated Waste Collection System Market by Operation
- 4.1 Global Stationary Market by Region
- 4.2 Global Mobile Market by Region
Chapter 5. Global Automated Waste Collection System Market by Application
- 5.1 Global Industries Market by Region
- 5.2 Global Hospitals Market by Region
- 5.3 Global Food Markets Market by Region
- 5.4 Global Airports Market by Region
- 5.5 Global Sporting Stadium Market by Region
- 5.6 Global Others Market by Region
Chapter 6. Global Automated Waste Collection System Market by Region
- 6.1 North America Automated Waste Collection System Market
- 6.1.1 North America Automated Waste Collection System Market by Type
- 6.1.1.1 North America Full Vacuum System Market by Country
- 6.1.1.2 North America Gravity Vacuum System Market by Country
- 6.1.2 North America Automated Waste Collection System Market by Operation
- 6.1.2.1 North America Stationary Market by Country
- 6.1.2.2 North America Mobile Market by Country
- 6.1.3 North America Automated Waste Collection System Market by Application
- 6.1.3.1 North America Industries Market by Country
- 6.1.3.2 North America Hospitals Market by Country
- 6.1.3.3 North America Food Markets Market by Country
- 6.1.3.4 North America Airports Market by Country
- 6.1.3.5 North America Sporting Stadium Market by Country
- 6.1.3.6 North America Others Market by Country
- 6.1.4 North America Automated Waste Collection System Market by Country
- 6.1.4.1 US Automated Waste Collection System Market
- 6.1.4.1.1 US Automated Waste Collection System Market by Type
- 6.1.4.1.2 US Automated Waste Collection System Market by Operation
- 6.1.4.1.3 US Automated Waste Collection System Market by Application
- 6.1.4.2 Canada Automated Waste Collection System Market
- 6.1.4.2.1 Canada Automated Waste Collection System Market by Type
- 6.1.4.2.2 Canada Automated Waste Collection System Market by Operation
- 6.1.4.2.3 Canada Automated Waste Collection System Market by Application
- 6.1.4.3 Mexico Automated Waste Collection System Market
- 6.1.4.3.1 Mexico Automated Waste Collection System Market by Type
- 6.1.4.3.2 Mexico Automated Waste Collection System Market by Operation
- 6.1.4.3.3 Mexico Automated Waste Collection System Market by Application
- 6.1.4.4 Rest of North America Automated Waste Collection System Market
- 6.1.4.4.1 Rest of North America Automated Waste Collection System Market by Type
- 6.1.4.4.2 Rest of North America Automated Waste Collection System Market by Operation
- 6.1.4.4.3 Rest of North America Automated Waste Collection System Market by Application
- 6.1.4.1 US Automated Waste Collection System Market
- 6.1.1 North America Automated Waste Collection System Market by Type
- 6.2 Europe Automated Waste Collection System Market
- 6.2.1 Europe Automated Waste Collection System Market by Type
- 6.2.1.1 Europe Full Vacuum System Market by Country
- 6.2.1.2 Europe Gravity Vacuum System Market by Country
- 6.2.2 Europe Automated Waste Collection System Market by Operation
- 6.2.2.1 Europe Stationary Market by Country
- 6.2.2.2 Europe Mobile Market by Country
- 6.2.3 Europe Automated Waste Collection System Market by Application
- 6.2.3.1 Europe Industries Market by Country
- 6.2.3.2 Europe Hospitals Market by Country
- 6.2.3.3 Europe Food Markets Market by Country
- 6.2.3.4 Europe Airports Market by Country
- 6.2.3.5 Europe Sporting Stadium Market by Country
- 6.2.3.6 Europe Others Market by Country
- 6.2.4 Europe Automated Waste Collection System Market by Country
- 6.2.4.1 Germany Automated Waste Collection System Market
- 6.2.4.1.1 Germany Automated Waste Collection System Market by Type
- 6.2.4.1.2 Germany Automated Waste Collection System Market by Operation
- 6.2.4.1.3 Germany Automated Waste Collection System Market by Application
- 6.2.4.2 UK Automated Waste Collection System Market
- 6.2.4.2.1 UK Automated Waste Collection System Market by Type
- 6.2.4.2.2 UK Automated Waste Collection System Market by Operation
- 6.2.4.2.3 UK Automated Waste Collection System Market by Application
- 6.2.4.3 France Automated Waste Collection System Market
- 6.2.4.3.1 France Automated Waste Collection System Market by Type
- 6.2.4.3.2 France Automated Waste Collection System Market by Operation
- 6.2.4.3.3 France Automated Waste Collection System Market by Application
- 6.2.4.4 Russia Automated Waste Collection System Market
- 6.2.4.4.1 Russia Automated Waste Collection System Market by Type
- 6.2.4.4.2 Russia Automated Waste Collection System Market by Operation
- 6.2.4.4.3 Russia Automated Waste Collection System Market by Application
- 6.2.4.5 Spain Automated Waste Collection System Market
- 6.2.4.5.1 Spain Automated Waste Collection System Market by Type
- 6.2.4.5.2 Spain Automated Waste Collection System Market by Operation
- 6.2.4.5.3 Spain Automated Waste Collection System Market by Application
- 6.2.4.6 Italy Automated Waste Collection System Market
- 6.2.4.6.1 Italy Automated Waste Collection System Market by Type
- 6.2.4.6.2 Italy Automated Waste Collection System Market by Operation
- 6.2.4.6.3 Italy Automated Waste Collection System Market by Application
- 6.2.4.7 Rest of Europe Automated Waste Collection System Market
- 6.2.4.7.1 Rest of Europe Automated Waste Collection System Market by Type
- 6.2.4.7.2 Rest of Europe Automated Waste Collection System Market by Operation
- 6.2.4.7.3 Rest of Europe Automated Waste Collection System Market by Application
- 6.2.4.1 Germany Automated Waste Collection System Market
- 6.2.1 Europe Automated Waste Collection System Market by Type
- 6.3 Asia Pacific Automated Waste Collection System Market
- 6.3.1 Asia Pacific Automated Waste Collection System Market by Type
- 6.3.1.1 Asia Pacific Full Vacuum System Market by Country
- 6.3.1.2 Asia Pacific Gravity Vacuum System Market by Country
- 6.3.2 Asia Pacific Automated Waste Collection System Market by Operation
- 6.3.2.1 Asia Pacific Stationary Market by Country
- 6.3.2.2 Asia Pacific Mobile Market by Country
- 6.3.3 Asia Pacific Automated Waste Collection System Market by Application
- 6.3.3.1 Asia Pacific Industries Market by Country
- 6.3.3.2 Asia Pacific Hospitals Market by Country
- 6.3.3.3 Asia Pacific Food Markets Market by Country
- 6.3.3.4 Asia Pacific Airports Market by Country
- 6.3.3.5 Asia Pacific Sporting Stadium Market by Country
- 6.3.3.6 Asia Pacific Others Market by Country
- 6.3.4 Asia Pacific Automated Waste Collection System Market by Country
- 6.3.4.1 China Automated Waste Collection System Market
- 6.3.4.1.1 China Automated Waste Collection System Market by Type
- 6.3.4.1.2 China Automated Waste Collection System Market by Operation
- 6.3.4.1.3 China Automated Waste Collection System Market by Application
- 6.3.4.2 Japan Automated Waste Collection System Market
- 6.3.4.2.1 Japan Automated Waste Collection System Market by Type
- 6.3.4.2.2 Japan Automated Waste Collection System Market by Operation
- 6.3.4.2.3 Japan Automated Waste Collection System Market by Application
- 6.3.4.3 India Automated Waste Collection System Market
- 6.3.4.3.1 India Automated Waste Collection System Market by Type
- 6.3.4.3.2 India Automated Waste Collection System Market by Operation
- 6.3.4.3.3 India Automated Waste Collection System Market by Application
- 6.3.4.4 South Korea Automated Waste Collection System Market
- 6.3.4.4.1 South Korea Automated Waste Collection System Market by Type
- 6.3.4.4.2 South Korea Automated Waste Collection System Market by Operation
- 6.3.4.4.3 South Korea Automated Waste Collection System Market by Application
- 6.3.4.5 Singapore Automated Waste Collection System Market
- 6.3.4.5.1 Singapore Automated Waste Collection System Market by Type
- 6.3.4.5.2 Singapore Automated Waste Collection System Market by Operation
- 6.3.4.5.3 Singapore Automated Waste Collection System Market by Application
- 6.3.4.6 Malaysia Automated Waste Collection System Market
- 6.3.4.6.1 Malaysia Automated Waste Collection System Market by Type
- 6.3.4.6.2 Malaysia Automated Waste Collection System Market by Operation
- 6.3.4.6.3 Malaysia Automated Waste Collection System Market by Application
- 6.3.4.7 Rest of Asia Pacific Automated Waste Collection System Market
- 6.3.4.7.1 Rest of Asia Pacific Automated Waste Collection System Market by Type
- 6.3.4.7.2 Rest of Asia Pacific Automated Waste Collection System Market by Operation
- 6.3.4.7.3 Rest of Asia Pacific Automated Waste Collection System Market by Application
- 6.3.4.1 China Automated Waste Collection System Market
- 6.3.1 Asia Pacific Automated Waste Collection System Market by Type
- 6.4 LAMEA Automated Waste Collection System Market
- 6.4.1 LAMEA Automated Waste Collection System Market by Type
- 6.4.1.1 LAMEA Full Vacuum System Market by Country
- 6.4.1.2 LAMEA Gravity Vacuum System Market by Country
- 6.4.2 LAMEA Automated Waste Collection System Market by Operation
- 6.4.2.1 LAMEA Stationary Market by Country
- 6.4.2.2 LAMEA Mobile Market by Country
- 6.4.3 LAMEA Automated Waste Collection System Market by Application
- 6.4.3.1 LAMEA Industries Market by Country
- 6.4.3.2 LAMEA Hospitals Market by Country
- 6.4.3.3 LAMEA Food Markets Market by Country
- 6.4.3.4 LAMEA Airports Market by Country
- 6.4.3.5 LAMEA Sporting Stadium Market by Country
- 6.4.3.6 LAMEA Others Market by Country
- 6.4.4 LAMEA Automated Waste Collection System Market by Country
- 6.4.4.1 Brazil Automated Waste Collection System Market
- 6.4.4.1.1 Brazil Automated Waste Collection System Market by Type
- 6.4.4.1.2 Brazil Automated Waste Collection System Market by Operation
- 6.4.4.1.3 Brazil Automated Waste Collection System Market by Application
- 6.4.4.2 Argentina Automated Waste Collection System Market
- 6.4.4.2.1 Argentina Automated Waste Collection System Market by Type
- 6.4.4.2.2 Argentina Automated Waste Collection System Market by Operation
- 6.4.4.2.3 Argentina Automated Waste Collection System Market by Application
- 6.4.4.3 UAE Automated Waste Collection System Market
- 6.4.4.3.1 UAE Automated Waste Collection System Market by Type
- 6.4.4.3.2 UAE Automated Waste Collection System Market by Operation
- 6.4.4.3.3 UAE Automated Waste Collection System Market by Application
- 6.4.4.4 Saudi Arabia Automated Waste Collection System Market
- 6.4.4.4.1 Saudi Arabia Automated Waste Collection System Market by Type
- 6.4.4.4.2 Saudi Arabia Automated Waste Collection System Market by Operation
- 6.4.4.4.3 Saudi Arabia Automated Waste Collection System Market by Application
- 6.4.4.5 South Africa Automated Waste Collection System Market
- 6.4.4.5.1 South Africa Automated Waste Collection System Market by Type
- 6.4.4.5.2 South Africa Automated Waste Collection System Market by Operation
- 6.4.4.5.3 South Africa Automated Waste Collection System Market by Application
- 6.4.4.6 Nigeria Automated Waste Collection System Market
- 6.4.4.6.1 Nigeria Automated Waste Collection System Market by Type
- 6.4.4.6.2 Nigeria Automated Waste Collection System Market by Operation
- 6.4.4.6.3 Nigeria Automated Waste Collection System Market by Application
- 6.4.4.7 Rest of LAMEA Automated Waste Collection System Market
- 6.4.4.7.1 Rest of LAMEA Automated Waste Collection System Market by Type
- 6.4.4.7.2 Rest of LAMEA Automated Waste Collection System Market by Operation
- 6.4.4.7.3 Rest of LAMEA Automated Waste Collection System Market by Application
- 6.4.4.1 Brazil Automated Waste Collection System Market
- 6.4.1 LAMEA Automated Waste Collection System Market by Type
Chapter 7. Company Profiles
- 7.1 Caverion Corporation
- 7.1.1 Company Overview
- 7.1.2 Financial Analysis
- 7.1.3 Segmental and Regional Analysis
- 7.1.4 Research & Development Expenses
- 7.1.5 Recent strategies and developments:
- 7.1.5.1 Acquisition and Mergers:
- 7.2 AMCS Group
- 7.2.1 Company Overview
- 7.2.2 Recent strategies and developments:
- 7.2.2.1 Product Launches and Product Expansions:
- 7.2.2.2 Acquisition and Mergers:
- 7.3 AWC Berhad
- 7.3.1 Company Overview
- 7.3.2 Financial Analysis
- 7.3.3 Segmental and Regional Analysis
- 7.4 Envac AB
- 7.4.1 Company Overview
- 7.5 Aerbin ApS
- 7.5.1 Company Overview
- 7.6 Green Wave Solutions
- 7.6.1 Company Overview
- 7.7 Logiwaste AB
- 7.7.1 Company Overview
- 7.8 Stream Environment SDN BHD
- 7.8.1 Company Overview
- 7.9 MariMatic Oy (MariMatic Group)
- 7.9.1 Company Overview