|
|
市場調査レポート
商品コード
1115321
プロセスオーケストレーションの世界市場規模、シェア、産業動向分析レポート:コンポーネント別、業界別、組織規模別(大企業、中小企業)、導入モデル別、地域別展望と予測、2022年~2028年Global Process Orchestration Market Size, Share & Industry Trends Analysis Report By Component, By Vertical, By Organization size (Large Enterprises and SMEs), By Deployment Model,By Regional Outlook and Forecast, 2022 - 2028 |
||||||
|
|
|||||||


| プロセスオーケストレーションの世界市場規模、シェア、産業動向分析レポート:コンポーネント別、業界別、組織規模別(大企業、中小企業)、導入モデル別、地域別展望と予測、2022年~2028年 |
|
出版日: 2022年07月29日
発行: KBV Research
ページ情報: 英文 293 Pages
納期: 即納可能
|
- 全表示
- 概要
- 図表
- 目次
プロセスオーケストレーションの世界市場規模は、2028年までに126億米ドルに達し、予測期間中にCAGR17.2%の市場成長率で上昇すると予測されています。
プロセスオーケストレーション市場の成長を促進する要因としては、企業がeビジネス取引を行うにあたり、業務プロセスや他社・顧客とのやりとりの効率と質を高めるために、ビジネスプロセス自動化技術の採用が増加していることなどが挙げられます。また、運用コストの削減やITリソースの有効活用のために、企業による適切なビジネスソリューションの導入が進んでいることも、市場の拡大に寄与しています。
ITは、従来の自動化技術で特定の活動を自動化することができます。ネイティブタスクスケジューラー、カスタムスクリプト、RPAツール、ビジネスプロセス管理ツールなどが代表的な例です。自動化されたプロセスは、計画的に実行することも、オンデマンドで実行することも、関連するビジネス・イベントやITイベントによって開始することも可能です。多くのプロセスオーケストレーションツールは、実際には自動化ツールですが、いくつかの重要な違いを除き、同じ機能を提供します。
COVID-19の影響分析
COVID-19の発生により、多くの国々でロックダウンのプロトコルが導入されました。その結果、企業や組織はリモートワーク、つまり在宅勤務の文化を採用するようになっています。そのため、企業の敏捷性を高めるためのプロセスオーケストレーションツールの利用が増加しました。あらゆる企業やビジネスが、パンデミックによって、バーチャルなリモートワーク環境へとビジネスオペレーションを移行することを余儀なくされました。この危機的な状況により、企業は生産性とビジネスの敏捷性を高めるために、プロセスオーケストレーションソリューションの導入を開始しました。すべての企業とビジネスは、パンデミックによって、リモートワーク環境へ業務を移行することを余儀なくされました。
市場の成長要因
デジタルトランスフォーメーションの急速な普及
現代では、世界中でデジタル化が急速に進んでいます。企業は、手作業で行っていたプロセスを高度な自動化プロセスへと変化させる動きが活発化しています。このようなデジタル化の進展に対応するため、さまざまな企業でデジタルトランスフォーメーションが急速に進んでいます。デジタル技術の発展は、顧客の期待を絶えず変化させるため、企業は急速に進化し、増加する顧客要件に対応するための努力として、デジタル変革に大きな投資を行っています。自動化技術を導入し、企業の業務や意思決定を改善することは、デジタルトランスフォーメーションの核心となります。
リソースの最適な活用
企業は、ストレージ、処理能力、技術リソースなど、利用可能なリソースを最大限に活用することに重点を置いています。プロセスオーケストレーションは、マネージドサービスやプロフェッショナルサービス、クラウドオーケストレーションサービスを提供し、企業が他のリアルタイムプロジェクトなどの多様なプロセスを同時に処理することを可能にします。プロセスオーケストレーションは、企業のリソースを最適に利用することを可能にします。さらに、利用した分だけ支払う柔軟性と合理的な最適化により、組織の生産性を向上させます。さらに、どのようなリソースが利用可能かを把握し、プロジェクトに必要なときにそれを完了させることは、経費をコントロールし、プロジェクト運営を成功させるために必要不可欠です。あらゆる企業や組織にとって、実質的なメリットがあるのです。
市場抑制要因
性能・品質が低下する場合がある
複雑なロジックをオーケストレーションツールで実装した場合、データストアのパフォーマンスが低下することがあります。これらのツールは、データストアに大量のオブジェクトを追加し、表示には大量の関数コールを伴うことが多いです。例えば、データをマスクするため、ルックアップまたはエンタイトルメントテーブル、式、および他のもの。したがって、これらの手続きは、より多くの処理を必要とするだけでなく、いくつかのデータストアの最適化を排除する可能性もあります。ロール、ビュー、エンタイトルメントテーブルなど、より多くのオブジェクトが追加された場合、潜在的なパフォーマンスへの影響に加え、複雑な問題が頻繁に発生します。
業界別の展望
プロセスオーケストレーション市場は、産業別では、政府・防衛、エネルギー・公益事業、運輸・物流、BFSI、製造、医療・製薬、IT・通信、小売・消費財、その他に区分されます。2021年のプロセスオーケストレーション市場では、ヘルスケア・製薬分野が大きな収益シェアを獲得しています。現在、セルフケアによるパーソナライズド・ヘルスケアが推進されており、サービスのデジタル化、より安価で効果的なケアモデル、ヘルスケア分野全体がそれを後押ししています。ヘルスケアシステムの費用対効果や効率性向上のためにプロセスオーケストレーションが採用されるようになったのは、費用の増加やコネクテッドヘルス技術の期待によってもたらされた需要であると言えます。
コンポーネントの展望
プロセスオーケストレーション市場は、コンポーネントに基づいて、ソフトウェアとサービスに分類されます。2021年、ソフトウェアセグメントは、プロセスオーケストレーション市場で最も高い収益シェアを調達しました。複雑な状況にあるビジネスプロセスの標準的な手順は、プロセスオーケストレーションソフトウェアを使用することで、標準化、統合、自動化することができます。このため、世界中でプロセスオーケストレーションソフトウェアの需要が高まっています。このため、同分野の成長率は急速に高まっています。
導入モデルの展望
プロセスオーケストレーション市場は、導入モデルによって、オンプレミスとクラウドに分類されます。2021年のプロセスオーケストレーション市場では、クラウドセグメントが大きな収益シェアを記録しています。このセグメントの急成長は、この分野で事業を展開するクラウドプロバイダーの増加の結果です。また、これらのソリューションを活用するために、別のシステムを所有する必要がなくなります。さらに、中堅金融機関では、初期投資や継続的なメンテナンスが少なくて済むことから、クラウドベースのプロセスオーケストレーションソフトウェアが好まれています。
企業規模別の展望
企業規模別に見ると、プロセスオーケストレーション市場は大企業と中小企業に細分化されます。2021年のプロセスオーケストレーション市場では、大企業向けが最大の売上高シェアを獲得しています。このセグメントの拡大を促進する主な要因の1つは、大企業が最先端の技術やソリューションを採用するためにIT予算を拡大していることです。同製品は、巨大企業内のより良いチームワークを促進し、業務のスピード、効果、効率を高めることで、従業員の生産性を向上させるのに役立ちます。
地域別の展望
プロセスオーケストレーション市場は、地域別に、北米、欧州、アジア太平洋、LAMEAで分析されています。2021年のプロセスオーケストレーション市場では、北米が最大の収益シェアを占めています。デジタル化の進展や、BFSIや小売業など、この地域全体の複数のエンドユーザーによるプロセスオーケストレーションツールの利用など、いくつかの要因がこの地域での市場拡大の要因となっています。さらに、大手プレイヤーの存在は、市場拡大のために相当数の成長見通しを提供しています。
市場参加者がとる主な戦略は、買収、パートナーシップ、製品発売です。カーディナルマトリックスで提示された分析に基づいて、Oracle Corporation、IBM Corporation、Broadcom、Inc、Cisco Systems、Inc、SAP SEは、プロセスオーケストレーション市場の前身です。HCL Technologies Ltd.、Wipro Limited、Fujitsu Limitedなどの企業は、プロセスオーケストレーション市場における主要なイノベーターです。
目次
第1章 市場の範囲と調査手法
- 市場の定義.
- 目的.
- 市場規模.
- セグメンテーション.
- プロセスオーケストレーションの世界市場:コンポーネント別
- プロセスオーケストレーションの世界市場、業界別
- プロセスオーケストレーションの世界市場:組織規模別
- プロセスオーケストレーションの世界市場:配備モデル別
- プロセスオーケストレーションの世界市場、地域別
- 調査手法
第2章 市場概要
- イントロダクション
- 概要説明
- 市場の構成とシナリオ.
- 概要説明
- 市場に影響を与える主な要因.
- 市場促進要因.
- 市場の抑制要因.
第3章 競合分析-世界
- KBVカーディナルマトリックス
- 最近の業界全体の戦略的展開
- パートナーシップ、コラボレーション、契約
- 製品上市と製品拡張
- 買収と合併
- 市場シェア分析、2021年
- トップ・ウィニング・ストラテジー
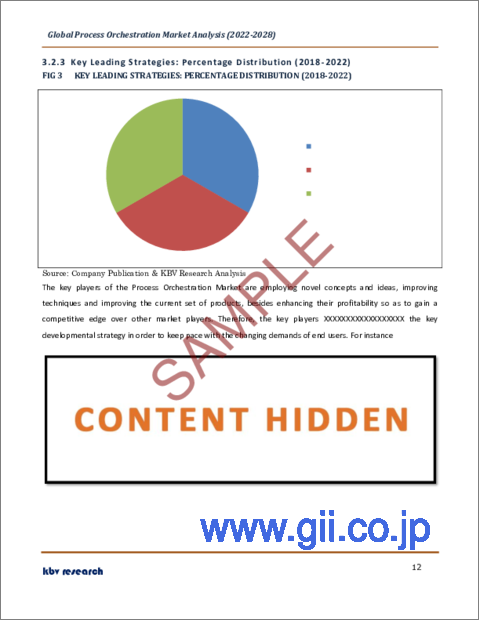
- 主要な主導的戦略。割合の分布(2018年~2022年)
第4章 プロセスオーケストレーションの世界市場:コンポーネント別
- 世界のソフトウェア地域別市場
- 世界のサービス市場:地域別
第5章 プロセスオーケストレーションの世界市場:業界別
- BFSIの世界市場:地域別
- IT・通信の世界市場:地域別
- 製造業の世界市場:地域別
- 小売・Eコマースの世界市場:地域別
- 政府・公共機関の世界市場:地域別
- ヘルスケア・ライフサイエンスの地域別世界市場
- 輸送・ロジスティクスの世界市場:地域別
- エネルギー・公益事業の地域別世界市場
- 世界のその他の業界別市場:地域別
第6章 プロセスオーケストレーションの世界市場:組織規模別
- 大企業の世界市場:地域別
- 世界の中小企業市場:地域別
第7章 プロセスオーケストレーションの世界市場:地域別プロセスオーケストレーションの世界市場:デプロイメントモデル別
- オンプレミスの世界市場:地域別
- クラウドの世界市場:地域別
第8章 プロセスオーケストレーションの世界市場:地域別
- 北米
- 北米のプロセスオーケストレーションの国別市場
- 米国
- カナダ
- メキシコ
- 北米のその他の地域
- 北米のプロセスオーケストレーションの国別市場
- 欧州
- 欧州プロセスオーケストレーション市場:国別
- ドイツ
- 英国
- フランス
- ロシア
- スペイン
- イタリア
- その他欧州
- 欧州プロセスオーケストレーション市場:国別
- アジア太平洋地域
- アジア太平洋地域のプロセスオーケストレーション市場:国別
- 中国
- 日本
- インド
- 韓国
- シンガポール
- マレーシア
- その他アジア太平洋地域
- アジア太平洋地域のプロセスオーケストレーション市場:国別
- LAMEA
- LAMEAのプロセスオーケストレーション市場:国別
- ブラジル
- アルゼンチン
- UAE
- サウジアラビア
- 南アフリカ
- ナイジェリア
- LAMEAの他の地域
- LAMEAのプロセスオーケストレーション市場:国別
第9章 企業プロファイル
- IBM Corporation
- Oracle Corporation
- SAP SE
- Broadcom, Inc.
- Fujitsu Limited
- Cisco Systems, Inc.
- Wipro Limited
- HCL Technologies Ltd.(HCL Enterprises)
- Software AG
- Tibco Software, Inc.(Vista Equity Partners)
LIST OF TABLES
- TABLE 1 Global Process Orchestration Market, 2018 - 2021, USD Million
- TABLE 2 Global Process Orchestration Market, 2022 - 2028, USD Million
- TABLE 3 Partnerships, Collaborations and Agreements- Process Orchestration Market
- TABLE 4 Product Launches And Product Expansions- Process Orchestration Market
- TABLE 5 Acquisition and Mergers- Process Orchestration Market
- TABLE 6 Global Process Orchestration Market by Component, 2018 - 2021, USD Million
- TABLE 7 Global Process Orchestration Market by Component, 2022 - 2028, USD Million
- TABLE 8 Global Software Market by Region, 2018 - 2021, USD Million
- TABLE 9 Global Software Market by Region, 2022 - 2028, USD Million
- TABLE 10 Global Services Market by Region, 2018 - 2021, USD Million
- TABLE 11 Global Services Market by Region, 2022 - 2028, USD Million
- TABLE 12 Global Process Orchestration Market by Vertical, 2018 - 2021, USD Million
- TABLE 13 Global Process Orchestration Market by Vertical, 2022 - 2028, USD Million
- TABLE 14 Global BFSI Market by Region, 2018 - 2021, USD Million
- TABLE 15 Global BFSI Market by Region, 2022 - 2028, USD Million
- TABLE 16 Global IT & Telecom Market by Region, 2018 - 2021, USD Million
- TABLE 17 Global IT & Telecom Market by Region, 2022 - 2028, USD Million
- TABLE 18 Global Manufacturing Market by Region, 2018 - 2021, USD Million
- TABLE 19 Global Manufacturing Market by Region, 2022 - 2028, USD Million
- TABLE 20 Global Retail & Ecommerce Market by Region, 2018 - 2021, USD Million
- TABLE 21 Global Retail & Ecommerce Market by Region, 2022 - 2028, USD Million
- TABLE 22 Global Government & Public Sector Market by Region, 2018 - 2021, USD Million
- TABLE 23 Global Government & Public Sector Market by Region, 2022 - 2028, USD Million
- TABLE 24 Global Healthcare & Life Sciences Market by Region, 2018 - 2021, USD Million
- TABLE 25 Global Healthcare & Life Sciences Market by Region, 2022 - 2028, USD Million
- TABLE 26 Global Transportation & Logistics Market by Region, 2018 - 2021, USD Million
- TABLE 27 Global Transportation & Logistics Market by Region, 2022 - 2028, USD Million
- TABLE 28 Global Energy & Utilities Market by Region, 2018 - 2021, USD Million
- TABLE 29 Global Energy & Utilities Market by Region, 2022 - 2028, USD Million
- TABLE 30 Global Other Vertical Market by Region, 2018 - 2021, USD Million
- TABLE 31 Global Other Vertical Market by Region, 2022 - 2028, USD Million
- TABLE 32 Global Process Orchestration Market by Organization size, 2018 - 2021, USD Million
- TABLE 33 Global Process Orchestration Market by Organization size, 2022 - 2028, USD Million
- TABLE 34 Global Large Enterprises Market by Region, 2018 - 2021, USD Million
- TABLE 35 Global Large Enterprises Market by Region, 2022 - 2028, USD Million
- TABLE 36 Global SMEs Market by Region, 2018 - 2021, USD Million
- TABLE 37 Global SMEs Market by Region, 2022 - 2028, USD Million
- TABLE 38 Global Process Orchestration Market by Deployment Model, 2018 - 2021, USD Million
- TABLE 39 Global Process Orchestration Market by Deployment Model, 2022 - 2028, USD Million
- TABLE 40 Global On-premise Market by Region, 2018 - 2021, USD Million
- TABLE 41 Global On-premise Market by Region, 2022 - 2028, USD Million
- TABLE 42 Global Cloud Market by Region, 2018 - 2021, USD Million
- TABLE 43 Global Cloud Market by Region, 2022 - 2028, USD Million
- TABLE 44 Global Process Orchestration Market by Region, 2018 - 2021, USD Million
- TABLE 45 Global Process Orchestration Market by Region, 2022 - 2028, USD Million
- TABLE 46 North America Process Orchestration Market, 2018 - 2021, USD Million
- TABLE 47 North America Process Orchestration Market, 2022 - 2028, USD Million
- TABLE 48 North America Process Orchestration Market by Component, 2018 - 2021, USD Million
- TABLE 49 North America Process Orchestration Market by Component, 2022 - 2028, USD Million
- TABLE 50 North America Software Market by Country, 2018 - 2021, USD Million
- TABLE 51 North America Software Market by Country, 2022 - 2028, USD Million
- TABLE 52 North America Services Market by Country, 2018 - 2021, USD Million
- TABLE 53 North America Services Market by Country, 2022 - 2028, USD Million
- TABLE 54 North America Process Orchestration Market by Vertical, 2018 - 2021, USD Million
- TABLE 55 North America Process Orchestration Market by Vertical, 2022 - 2028, USD Million
- TABLE 56 North America BFSI Market by Country, 2018 - 2021, USD Million
- TABLE 57 North America BFSI Market by Country, 2022 - 2028, USD Million
- TABLE 58 North America IT & Telecom Market by Country, 2018 - 2021, USD Million
- TABLE 59 North America IT & Telecom Market by Country, 2022 - 2028, USD Million
- TABLE 60 North America Manufacturing Market by Country, 2018 - 2021, USD Million
- TABLE 61 North America Manufacturing Market by Country, 2022 - 2028, USD Million
- TABLE 62 North America Retail & Ecommerce Market by Country, 2018 - 2021, USD Million
- TABLE 63 North America Retail & Ecommerce Market by Country, 2022 - 2028, USD Million
- TABLE 64 North America Government & Public Sector Market by Country, 2018 - 2021, USD Million
- TABLE 65 North America Government & Public Sector Market by Country, 2022 - 2028, USD Million
- TABLE 66 North America Healthcare & Life Sciences Market by Country, 2018 - 2021, USD Million
- TABLE 67 North America Healthcare & Life Sciences Market by Country, 2022 - 2028, USD Million
- TABLE 68 North America Transportation & Logistics Market by Country, 2018 - 2021, USD Million
- TABLE 69 North America Transportation & Logistics Market by Country, 2022 - 2028, USD Million
- TABLE 70 North America Energy & Utilities Market by Country, 2018 - 2021, USD Million
- TABLE 71 North America Energy & Utilities Market by Country, 2022 - 2028, USD Million
- TABLE 72 North America Other Vertical Market by Country, 2018 - 2021, USD Million
- TABLE 73 North America Other Vertical Market by Country, 2022 - 2028, USD Million
- TABLE 74 North America Process Orchestration Market by Organization size, 2018 - 2021, USD Million
- TABLE 75 North America Process Orchestration Market by Organization size, 2022 - 2028, USD Million
- TABLE 76 North America Large Enterprises Market by Country, 2018 - 2021, USD Million
- TABLE 77 North America Large Enterprises Market by Country, 2022 - 2028, USD Million
- TABLE 78 North America SMEs Market by Country, 2018 - 2021, USD Million
- TABLE 79 North America SMEs Market by Country, 2022 - 2028, USD Million
- TABLE 80 North America Process Orchestration Market by Deployment Model, 2018 - 2021, USD Million
- TABLE 81 North America Process Orchestration Market by Deployment Model, 2022 - 2028, USD Million
- TABLE 82 North America On-premise Market by Country, 2018 - 2021, USD Million
- TABLE 83 North America On-premise Market by Country, 2022 - 2028, USD Million
- TABLE 84 North America Cloud Market by Country, 2018 - 2021, USD Million
- TABLE 85 North America Cloud Market by Country, 2022 - 2028, USD Million
- TABLE 86 North America Process Orchestration Market by Country, 2018 - 2021, USD Million
- TABLE 87 North America Process Orchestration Market by Country, 2022 - 2028, USD Million
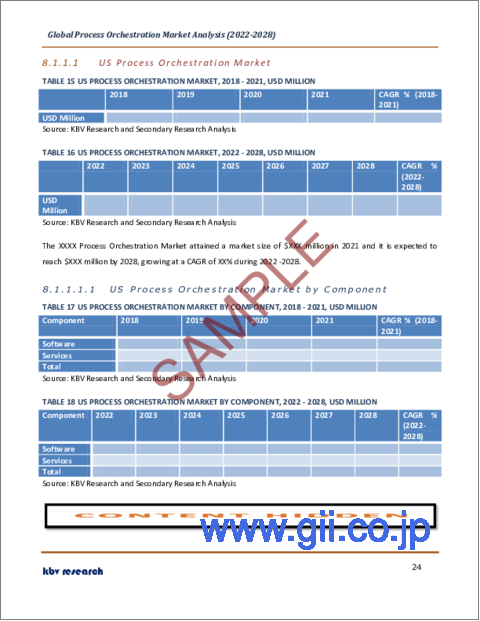
- TABLE 88 US Process Orchestration Market, 2018 - 2021, USD Million
- TABLE 89 US Process Orchestration Market, 2022 - 2028, USD Million
- TABLE 90 US Process Orchestration Market by Component, 2018 - 2021, USD Million
- TABLE 91 US Process Orchestration Market by Component, 2022 - 2028, USD Million
- TABLE 92 US Process Orchestration Market by Vertical, 2018 - 2021, USD Million
- TABLE 93 US Process Orchestration Market by Vertical, 2022 - 2028, USD Million
- TABLE 94 US Process Orchestration Market by Organization size, 2018 - 2021, USD Million
- TABLE 95 US Process Orchestration Market by Organization size, 2022 - 2028, USD Million
- TABLE 96 US Process Orchestration Market by Deployment Model, 2018 - 2021, USD Million
- TABLE 97 US Process Orchestration Market by Deployment Model, 2022 - 2028, USD Million
- TABLE 98 Canada Process Orchestration Market, 2018 - 2021, USD Million
- TABLE 99 Canada Process Orchestration Market, 2022 - 2028, USD Million
- TABLE 100 Canada Process Orchestration Market by Component, 2018 - 2021, USD Million
- TABLE 101 Canada Process Orchestration Market by Component, 2022 - 2028, USD Million
- TABLE 102 Canada Process Orchestration Market by Vertical, 2018 - 2021, USD Million
- TABLE 103 Canada Process Orchestration Market by Vertical, 2022 - 2028, USD Million
- TABLE 104 Canada Process Orchestration Market by Organization size, 2018 - 2021, USD Million
- TABLE 105 Canada Process Orchestration Market by Organization size, 2022 - 2028, USD Million
- TABLE 106 Canada Process Orchestration Market by Deployment Model, 2018 - 2021, USD Million
- TABLE 107 Canada Process Orchestration Market by Deployment Model, 2022 - 2028, USD Million
- TABLE 108 Mexico Process Orchestration Market, 2018 - 2021, USD Million
- TABLE 109 Mexico Process Orchestration Market, 2022 - 2028, USD Million
- TABLE 110 Mexico Process Orchestration Market by Component, 2018 - 2021, USD Million
- TABLE 111 Mexico Process Orchestration Market by Component, 2022 - 2028, USD Million
- TABLE 112 Mexico Process Orchestration Market by Vertical, 2018 - 2021, USD Million
- TABLE 113 Mexico Process Orchestration Market by Vertical, 2022 - 2028, USD Million
- TABLE 114 Mexico Process Orchestration Market by Organization size, 2018 - 2021, USD Million
- TABLE 115 Mexico Process Orchestration Market by Organization size, 2022 - 2028, USD Million
- TABLE 116 Mexico Process Orchestration Market by Deployment Model, 2018 - 2021, USD Million
- TABLE 117 Mexico Process Orchestration Market by Deployment Model, 2022 - 2028, USD Million
- TABLE 118 Rest of North America Process Orchestration Market, 2018 - 2021, USD Million
- TABLE 119 Rest of North America Process Orchestration Market, 2022 - 2028, USD Million
- TABLE 120 Rest of North America Process Orchestration Market by Component, 2018 - 2021, USD Million
- TABLE 121 Rest of North America Process Orchestration Market by Component, 2022 - 2028, USD Million
- TABLE 122 Rest of North America Process Orchestration Market by Vertical, 2018 - 2021, USD Million
- TABLE 123 Rest of North America Process Orchestration Market by Vertical, 2022 - 2028, USD Million
- TABLE 124 Rest of North America Process Orchestration Market by Organization size, 2018 - 2021, USD Million
- TABLE 125 Rest of North America Process Orchestration Market by Organization size, 2022 - 2028, USD Million
- TABLE 126 Rest of North America Process Orchestration Market by Deployment Model, 2018 - 2021, USD Million
- TABLE 127 Rest of North America Process Orchestration Market by Deployment Model, 2022 - 2028, USD Million
- TABLE 128 Europe Process Orchestration Market, 2018 - 2021, USD Million
- TABLE 129 Europe Process Orchestration Market, 2022 - 2028, USD Million
- TABLE 130 Europe Process Orchestration Market by Component, 2018 - 2021, USD Million
- TABLE 131 Europe Process Orchestration Market by Component, 2022 - 2028, USD Million
- TABLE 132 Europe Software Market by Country, 2018 - 2021, USD Million
- TABLE 133 Europe Software Market by Country, 2022 - 2028, USD Million
- TABLE 134 Europe Services Market by Country, 2018 - 2021, USD Million
- TABLE 135 Europe Services Market by Country, 2022 - 2028, USD Million
- TABLE 136 Europe Process Orchestration Market by Vertical, 2018 - 2021, USD Million
- TABLE 137 Europe Process Orchestration Market by Vertical, 2022 - 2028, USD Million
- TABLE 138 Europe BFSI Market by Country, 2018 - 2021, USD Million
- TABLE 139 Europe BFSI Market by Country, 2022 - 2028, USD Million
- TABLE 140 Europe IT & Telecom Market by Country, 2018 - 2021, USD Million
- TABLE 141 Europe IT & Telecom Market by Country, 2022 - 2028, USD Million
- TABLE 142 Europe Manufacturing Market by Country, 2018 - 2021, USD Million
- TABLE 143 Europe Manufacturing Market by Country, 2022 - 2028, USD Million
- TABLE 144 Europe Retail & Ecommerce Market by Country, 2018 - 2021, USD Million
- TABLE 145 Europe Retail & Ecommerce Market by Country, 2022 - 2028, USD Million
- TABLE 146 Europe Government & Public Sector Market by Country, 2018 - 2021, USD Million
- TABLE 147 Europe Government & Public Sector Market by Country, 2022 - 2028, USD Million
- TABLE 148 Europe Healthcare & Life Sciences Market by Country, 2018 - 2021, USD Million
- TABLE 149 Europe Healthcare & Life Sciences Market by Country, 2022 - 2028, USD Million
- TABLE 150 Europe Transportation & Logistics Market by Country, 2018 - 2021, USD Million
- TABLE 151 Europe Transportation & Logistics Market by Country, 2022 - 2028, USD Million
- TABLE 152 Europe Energy & Utilities Market by Country, 2018 - 2021, USD Million
- TABLE 153 Europe Energy & Utilities Market by Country, 2022 - 2028, USD Million
- TABLE 154 Europe Other Vertical Market by Country, 2018 - 2021, USD Million
- TABLE 155 Europe Other Vertical Market by Country, 2022 - 2028, USD Million
- TABLE 156 Europe Process Orchestration Market by Organization size, 2018 - 2021, USD Million
- TABLE 157 Europe Process Orchestration Market by Organization size, 2022 - 2028, USD Million
- TABLE 158 Europe Large Enterprises Market by Country, 2018 - 2021, USD Million
- TABLE 159 Europe Large Enterprises Market by Country, 2022 - 2028, USD Million
- TABLE 160 Europe SMEs Market by Country, 2018 - 2021, USD Million
- TABLE 161 Europe SMEs Market by Country, 2022 - 2028, USD Million
- TABLE 162 Europe Process Orchestration Market by Deployment Model, 2018 - 2021, USD Million
- TABLE 163 Europe Process Orchestration Market by Deployment Model, 2022 - 2028, USD Million
- TABLE 164 Europe On-premise Market by Country, 2018 - 2021, USD Million
- TABLE 165 Europe On-premise Market by Country, 2022 - 2028, USD Million
- TABLE 166 Europe Cloud Market by Country, 2018 - 2021, USD Million
- TABLE 167 Europe Cloud Market by Country, 2022 - 2028, USD Million
- TABLE 168 Europe Process Orchestration Market by Country, 2018 - 2021, USD Million
- TABLE 169 Europe Process Orchestration Market by Country, 2022 - 2028, USD Million
- TABLE 170 Germany Process Orchestration Market, 2018 - 2021, USD Million
- TABLE 171 Germany Process Orchestration Market, 2022 - 2028, USD Million
- TABLE 172 Germany Process Orchestration Market by Component, 2018 - 2021, USD Million
- TABLE 173 Germany Process Orchestration Market by Component, 2022 - 2028, USD Million
- TABLE 174 Germany Process Orchestration Market by Vertical, 2018 - 2021, USD Million
- TABLE 175 Germany Process Orchestration Market by Vertical, 2022 - 2028, USD Million
- TABLE 176 Germany Process Orchestration Market by Organization size, 2018 - 2021, USD Million
- TABLE 177 Germany Process Orchestration Market by Organization size, 2022 - 2028, USD Million
- TABLE 178 Germany Process Orchestration Market by Deployment Model, 2018 - 2021, USD Million
- TABLE 179 Germany Process Orchestration Market by Deployment Model, 2022 - 2028, USD Million
- TABLE 180 UK Process Orchestration Market, 2018 - 2021, USD Million
- TABLE 181 UK Process Orchestration Market, 2022 - 2028, USD Million
- TABLE 182 UK Process Orchestration Market by Component, 2018 - 2021, USD Million
- TABLE 183 UK Process Orchestration Market by Component, 2022 - 2028, USD Million
- TABLE 184 UK Process Orchestration Market by Vertical, 2018 - 2021, USD Million
- TABLE 185 UK Process Orchestration Market by Vertical, 2022 - 2028, USD Million
- TABLE 186 UK Process Orchestration Market by Organization size, 2018 - 2021, USD Million
- TABLE 187 UK Process Orchestration Market by Organization size, 2022 - 2028, USD Million
- TABLE 188 UK Process Orchestration Market by Deployment Model, 2018 - 2021, USD Million
- TABLE 189 UK Process Orchestration Market by Deployment Model, 2022 - 2028, USD Million
- TABLE 190 France Process Orchestration Market, 2018 - 2021, USD Million
- TABLE 191 France Process Orchestration Market, 2022 - 2028, USD Million
- TABLE 192 France Process Orchestration Market by Component, 2018 - 2021, USD Million
- TABLE 193 France Process Orchestration Market by Component, 2022 - 2028, USD Million
- TABLE 194 France Process Orchestration Market by Vertical, 2018 - 2021, USD Million
- TABLE 195 France Process Orchestration Market by Vertical, 2022 - 2028, USD Million
- TABLE 196 France Process Orchestration Market by Organization size, 2018 - 2021, USD Million
- TABLE 197 France Process Orchestration Market by Organization size, 2022 - 2028, USD Million
- TABLE 198 France Process Orchestration Market by Deployment Model, 2018 - 2021, USD Million
- TABLE 199 France Process Orchestration Market by Deployment Model, 2022 - 2028, USD Million
- TABLE 200 Russia Process Orchestration Market, 2018 - 2021, USD Million
- TABLE 201 Russia Process Orchestration Market, 2022 - 2028, USD Million
- TABLE 202 Russia Process Orchestration Market by Component, 2018 - 2021, USD Million
- TABLE 203 Russia Process Orchestration Market by Component, 2022 - 2028, USD Million
- TABLE 204 Russia Process Orchestration Market by Vertical, 2018 - 2021, USD Million
- TABLE 205 Russia Process Orchestration Market by Vertical, 2022 - 2028, USD Million
- TABLE 206 Russia Process Orchestration Market by Organization size, 2018 - 2021, USD Million
- TABLE 207 Russia Process Orchestration Market by Organization size, 2022 - 2028, USD Million
- TABLE 208 Russia Process Orchestration Market by Deployment Model, 2018 - 2021, USD Million
- TABLE 209 Russia Process Orchestration Market by Deployment Model, 2022 - 2028, USD Million
- TABLE 210 Spain Process Orchestration Market, 2018 - 2021, USD Million
- TABLE 211 Spain Process Orchestration Market, 2022 - 2028, USD Million
- TABLE 212 Spain Process Orchestration Market by Component, 2018 - 2021, USD Million
- TABLE 213 Spain Process Orchestration Market by Component, 2022 - 2028, USD Million
- TABLE 214 Spain Process Orchestration Market by Vertical, 2018 - 2021, USD Million
- TABLE 215 Spain Process Orchestration Market by Vertical, 2022 - 2028, USD Million
- TABLE 216 Spain Process Orchestration Market by Organization size, 2018 - 2021, USD Million
- TABLE 217 Spain Process Orchestration Market by Organization size, 2022 - 2028, USD Million
- TABLE 218 Spain Process Orchestration Market by Deployment Model, 2018 - 2021, USD Million
- TABLE 219 Spain Process Orchestration Market by Deployment Model, 2022 - 2028, USD Million
- TABLE 220 Italy Process Orchestration Market, 2018 - 2021, USD Million
- TABLE 221 Italy Process Orchestration Market, 2022 - 2028, USD Million
- TABLE 222 Italy Process Orchestration Market by Component, 2018 - 2021, USD Million
- TABLE 223 Italy Process Orchestration Market by Component, 2022 - 2028, USD Million
- TABLE 224 Italy Process Orchestration Market by Vertical, 2018 - 2021, USD Million
- TABLE 225 Italy Process Orchestration Market by Vertical, 2022 - 2028, USD Million
- TABLE 226 Italy Process Orchestration Market by Organization size, 2018 - 2021, USD Million
- TABLE 227 Italy Process Orchestration Market by Organization size, 2022 - 2028, USD Million
- TABLE 228 Italy Process Orchestration Market by Deployment Model, 2018 - 2021, USD Million
- TABLE 229 Italy Process Orchestration Market by Deployment Model, 2022 - 2028, USD Million
- TABLE 230 Rest of Europe Process Orchestration Market, 2018 - 2021, USD Million
- TABLE 231 Rest of Europe Process Orchestration Market, 2022 - 2028, USD Million
- TABLE 232 Rest of Europe Process Orchestration Market by Component, 2018 - 2021, USD Million
- TABLE 233 Rest of Europe Process Orchestration Market by Component, 2022 - 2028, USD Million
- TABLE 234 Rest of Europe Process Orchestration Market by Vertical, 2018 - 2021, USD Million
- TABLE 235 Rest of Europe Process Orchestration Market by Vertical, 2022 - 2028, USD Million
- TABLE 236 Rest of Europe Process Orchestration Market by Organization size, 2018 - 2021, USD Million
- TABLE 237 Rest of Europe Process Orchestration Market by Organization size, 2022 - 2028, USD Million
- TABLE 238 Rest of Europe Process Orchestration Market by Deployment Model, 2018 - 2021, USD Million
- TABLE 239 Rest of Europe Process Orchestration Market by Deployment Model, 2022 - 2028, USD Million
- TABLE 240 Asia Pacific Process Orchestration Market, 2018 - 2021, USD Million
- TABLE 241 Asia Pacific Process Orchestration Market, 2022 - 2028, USD Million
- TABLE 242 Asia Pacific Process Orchestration Market by Component, 2018 - 2021, USD Million
- TABLE 243 Asia Pacific Process Orchestration Market by Component, 2022 - 2028, USD Million
- TABLE 244 Asia Pacific Software Market by Country, 2018 - 2021, USD Million
- TABLE 245 Asia Pacific Software Market by Country, 2022 - 2028, USD Million
- TABLE 246 Asia Pacific Services Market by Country, 2018 - 2021, USD Million
- TABLE 247 Asia Pacific Services Market by Country, 2022 - 2028, USD Million
- TABLE 248 Asia Pacific Process Orchestration Market by Vertical, 2018 - 2021, USD Million
- TABLE 249 Asia Pacific Process Orchestration Market by Vertical, 2022 - 2028, USD Million
- TABLE 250 Asia Pacific BFSI Market by Country, 2018 - 2021, USD Million
- TABLE 251 Asia Pacific BFSI Market by Country, 2022 - 2028, USD Million
- TABLE 252 Asia Pacific IT & Telecom Market by Country, 2018 - 2021, USD Million
- TABLE 253 Asia Pacific IT & Telecom Market by Country, 2022 - 2028, USD Million
- TABLE 254 Asia Pacific Manufacturing Market by Country, 2018 - 2021, USD Million
- TABLE 255 Asia Pacific Manufacturing Market by Country, 2022 - 2028, USD Million
- TABLE 256 Asia Pacific Retail & Ecommerce Market by Country, 2018 - 2021, USD Million
- TABLE 257 Asia Pacific Retail & Ecommerce Market by Country, 2022 - 2028, USD Million
- TABLE 258 Asia Pacific Government & Public Sector Market by Country, 2018 - 2021, USD Million
- TABLE 259 Asia Pacific Government & Public Sector Market by Country, 2022 - 2028, USD Million
- TABLE 260 Asia Pacific Healthcare & Life Sciences Market by Country, 2018 - 2021, USD Million
- TABLE 261 Asia Pacific Healthcare & Life Sciences Market by Country, 2022 - 2028, USD Million
- TABLE 262 Asia Pacific Transportation & Logistics Market by Country, 2018 - 2021, USD Million
- TABLE 263 Asia Pacific Transportation & Logistics Market by Country, 2022 - 2028, USD Million
- TABLE 264 Asia Pacific Energy & Utilities Market by Country, 2018 - 2021, USD Million
- TABLE 265 Asia Pacific Energy & Utilities Market by Country, 2022 - 2028, USD Million
- TABLE 266 Asia Pacific Other Vertical Market by Country, 2018 - 2021, USD Million
- TABLE 267 Asia Pacific Other Vertical Market by Country, 2022 - 2028, USD Million
- TABLE 268 Asia Pacific Process Orchestration Market by Organization size, 2018 - 2021, USD Million
- TABLE 269 Asia Pacific Process Orchestration Market by Organization size, 2022 - 2028, USD Million
- TABLE 270 Asia Pacific Large Enterprises Market by Country, 2018 - 2021, USD Million
- TABLE 271 Asia Pacific Large Enterprises Market by Country, 2022 - 2028, USD Million
- TABLE 272 Asia Pacific SMEs Market by Country, 2018 - 2021, USD Million
- TABLE 273 Asia Pacific SMEs Market by Country, 2022 - 2028, USD Million
- TABLE 274 Asia Pacific Process Orchestration Market by Deployment Model, 2018 - 2021, USD Million
- TABLE 275 Asia Pacific Process Orchestration Market by Deployment Model, 2022 - 2028, USD Million
- TABLE 276 Asia Pacific On-premise Market by Country, 2018 - 2021, USD Million
- TABLE 277 Asia Pacific On-premise Market by Country, 2022 - 2028, USD Million
- TABLE 278 Asia Pacific Cloud Market by Country, 2018 - 2021, USD Million
- TABLE 279 Asia Pacific Cloud Market by Country, 2022 - 2028, USD Million
- TABLE 280 Asia Pacific Process Orchestration Market by Country, 2018 - 2021, USD Million
- TABLE 281 Asia Pacific Process Orchestration Market by Country, 2022 - 2028, USD Million
- TABLE 282 China Process Orchestration Market, 2018 - 2021, USD Million
- TABLE 283 China Process Orchestration Market, 2022 - 2028, USD Million
- TABLE 284 China Process Orchestration Market by Component, 2018 - 2021, USD Million
- TABLE 285 China Process Orchestration Market by Component, 2022 - 2028, USD Million
- TABLE 286 China Process Orchestration Market by Vertical, 2018 - 2021, USD Million
- TABLE 287 China Process Orchestration Market by Vertical, 2022 - 2028, USD Million
- TABLE 288 China Process Orchestration Market by Organization size, 2018 - 2021, USD Million
- TABLE 289 China Process Orchestration Market by Organization size, 2022 - 2028, USD Million
- TABLE 290 China Process Orchestration Market by Deployment Model, 2018 - 2021, USD Million
- TABLE 291 China Process Orchestration Market by Deployment Model, 2022 - 2028, USD Million
- TABLE 292 Japan Process Orchestration Market, 2018 - 2021, USD Million
- TABLE 293 Japan Process Orchestration Market, 2022 - 2028, USD Million
- TABLE 294 Japan Process Orchestration Market by Component, 2018 - 2021, USD Million
- TABLE 295 Japan Process Orchestration Market by Component, 2022 - 2028, USD Million
- TABLE 296 Japan Process Orchestration Market by Vertical, 2018 - 2021, USD Million
- TABLE 297 Japan Process Orchestration Market by Vertical, 2022 - 2028, USD Million
- TABLE 298 Japan Process Orchestration Market by Organization size, 2018 - 2021, USD Million
- TABLE 299 Japan Process Orchestration Market by Organization size, 2022 - 2028, USD Million
- TABLE 300 Japan Process Orchestration Market by Deployment Model, 2018 - 2021, USD Million
- TABLE 301 Japan Process Orchestration Market by Deployment Model, 2022 - 2028, USD Million
- TABLE 302 India Process Orchestration Market, 2018 - 2021, USD Million
- TABLE 303 India Process Orchestration Market, 2022 - 2028, USD Million
- TABLE 304 India Process Orchestration Market by Component, 2018 - 2021, USD Million
- TABLE 305 India Process Orchestration Market by Component, 2022 - 2028, USD Million
- TABLE 306 India Process Orchestration Market by Vertical, 2018 - 2021, USD Million
- TABLE 307 India Process Orchestration Market by Vertical, 2022 - 2028, USD Million
- TABLE 308 India Process Orchestration Market by Organization size, 2018 - 2021, USD Million
- TABLE 309 India Process Orchestration Market by Organization size, 2022 - 2028, USD Million
- TABLE 310 India Process Orchestration Market by Deployment Model, 2018 - 2021, USD Million
- TABLE 311 India Process Orchestration Market by Deployment Model, 2022 - 2028, USD Million
- TABLE 312 South Korea Process Orchestration Market, 2018 - 2021, USD Million
- TABLE 313 South Korea Process Orchestration Market, 2022 - 2028, USD Million
- TABLE 314 South Korea Process Orchestration Market by Component, 2018 - 2021, USD Million
- TABLE 315 South Korea Process Orchestration Market by Component, 2022 - 2028, USD Million
- TABLE 316 South Korea Process Orchestration Market by Vertical, 2018 - 2021, USD Million
- TABLE 317 South Korea Process Orchestration Market by Vertical, 2022 - 2028, USD Million
- TABLE 318 South Korea Process Orchestration Market by Organization size, 2018 - 2021, USD Million
- TABLE 319 South Korea Process Orchestration Market by Organization size, 2022 - 2028, USD Million
- TABLE 320 South Korea Process Orchestration Market by Deployment Model, 2018 - 2021, USD Million
- TABLE 321 South Korea Process Orchestration Market by Deployment Model, 2022 - 2028, USD Million
- TABLE 322 Singapore Process Orchestration Market, 2018 - 2021, USD Million
- TABLE 323 Singapore Process Orchestration Market, 2022 - 2028, USD Million
- TABLE 324 Singapore Process Orchestration Market by Component, 2018 - 2021, USD Million
- TABLE 325 Singapore Process Orchestration Market by Component, 2022 - 2028, USD Million
- TABLE 326 Singapore Process Orchestration Market by Vertical, 2018 - 2021, USD Million
- TABLE 327 Singapore Process Orchestration Market by Vertical, 2022 - 2028, USD Million
- TABLE 328 Singapore Process Orchestration Market by Organization size, 2018 - 2021, USD Million
- TABLE 329 Singapore Process Orchestration Market by Organization size, 2022 - 2028, USD Million
- TABLE 330 Singapore Process Orchestration Market by Deployment Model, 2018 - 2021, USD Million
- TABLE 331 Singapore Process Orchestration Market by Deployment Model, 2022 - 2028, USD Million
- TABLE 332 Malaysia Process Orchestration Market, 2018 - 2021, USD Million
- TABLE 333 Malaysia Process Orchestration Market, 2022 - 2028, USD Million
- TABLE 334 Malaysia Process Orchestration Market by Component, 2018 - 2021, USD Million
- TABLE 335 Malaysia Process Orchestration Market by Component, 2022 - 2028, USD Million
- TABLE 336 Malaysia Process Orchestration Market by Vertical, 2018 - 2021, USD Million
- TABLE 337 Malaysia Process Orchestration Market by Vertical, 2022 - 2028, USD Million
- TABLE 338 Malaysia Process Orchestration Market by Organization size, 2018 - 2021, USD Million
- TABLE 339 Malaysia Process Orchestration Market by Organization size, 2022 - 2028, USD Million
- TABLE 340 Malaysia Process Orchestration Market by Deployment Model, 2018 - 2021, USD Million
- TABLE 341 Malaysia Process Orchestration Market by Deployment Model, 2022 - 2028, USD Million
- TABLE 342 Rest of Asia Pacific Process Orchestration Market, 2018 - 2021, USD Million
- TABLE 343 Rest of Asia Pacific Process Orchestration Market, 2022 - 2028, USD Million
- TABLE 344 Rest of Asia Pacific Process Orchestration Market by Component, 2018 - 2021, USD Million
- TABLE 345 Rest of Asia Pacific Process Orchestration Market by Component, 2022 - 2028, USD Million
- TABLE 346 Rest of Asia Pacific Process Orchestration Market by Vertical, 2018 - 2021, USD Million
- TABLE 347 Rest of Asia Pacific Process Orchestration Market by Vertical, 2022 - 2028, USD Million
- TABLE 348 Rest of Asia Pacific Process Orchestration Market by Organization size, 2018 - 2021, USD Million
- TABLE 349 Rest of Asia Pacific Process Orchestration Market by Organization size, 2022 - 2028, USD Million
- TABLE 350 Rest of Asia Pacific Process Orchestration Market by Deployment Model, 2018 - 2021, USD Million
- TABLE 351 Rest of Asia Pacific Process Orchestration Market by Deployment Model, 2022 - 2028, USD Million
- TABLE 352 LAMEA Process Orchestration Market, 2018 - 2021, USD Million
- TABLE 353 LAMEA Process Orchestration Market, 2022 - 2028, USD Million
- TABLE 354 LAMEA Process Orchestration Market by Component, 2018 - 2021, USD Million
- TABLE 355 LAMEA Process Orchestration Market by Component, 2022 - 2028, USD Million
- TABLE 356 LAMEA Software Market by Country, 2018 - 2021, USD Million
- TABLE 357 LAMEA Software Market by Country, 2022 - 2028, USD Million
- TABLE 358 LAMEA Services Market by Country, 2018 - 2021, USD Million
- TABLE 359 LAMEA Services Market by Country, 2022 - 2028, USD Million
- TABLE 360 LAMEA Process Orchestration Market by Vertical, 2018 - 2021, USD Million
- TABLE 361 LAMEA Process Orchestration Market by Vertical, 2022 - 2028, USD Million
- TABLE 362 LAMEA BFSI Market by Country, 2018 - 2021, USD Million
- TABLE 363 LAMEA BFSI Market by Country, 2022 - 2028, USD Million
- TABLE 364 LAMEA IT & Telecom Market by Country, 2018 - 2021, USD Million
- TABLE 365 LAMEA IT & Telecom Market by Country, 2022 - 2028, USD Million
- TABLE 366 LAMEA Manufacturing Market by Country, 2018 - 2021, USD Million
- TABLE 367 LAMEA Manufacturing Market by Country, 2022 - 2028, USD Million
- TABLE 368 LAMEA Retail & Ecommerce Market by Country, 2018 - 2021, USD Million
- TABLE 369 LAMEA Retail & Ecommerce Market by Country, 2022 - 2028, USD Million
- TABLE 370 LAMEA Government & Public Sector Market by Country, 2018 - 2021, USD Million
- TABLE 371 LAMEA Government & Public Sector Market by Country, 2022 - 2028, USD Million
- TABLE 372 LAMEA Healthcare & Life Sciences Market by Country, 2018 - 2021, USD Million
- TABLE 373 LAMEA Healthcare & Life Sciences Market by Country, 2022 - 2028, USD Million
- TABLE 374 LAMEA Transportation & Logistics Market by Country, 2018 - 2021, USD Million
- TABLE 375 LAMEA Transportation & Logistics Market by Country, 2022 - 2028, USD Million
- TABLE 376 LAMEA Energy & Utilities Market by Country, 2018 - 2021, USD Million
- TABLE 377 LAMEA Energy & Utilities Market by Country, 2022 - 2028, USD Million
- TABLE 378 LAMEA Other Vertical Market by Country, 2018 - 2021, USD Million
- TABLE 379 LAMEA Other Vertical Market by Country, 2022 - 2028, USD Million
- TABLE 380 LAMEA Process Orchestration Market by Organization size, 2018 - 2021, USD Million
- TABLE 381 LAMEA Process Orchestration Market by Organization size, 2022 - 2028, USD Million
- TABLE 382 LAMEA Large Enterprises Market by Country, 2018 - 2021, USD Million
- TABLE 383 LAMEA Large Enterprises Market by Country, 2022 - 2028, USD Million
- TABLE 384 LAMEA SMEs Market by Country, 2018 - 2021, USD Million
- TABLE 385 LAMEA SMEs Market by Country, 2022 - 2028, USD Million
- TABLE 386 LAMEA Process Orchestration Market by Deployment Model, 2018 - 2021, USD Million
- TABLE 387 LAMEA Process Orchestration Market by Deployment Model, 2022 - 2028, USD Million
- TABLE 388 LAMEA On-premise Market by Country, 2018 - 2021, USD Million
- TABLE 389 LAMEA On-premise Market by Country, 2022 - 2028, USD Million
- TABLE 390 LAMEA Cloud Market by Country, 2018 - 2021, USD Million
- TABLE 391 LAMEA Cloud Market by Country, 2022 - 2028, USD Million
- TABLE 392 LAMEA Process Orchestration Market by Country, 2018 - 2021, USD Million
- TABLE 393 LAMEA Process Orchestration Market by Country, 2022 - 2028, USD Million
- TABLE 394 Brazil Process Orchestration Market, 2018 - 2021, USD Million
- TABLE 395 Brazil Process Orchestration Market, 2022 - 2028, USD Million
- TABLE 396 Brazil Process Orchestration Market by Component, 2018 - 2021, USD Million
- TABLE 397 Brazil Process Orchestration Market by Component, 2022 - 2028, USD Million
- TABLE 398 Brazil Process Orchestration Market by Vertical, 2018 - 2021, USD Million
- TABLE 399 Brazil Process Orchestration Market by Vertical, 2022 - 2028, USD Million
- TABLE 400 Brazil Process Orchestration Market by Organization size, 2018 - 2021, USD Million
- TABLE 401 Brazil Process Orchestration Market by Organization size, 2022 - 2028, USD Million
- TABLE 402 Brazil Process Orchestration Market by Deployment Model, 2018 - 2021, USD Million
- TABLE 403 Brazil Process Orchestration Market by Deployment Model, 2022 - 2028, USD Million
- TABLE 404 Argentina Process Orchestration Market, 2018 - 2021, USD Million
- TABLE 405 Argentina Process Orchestration Market, 2022 - 2028, USD Million
- TABLE 406 Argentina Process Orchestration Market by Component, 2018 - 2021, USD Million
- TABLE 407 Argentina Process Orchestration Market by Component, 2022 - 2028, USD Million
- TABLE 408 Argentina Process Orchestration Market by Vertical, 2018 - 2021, USD Million
- TABLE 409 Argentina Process Orchestration Market by Vertical, 2022 - 2028, USD Million
- TABLE 410 Argentina Process Orchestration Market by Organization size, 2018 - 2021, USD Million
- TABLE 411 Argentina Process Orchestration Market by Organization size, 2022 - 2028, USD Million
- TABLE 412 Argentina Process Orchestration Market by Deployment Model, 2018 - 2021, USD Million
- TABLE 413 Argentina Process Orchestration Market by Deployment Model, 2022 - 2028, USD Million
- TABLE 414 UAE Process Orchestration Market, 2018 - 2021, USD Million
- TABLE 415 UAE Process Orchestration Market, 2022 - 2028, USD Million
- TABLE 416 UAE Process Orchestration Market by Component, 2018 - 2021, USD Million
- TABLE 417 UAE Process Orchestration Market by Component, 2022 - 2028, USD Million
- TABLE 418 UAE Process Orchestration Market by Vertical, 2018 - 2021, USD Million
- TABLE 419 UAE Process Orchestration Market by Vertical, 2022 - 2028, USD Million
- TABLE 420 UAE Process Orchestration Market by Organization size, 2018 - 2021, USD Million
- TABLE 421 UAE Process Orchestration Market by Organization size, 2022 - 2028, USD Million
- TABLE 422 UAE Process Orchestration Market by Deployment Model, 2018 - 2021, USD Million
- TABLE 423 UAE Process Orchestration Market by Deployment Model, 2022 - 2028, USD Million
- TABLE 424 Saudi Arabia Process Orchestration Market, 2018 - 2021, USD Million
- TABLE 425 Saudi Arabia Process Orchestration Market, 2022 - 2028, USD Million
- TABLE 426 Saudi Arabia Process Orchestration Market by Component, 2018 - 2021, USD Million
- TABLE 427 Saudi Arabia Process Orchestration Market by Component, 2022 - 2028, USD Million
- TABLE 428 Saudi Arabia Process Orchestration Market by Vertical, 2018 - 2021, USD Million
- TABLE 429 Saudi Arabia Process Orchestration Market by Vertical, 2022 - 2028, USD Million
- TABLE 430 Saudi Arabia Process Orchestration Market by Organization size, 2018 - 2021, USD Million
- TABLE 431 Saudi Arabia Process Orchestration Market by Organization size, 2022 - 2028, USD Million
- TABLE 432 Saudi Arabia Process Orchestration Market by Deployment Model, 2018 - 2021, USD Million
- TABLE 433 Saudi Arabia Process Orchestration Market by Deployment Model, 2022 - 2028, USD Million
- TABLE 434 South Africa Process Orchestration Market, 2018 - 2021, USD Million
- TABLE 435 South Africa Process Orchestration Market, 2022 - 2028, USD Million
- TABLE 436 South Africa Process Orchestration Market by Component, 2018 - 2021, USD Million
- TABLE 437 South Africa Process Orchestration Market by Component, 2022 - 2028, USD Million
- TABLE 438 South Africa Process Orchestration Market by Vertical, 2018 - 2021, USD Million
- TABLE 439 South Africa Process Orchestration Market by Vertical, 2022 - 2028, USD Million
- TABLE 440 South Africa Process Orchestration Market by Organization size, 2018 - 2021, USD Million
- TABLE 441 South Africa Process Orchestration Market by Organization size, 2022 - 2028, USD Million
- TABLE 442 South Africa Process Orchestration Market by Deployment Model, 2018 - 2021, USD Million
- TABLE 443 South Africa Process Orchestration Market by Deployment Model, 2022 - 2028, USD Million
- TABLE 444 Nigeria Process Orchestration Market, 2018 - 2021, USD Million
- TABLE 445 Nigeria Process Orchestration Market, 2022 - 2028, USD Million
- TABLE 446 Nigeria Process Orchestration Market by Component, 2018 - 2021, USD Million
- TABLE 447 Nigeria Process Orchestration Market by Component, 2022 - 2028, USD Million
- TABLE 448 Nigeria Process Orchestration Market by Vertical, 2018 - 2021, USD Million
- TABLE 449 Nigeria Process Orchestration Market by Vertical, 2022 - 2028, USD Million
- TABLE 450 Nigeria Process Orchestration Market by Organization size, 2018 - 2021, USD Million
- TABLE 451 Nigeria Process Orchestration Market by Organization size, 2022 - 2028, USD Million
- TABLE 452 Nigeria Process Orchestration Market by Deployment Model, 2018 - 2021, USD Million
- TABLE 453 Nigeria Process Orchestration Market by Deployment Model, 2022 - 2028, USD Million
- TABLE 454 Rest of LAMEA Process Orchestration Market, 2018 - 2021, USD Million
- TABLE 455 Rest of LAMEA Process Orchestration Market, 2022 - 2028, USD Million
- TABLE 456 Rest of LAMEA Process Orchestration Market by Component, 2018 - 2021, USD Million
- TABLE 457 Rest of LAMEA Process Orchestration Market by Component, 2022 - 2028, USD Million
- TABLE 458 Rest of LAMEA Process Orchestration Market by Vertical, 2018 - 2021, USD Million
- TABLE 459 Rest of LAMEA Process Orchestration Market by Vertical, 2022 - 2028, USD Million
- TABLE 460 Rest of LAMEA Process Orchestration Market by Organization size, 2018 - 2021, USD Million
- TABLE 461 Rest of LAMEA Process Orchestration Market by Organization size, 2022 - 2028, USD Million
- TABLE 462 Rest of LAMEA Process Orchestration Market by Deployment Model, 2018 - 2021, USD Million
- TABLE 463 Rest of LAMEA Process Orchestration Market by Deployment Model, 2022 - 2028, USD Million
- TABLE 464 Key information - IBM Corporation
- TABLE 465 Key Information - Oracle Corporation
- TABLE 466 Key Information - SAP SE
- TABLE 467 Key Information - Broadcom, Inc.
- TABLE 468 Key Information - Fujitsu Limited
- TABLE 469 Key Information - Cisco Systems, Inc.
- TABLE 470 Key Information - Wipro Limited
- TABLE 471 Key Information - HCL Technologies Ltd.
- TABLE 472 key information - Software AG
- TABLE 473 Key information - Tibco Software, Inc.
List of Figures
- FIG 1 Methodology for the research
- FIG 2 KBV Cardinal Matrix
- FIG 3 Market Share Analysis, 2021
- FIG 4 Key Leading Strategies: Percentage Distribution (2018-2022)
- FIG 5 Global Process Orchestration Market Share by Component, 2021
- FIG 6 Global Process Orchestration Market Share by Component, 2028
- FIG 7 Global Process Orchestration Market by Component, 2018 - 2028, USD Million
- FIG 8 Global Process Orchestration Market Share by Vertical, 2021
- FIG 9 Global Process Orchestration Market Share by Vertical, 2028
- FIG 10 Global Process Orchestration Market by Vertical, 2018 - 2028, USD Million
- FIG 11 Global Process Orchestration Market Share by Organization size, 2021
- FIG 12 Global Process Orchestration Market Share by Organization size, 2028
- FIG 13 Global Process Orchestration Market by Organization size, 2018 - 2028, USD Million
- FIG 14 Global Process Orchestration Market Share by Deployment Model, 2021
- FIG 15 Global Process Orchestration Market Share by Deployment Model, 2028
- FIG 16 Global Process Orchestration Market by Deployment Model, 2018 - 2028, USD Million
- FIG 17 Global Process Orchestration Market Share by Region, 2021
- FIG 18 Global Process Orchestration Market Share by Region, 2028
- FIG 19 Global Process Orchestration Market by Region, 2018 - 2028, USD Million
- FIG 20 Recent strategies and developments: IBM Corporation
- FIG 21 Swot analysis: IBM Corporation
- FIG 22 SWOT analysis: Oracle Corporation
- FIG 23 SWOT Analysis: SAP SE
- FIG 24 Recent strategies and developments: Broadcom, Inc.
- FIG 25 Recent strategies and developments: Fujitsu Limited
- FIG 26 SWOT Analysis: Fujitsu Limited
- FIG 27 Recent strategies and developments: Cisco Systems, Inc.
- FIG 28 SWOT Analysis: Cisco Systems, Inc.
- FIG 29 Recent strategies and developments: HCL Technologies Ltd.
The Global Process Orchestration Market size is expected to reach $12.6 billion by 2028, rising at a market growth of 17.2% CAGR during the forecast period.
Process orchestration is a framework used for creating unique workflow operations that enable the orchestration of various business activities across people, processes, and technology. It offers a platform that enables business and IT specialists to collaborate, track business process applications, and securely communicate data. This platform supports business operations in an efficient manner. Additionally, it is well known to improve corporate operations' efficiency. The choice of such platforms has decreased production costs, improved the value chain, and improved an organization's overall operations.
Using web-based services to manage business processes is known as business process orchestration. This procedure helps to shape the direction of business process management and has the potential to alter how companies and information technology interact. Business process orchestration is often referred as workflow orchestration or service instrumentation. It gives comprehensive information on the limitations as well as the occurrence process and a structure for the company's internal control flow.
Some of the factors driving the growth of the process orchestration market include the rise in the adoption of business process automation technologies by companies to enhance the efficiency and quality of operational processes and interactions with other companies & customers as they engage in e-business transactions. The market is expanding due to the increased deployment of adequate business solutions by enterprises to save operational costs and effectively use their IT resources.
IT can automate specific activities with traditional automation technologies. Native task schedulers, custom scripting, RPA tools, and business process management tools are typical examples. Automated processes can be planned, carried out on-demand, or started by a relevant business or IT events. Although many process orchestration tools are actually automation tools, they offer the same functionality with a few key distinctions.
COVID-19 Impact Analysis
Lockdown protocols were put in place in numerous nations as a result of the Covid-19 outbreak. This in turn encouraged companies and organizations to adopt a culture of remote, or work from home, employment. This increased the use of process orchestration tools to increase company agility. Every corporation and business have been forced by the pandemic to move their business operations toward a virtual and remote work environment. Due to the critical circumstances, businesses started implementing process orchestration solutions for increased productivity and business agility. Every corporation and business were compelled by the pandemic to move their business operations toward a remote work environment.
Market Growth Factors
The Rapid Spread Of Digital Transformation
In the modern era, there is a rapid spread of digitalization all over the world. Businesses are increasingly transforming their manual processes into advanced and automated processes. In order to comply with the widespread digitalization, various companies are rapidly undergoing digital transformation. Businesses are significantly investing in digital transformation as an effort to meet the rapidly evolving and increasing customer requirements because developing technologies are continually changing those expectations. Adopting automation technology to better corporate operations and decision-making is the core of digital transformation.
Optimizes The Utilization Of Resources
Businesses are focusing on making the best use of their available resources, including storage, processing power, and technical resources. Process orchestration offers managed and professional services, as well as cloud orchestration services, allowing businesses to work on diverse processes, such as other real-time projects, simultaneously. Process orchestration thereby provides optimal use of resources of a company. Additionally, pay-per-use flexibility and streamlined optimization make organizations more productive. Additionally, knowing what resources are available and completing them when necessary for the project is essential for controlling expenses and ensuring the success of project operations. It has substantial advantages for all businesses and organizations.
Market Restraining Factors
Can Degrade Performance And Quality In Certain Cases
When complex logic is implemented via orchestration tools, the procedure sometimes results in poor and reduced performance of the datastore. These tools frequently add a large number of objects to the data store, and displays frequently involve a large number of function calls. For example, to mask data, lookup or entitlement tables, expressions, and other things. Therefore, these procedures might also eliminate some datastore optimizations in addition to requiring more processing. When more objects, such as roles, views, and entitlement tables, are added, complications are frequently created in addition to potential performance effects.
Vertical Outlook
By industrial vertical, the process orchestration market is segmented into Government and Defense, Energy and utilities, Transportation and Logistics, BFSI, Manufacturing, Healthcare and Pharmaceuticals, IT and Telecommunications, Retail and consumer goods, and Others. In 2021, the healthcare and pharmaceuticals segment garnered a significant revenue share of the process orchestration market. Personalized healthcare is currently being promoted by self-care, which is being supported by the digitization of services, more affordable and effective care models, and the healthcare sector as a whole. The demand for process orchestration to be adopted for cost-effectiveness and better efficiency of healthcare systems has been brought on by rising expenses and the promise of connected health technologies.
Component Outlook
Based on component, the process orchestration market is classified into Software and Services. In 2021, the software segment procured the highest revenue share of the process orchestration market. Standard procedures for business processes in complicated contexts can be standardized, consolidated, and automated with the use of process orchestration software. This is bolstering the demand for process orchestration software all over the world. Owing to this, the growth of this segment is rapidly rising.
Deployment Model Outlook
On the basis of deployment model, the process orchestration market is categorized into On-Premises and Cloud. In 2021, the cloud segment registered a significant revenue share of the process orchestration market. The rapid growth of the segment is a result of the increasing number of cloud providers operating in the field. It also eliminates the requirement for owning a separate system to leverage these solutions. Moreover, mid-sized financial institutions favor cloud-based Process Orchestration software because it requires little initial investment and less ongoing maintenance.
Enterprise Size Outlook
By enterprise size, the process orchestration market is fragmented into Large Enterprises and Small and Medium Enterprises. In 2021, the large enterprises segment acquired the largest revenue share of the process orchestration market. One of the major factors driving the expansion of this segment is that large enterprises are expanding their IT budgets to adopt cutting-edge technologies and solutions. The products aid in fostering better teamwork within huge organizations and boost worker productivity by enhancing the speed, effectiveness, and efficiency of business operations.
Regional Outlook
Region-wise, the process orchestration market is analyzed across North America, Europe, Asia Pacific and LAMEA. In 2021, North America held the largest revenue share of the process orchestration market. Several factors, including the rise in digitization and the use of process orchestration tools by several end-users across the region, including BFSI and retail, are responsible for the market's expansion in this region. Furthermore, the existence of major players offers a significant number of growth prospects for market expansion.
The major strategies followed by the market participants are Acquisitions, Partnerships and Product Launches. Based on the Analysis presented in the Cardinal matrix; Oracle Corporation, IBM Corporation, Broadcom, Inc., Cisco Systems, Inc., SAP SE, are the forerunners in the Process Orchestration Market. Companies such as HCL Technologies Ltd., Wipro Limited and Fujitsu Limited are some of the key innovators in Process Orchestration Market.
The market research report covers the analysis of key stake holders of the market. Key companies profiled in the report include SAP SE, International Business Machines Corporation, Oracle Corporation, Broadcom, Inc., Cisco Systems Inc, Fujitsu Limited, TIBCO Software Inc., Software AG, HCL Technologies Ltd., and Wipro Limited.
Recent Strategies Deployed in Process Orchestration Market
Partnerships, Collaborations and Agreements:
Jun-2022: Fujitsu entered into a partnership with Hexagon, a publicly listed global information technology company. Under this partnership, the companies would deliver combined applications of digital twin technologies along with solutions from both companies, such as data processing, AI analysis, IoT sensors, and advanced data visualization, in the cloud as well as computing infrastructure.
Feb-2022: Cisco joined hands with Rakuten Symphony, a subsidiary of Rakuten Mobile. Following this collaboration, the companies would help vice providers in innovating futuristic advancements in the internet. Moreover, this collaboration would also expedite access to ORAN-based cloud-native, virtualized 4G/5G mobile networks.
Dec-2021: HCL Technologies came into a partnership with KloudGin, a leading software provider. This partnership aimed to deliver cutting-edge cross-silo solutions to key water/wastewater, manufacturing, telecoms, commercial services, oil & gas, and utility operations. Moreover, this partnership would also help companies efficiently and quickly transform operations via digital tools, data optimization, and mobile FSM and EAM solutions delivery.
Nov-2021: Wipro partnered with DriveNets, a leading cloud-native networking software company. Through this partnership, the companies aimed to transform CSP's approach to building next-generation networks.
Apr-2021: Broadcom teamed up with Google, an American multinational technology company. Under this collaboration, the companies would expedite innovation while also strengthening cloud services integration across Broadcom's core software franchises. Furthermore, Broadcom would also deliver its security and enterprise operations software range on the Google Cloud.
Mar-2020: Cisco came into a partnership with Microsoft, an American multinational technology company. This partnership aimed to allow flawless data orchestration through the integration of Cisco IoT Edge and Azure IoT Cloud. This partnership also aimed to address the transfer of data from the IoT edge and offer opportunities to customers in order to unlock business value from their data.
Product Launches and Product Expansions:
Apr-2022: Fujitsu released Fujitsu Computing as a Service, a new service portfolio. This launch aimed to drive digital transformation and customer empowerment all over the world by providing the access to most advanced computing technologies across the world through the cloud for commercial utilization.
Nov-2021: IBM Watson rolled out IBM Imaging Workflow Orchestrator, a new AI orchestration offering. With this launch, the company aimed to aid imaging organizations in leveraging the benefits of employing seamless AI applications. In addition, the new solution aimed to modernize the reading experience of radiologists while also lowering the demands of the imaging system and IT administrators.
May-2021: IBM unveiled Watson Orchestrate, an AI-powered automation tool. The new solution aimed to accelerate the personal productivity of businesses and business professionals across operations, human resources, sales, and more. Also, it would enable companies to communicate through natural language in order to perform tasks.
Mar-2021: HCL Technologies rolled out ASM 2.0, a next-generation application management framework. The new product aimed to aid businesses in driving agility, resilience, and stakeholder experiences with optimized costs.
Acquisitions and Mergers:
Jan-2022: Oracle completed its acquisition of Federos, a privately held company. Through this acquisition, the company aimed to extend its application portfolio with the integration of AI-optimized analytics, automation, and assurance solutions to manage the performance and availability of critical systems and networks. In addition, the acquisition would also expand the ability of Oracle to deliver end-to-end service and network assurance.
Oct-2021: Cisco completed its acquisition of Epsagon, a modern observability vendor. Through this acquisition, the company aimed to complement its performance on full-stack observability for cloud-native environments to accelerate Cisco's capability roadmaps.
Apr-2021: IBM took over myInvenio, a process mining software company. This acquisition aimed to offer data-driven software to businesses to allow them to identify the most crucial business processes with the aim to automate procurement, accounting, production, and sales with the help of AI.
Jan-2021: SAP SE acquired Signavio, a Business Process Management software vendor. Through this acquisition, the company aimed to expand its capacity to aid businesses in rapidly comprehending, enhancing, transforming, and managing their business processes at scale.
Scope of the Study
Market Segments covered in the Report:
By Component
- Software
- Services
By Vertical
- BFSI
- IT & Telecom
- Manufacturing
- Retail & Ecommerce
- Government & Public Sector
- Healthcare & Life Sciences
- Transportation & Logistics
- Energy & Utilities
- Others
By Organization size
- Large Enterprises
- SMEs
By Deployment Model
- On-premise
- Cloud
By Geography
- North America
- US
- Canada
- Mexico
- Rest of North America
- Europe
- Germany
- UK
- France
- Russia
- Spain
- Italy
- Rest of Europe
- Asia Pacific
- China
- Japan
- India
- South Korea
- Singapore
- Malaysia
- Rest of Asia Pacific
- LAMEA
- Brazil
- Argentina
- UAE
- Saudi Arabia
- South Africa
- Nigeria
- Rest of LAMEA
Companies Profiled
- SAP SE
- International Business Machines Corporation
- Oracle Corporation
- Broadcom, Inc.
- Cisco Systems Inc
- Fujitsu Limited
- TIBCO Software Inc.
- Software AG
- HCL Technologies Ltd.
- Wipro Limited
Unique Offerings from KBV Research
- Exhaustive coverage
- Highest number of market tables and figures
- Subscription based model available
- Guaranteed best price
- Assured post sales research support with 10% customization free
Table of Contents
Chapter 1. Market Scope & Methodology
- 1.1 Market Definition
- 1.2 Objectives
- 1.3 Market Scope
- 1.4 Segmentation
- 1.4.1 Global Process Orchestration Market, by Component
- 1.4.2 Global Process Orchestration Market, by Vertical
- 1.4.3 Global Process Orchestration Market, by Organization size
- 1.4.4 Global Process Orchestration Market, by Deployment Model
- 1.4.5 Global Process Orchestration Market, by Geography
- 1.5 Methodology for the research
Chapter 2. Market Overview
- 2.1 Introduction
- 2.1.1 Overview
- 2.1.1.1 Market Composition and Scenario
- 2.1.1 Overview
- 2.2 Key Factors Impacting the Market
- 2.2.1 Market Drivers
- 2.2.2 Market Restraints
Chapter 3. Competition Analysis - Global
- 3.1 KBV Cardinal Matrix
- 3.2 Recent Industry Wide Strategic Developments
- 3.2.1 Partnerships, Collaborations and Agreements
- 3.2.2 Product Launches and Product Expansions
- 3.2.3 Acquisition and Mergers
- 3.3 Market Share Analysis, 2021
- 3.4 Top Winning Strategies
- 3.4.1 Key Leading Strategies: Percentage Distribution (2018-2022)
Chapter 4. Global Process Orchestration Market by Component
- 4.1 Global Software Market by Region
- 4.2 Global Services Market by Region
Chapter 5. Global Process Orchestration Market by Vertical
- 5.1 Global BFSI Market by Region
- 5.2 Global IT & Telecom Market by Region
- 5.3 Global Manufacturing Market by Region
- 5.4 Global Retail & Ecommerce Market by Region
- 5.5 Global Government & Public Sector Market by Region
- 5.6 Global Healthcare & Life Sciences Market by Region
- 5.7 Global Transportation & Logistics Market by Region
- 5.8 Global Energy & Utilities Market by Region
- 5.9 Global Other Vertical Market by Region
Chapter 6. Global Process Orchestration Market by Organization size
- 6.1 Global Large Enterprises Market by Region
- 6.2 Global SMEs Market by Region
Chapter 7. Global Process Orchestration Market by Deployment Model
- 7.1 Global On-premise Market by Region
- 7.2 Global Cloud Market by Region
Chapter 8. Global Process Orchestration Market by Region
- 8.1 North America Process Orchestration Market
- 8.1.1 North America Process Orchestration Market by Component
- 8.1.1.1 North America Software Market by Country
- 8.1.1.2 North America Services Market by Country
- 8.1.2 North America Process Orchestration Market by Vertical
- 8.1.2.1 North America BFSI Market by Country
- 8.1.2.2 North America IT & Telecom Market by Country
- 8.1.2.3 North America Manufacturing Market by Country
- 8.1.2.4 North America Retail & Ecommerce Market by Country
- 8.1.2.5 North America Government & Public Sector Market by Country
- 8.1.2.6 North America Healthcare & Life Sciences Market by Country
- 8.1.2.7 North America Transportation & Logistics Market by Country
- 8.1.2.8 North America Energy & Utilities Market by Country
- 8.1.2.9 North America Other Vertical Market by Country
- 8.1.3 North America Process Orchestration Market by Organization size
- 8.1.3.1 North America Large Enterprises Market by Country
- 8.1.3.2 North America SMEs Market by Country
- 8.1.4 North America Process Orchestration Market by Deployment Model
- 8.1.4.1 North America On-premise Market by Country
- 8.1.4.2 North America Cloud Market by Country
- 8.1.5 North America Process Orchestration Market by Country
- 8.1.5.1 US Process Orchestration Market
- 8.1.5.1.1 US Process Orchestration Market by Component
- 8.1.5.1.2 US Process Orchestration Market by Vertical
- 8.1.5.1.3 US Process Orchestration Market by Organization size
- 8.1.5.1.4 US Process Orchestration Market by Deployment Model
- 8.1.5.2 Canada Process Orchestration Market
- 8.1.5.2.1 Canada Process Orchestration Market by Component
- 8.1.5.2.2 Canada Process Orchestration Market by Vertical
- 8.1.5.2.3 Canada Process Orchestration Market by Organization size
- 8.1.5.2.4 Canada Process Orchestration Market by Deployment Model
- 8.1.5.3 Mexico Process Orchestration Market
- 8.1.5.3.1 Mexico Process Orchestration Market by Component
- 8.1.5.3.2 Mexico Process Orchestration Market by Vertical
- 8.1.5.3.3 Mexico Process Orchestration Market by Organization size
- 8.1.5.3.4 Mexico Process Orchestration Market by Deployment Model
- 8.1.5.4 Rest of North America Process Orchestration Market
- 8.1.5.4.1 Rest of North America Process Orchestration Market by Component
- 8.1.5.4.2 Rest of North America Process Orchestration Market by Vertical
- 8.1.5.4.3 Rest of North America Process Orchestration Market by Organization size
- 8.1.5.4.4 Rest of North America Process Orchestration Market by Deployment Model
- 8.1.5.1 US Process Orchestration Market
- 8.1.1 North America Process Orchestration Market by Component
- 8.2 Europe Process Orchestration Market
- 8.2.1 Europe Process Orchestration Market by Component
- 8.2.1.1 Europe Software Market by Country
- 8.2.1.2 Europe Services Market by Country
- 8.2.2 Europe Process Orchestration Market by Vertical
- 8.2.2.1 Europe BFSI Market by Country
- 8.2.2.2 Europe IT & Telecom Market by Country
- 8.2.2.3 Europe Manufacturing Market by Country
- 8.2.2.4 Europe Retail & Ecommerce Market by Country
- 8.2.2.5 Europe Government & Public Sector Market by Country
- 8.2.2.6 Europe Healthcare & Life Sciences Market by Country
- 8.2.2.7 Europe Transportation & Logistics Market by Country
- 8.2.2.8 Europe Energy & Utilities Market by Country
- 8.2.2.9 Europe Other Vertical Market by Country
- 8.2.3 Europe Process Orchestration Market by Organization size
- 8.2.3.1 Europe Large Enterprises Market by Country
- 8.2.3.2 Europe SMEs Market by Country
- 8.2.4 Europe Process Orchestration Market by Deployment Model
- 8.2.4.1 Europe On-premise Market by Country
- 8.2.4.2 Europe Cloud Market by Country
- 8.2.5 Europe Process Orchestration Market by Country
- 8.2.5.1 Germany Process Orchestration Market
- 8.2.5.1.1 Germany Process Orchestration Market by Component
- 8.2.5.1.2 Germany Process Orchestration Market by Vertical
- 8.2.5.1.3 Germany Process Orchestration Market by Organization size
- 8.2.5.1.4 Germany Process Orchestration Market by Deployment Model
- 8.2.5.2 UK Process Orchestration Market
- 8.2.5.2.1 UK Process Orchestration Market by Component
- 8.2.5.2.2 UK Process Orchestration Market by Vertical
- 8.2.5.2.3 UK Process Orchestration Market by Organization size
- 8.2.5.2.4 UK Process Orchestration Market by Deployment Model
- 8.2.5.3 France Process Orchestration Market
- 8.2.5.3.1 France Process Orchestration Market by Component
- 8.2.5.3.2 France Process Orchestration Market by Vertical
- 8.2.5.3.3 France Process Orchestration Market by Organization size
- 8.2.5.3.4 France Process Orchestration Market by Deployment Model
- 8.2.5.4 Russia Process Orchestration Market
- 8.2.5.4.1 Russia Process Orchestration Market by Component
- 8.2.5.4.2 Russia Process Orchestration Market by Vertical
- 8.2.5.4.3 Russia Process Orchestration Market by Organization size
- 8.2.5.4.4 Russia Process Orchestration Market by Deployment Model
- 8.2.5.5 Spain Process Orchestration Market
- 8.2.5.5.1 Spain Process Orchestration Market by Component
- 8.2.5.5.2 Spain Process Orchestration Market by Vertical
- 8.2.5.5.3 Spain Process Orchestration Market by Organization size
- 8.2.5.5.4 Spain Process Orchestration Market by Deployment Model
- 8.2.5.6 Italy Process Orchestration Market
- 8.2.5.6.1 Italy Process Orchestration Market by Component
- 8.2.5.6.2 Italy Process Orchestration Market by Vertical
- 8.2.5.6.3 Italy Process Orchestration Market by Organization size
- 8.2.5.6.4 Italy Process Orchestration Market by Deployment Model
- 8.2.5.7 Rest of Europe Process Orchestration Market
- 8.2.5.7.1 Rest of Europe Process Orchestration Market by Component
- 8.2.5.7.2 Rest of Europe Process Orchestration Market by Vertical
- 8.2.5.7.3 Rest of Europe Process Orchestration Market by Organization size
- 8.2.5.7.4 Rest of Europe Process Orchestration Market by Deployment Model
- 8.2.5.1 Germany Process Orchestration Market
- 8.2.1 Europe Process Orchestration Market by Component
- 8.3 Asia Pacific Process Orchestration Market
- 8.3.1 Asia Pacific Process Orchestration Market by Component
- 8.3.1.1 Asia Pacific Software Market by Country
- 8.3.1.2 Asia Pacific Services Market by Country
- 8.3.2 Asia Pacific Process Orchestration Market by Vertical
- 8.3.2.1 Asia Pacific BFSI Market by Country
- 8.3.2.2 Asia Pacific IT & Telecom Market by Country
- 8.3.2.3 Asia Pacific Manufacturing Market by Country
- 8.3.2.4 Asia Pacific Retail & Ecommerce Market by Country
- 8.3.2.5 Asia Pacific Government & Public Sector Market by Country
- 8.3.2.6 Asia Pacific Healthcare & Life Sciences Market by Country
- 8.3.2.7 Asia Pacific Transportation & Logistics Market by Country
- 8.3.2.8 Asia Pacific Energy & Utilities Market by Country
- 8.3.2.9 Asia Pacific Other Vertical Market by Country
- 8.3.3 Asia Pacific Process Orchestration Market by Organization size
- 8.3.3.1 Asia Pacific Large Enterprises Market by Country
- 8.3.3.2 Asia Pacific SMEs Market by Country
- 8.3.4 Asia Pacific Process Orchestration Market by Deployment Model
- 8.3.4.1 Asia Pacific On-premise Market by Country
- 8.3.4.2 Asia Pacific Cloud Market by Country
- 8.3.5 Asia Pacific Process Orchestration Market by Country
- 8.3.5.1 China Process Orchestration Market
- 8.3.5.1.1 China Process Orchestration Market by Component
- 8.3.5.1.2 China Process Orchestration Market by Vertical
- 8.3.5.1.3 China Process Orchestration Market by Organization size
- 8.3.5.1.4 China Process Orchestration Market by Deployment Model
- 8.3.5.2 Japan Process Orchestration Market
- 8.3.5.2.1 Japan Process Orchestration Market by Component
- 8.3.5.2.2 Japan Process Orchestration Market by Vertical
- 8.3.5.2.3 Japan Process Orchestration Market by Organization size
- 8.3.5.2.4 Japan Process Orchestration Market by Deployment Model
- 8.3.5.3 India Process Orchestration Market
- 8.3.5.3.1 India Process Orchestration Market by Component
- 8.3.5.3.2 India Process Orchestration Market by Vertical
- 8.3.5.3.3 India Process Orchestration Market by Organization size
- 8.3.5.3.4 India Process Orchestration Market by Deployment Model
- 8.3.5.4 South Korea Process Orchestration Market
- 8.3.5.4.1 South Korea Process Orchestration Market by Component
- 8.3.5.4.2 South Korea Process Orchestration Market by Vertical
- 8.3.5.4.3 South Korea Process Orchestration Market by Organization size
- 8.3.5.4.4 South Korea Process Orchestration Market by Deployment Model
- 8.3.5.5 Singapore Process Orchestration Market
- 8.3.5.5.1 Singapore Process Orchestration Market by Component
- 8.3.5.5.2 Singapore Process Orchestration Market by Vertical
- 8.3.5.5.3 Singapore Process Orchestration Market by Organization size
- 8.3.5.5.4 Singapore Process Orchestration Market by Deployment Model
- 8.3.5.6 Malaysia Process Orchestration Market
- 8.3.5.6.1 Malaysia Process Orchestration Market by Component
- 8.3.5.6.2 Malaysia Process Orchestration Market by Vertical
- 8.3.5.6.3 Malaysia Process Orchestration Market by Organization size
- 8.3.5.6.4 Malaysia Process Orchestration Market by Deployment Model
- 8.3.5.7 Rest of Asia Pacific Process Orchestration Market
- 8.3.5.7.1 Rest of Asia Pacific Process Orchestration Market by Component
- 8.3.5.7.2 Rest of Asia Pacific Process Orchestration Market by Vertical
- 8.3.5.7.3 Rest of Asia Pacific Process Orchestration Market by Organization size
- 8.3.5.7.4 Rest of Asia Pacific Process Orchestration Market by Deployment Model
- 8.3.5.1 China Process Orchestration Market
- 8.3.1 Asia Pacific Process Orchestration Market by Component
- 8.4 LAMEA Process Orchestration Market
- 8.4.1 LAMEA Process Orchestration Market by Component
- 8.4.1.1 LAMEA Software Market by Country
- 8.4.1.2 LAMEA Services Market by Country
- 8.4.2 LAMEA Process Orchestration Market by Vertical
- 8.4.2.1 LAMEA BFSI Market by Country
- 8.4.2.2 LAMEA IT & Telecom Market by Country
- 8.4.2.3 LAMEA Manufacturing Market by Country
- 8.4.2.4 LAMEA Retail & Ecommerce Market by Country
- 8.4.2.5 LAMEA Government & Public Sector Market by Country
- 8.4.2.6 LAMEA Healthcare & Life Sciences Market by Country
- 8.4.2.7 LAMEA Transportation & Logistics Market by Country
- 8.4.2.8 LAMEA Energy & Utilities Market by Country
- 8.4.2.9 LAMEA Other Vertical Market by Country
- 8.4.3 LAMEA Process Orchestration Market by Organization size
- 8.4.3.1 LAMEA Large Enterprises Market by Country
- 8.4.3.2 LAMEA SMEs Market by Country
- 8.4.4 LAMEA Process Orchestration Market by Deployment Model
- 8.4.4.1 LAMEA On-premise Market by Country
- 8.4.4.2 LAMEA Cloud Market by Country
- 8.4.5 LAMEA Process Orchestration Market by Country
- 8.4.5.1 Brazil Process Orchestration Market
- 8.4.5.1.1 Brazil Process Orchestration Market by Component
- 8.4.5.1.2 Brazil Process Orchestration Market by Vertical
- 8.4.5.1.3 Brazil Process Orchestration Market by Organization size
- 8.4.5.1.4 Brazil Process Orchestration Market by Deployment Model
- 8.4.5.2 Argentina Process Orchestration Market
- 8.4.5.2.1 Argentina Process Orchestration Market by Component
- 8.4.5.2.2 Argentina Process Orchestration Market by Vertical
- 8.4.5.2.3 Argentina Process Orchestration Market by Organization size
- 8.4.5.2.4 Argentina Process Orchestration Market by Deployment Model
- 8.4.5.3 UAE Process Orchestration Market
- 8.4.5.3.1 UAE Process Orchestration Market by Component
- 8.4.5.3.2 UAE Process Orchestration Market by Vertical
- 8.4.5.3.3 UAE Process Orchestration Market by Organization size
- 8.4.5.3.4 UAE Process Orchestration Market by Deployment Model
- 8.4.5.4 Saudi Arabia Process Orchestration Market
- 8.4.5.4.1 Saudi Arabia Process Orchestration Market by Component
- 8.4.5.4.2 Saudi Arabia Process Orchestration Market by Vertical
- 8.4.5.4.3 Saudi Arabia Process Orchestration Market by Organization size
- 8.4.5.4.4 Saudi Arabia Process Orchestration Market by Deployment Model
- 8.4.5.5 South Africa Process Orchestration Market
- 8.4.5.5.1 South Africa Process Orchestration Market by Component
- 8.4.5.5.2 South Africa Process Orchestration Market by Vertical
- 8.4.5.5.3 South Africa Process Orchestration Market by Organization size
- 8.4.5.5.4 South Africa Process Orchestration Market by Deployment Model
- 8.4.5.6 Nigeria Process Orchestration Market
- 8.4.5.6.1 Nigeria Process Orchestration Market by Component
- 8.4.5.6.2 Nigeria Process Orchestration Market by Vertical
- 8.4.5.6.3 Nigeria Process Orchestration Market by Organization size
- 8.4.5.6.4 Nigeria Process Orchestration Market by Deployment Model
- 8.4.5.7 Rest of LAMEA Process Orchestration Market
- 8.4.5.7.1 Rest of LAMEA Process Orchestration Market by Component
- 8.4.5.7.2 Rest of LAMEA Process Orchestration Market by Vertical
- 8.4.5.7.3 Rest of LAMEA Process Orchestration Market by Organization size
- 8.4.5.7.4 Rest of LAMEA Process Orchestration Market by Deployment Model
- 8.4.5.1 Brazil Process Orchestration Market
- 8.4.1 LAMEA Process Orchestration Market by Component
Chapter 9. Company Profiles
- 9.1 IBM Corporation
- 9.1.1 Company Overview
- 9.1.2 Financial Analysis
- 9.1.3 Regional & Segmental Analysis
- 9.1.4 Research & Development Expenses
- 9.1.5 Recent strategies and developments:
- 9.1.5.1 Product Launches and Product Expansions:
- 9.1.5.2 Acquisition and Mergers:
- 9.1.6 SWOT Analysis
- 9.2 Oracle Corporation
- 9.2.1 Company Overview
- 9.2.2 Financial Analysis
- 9.2.3 Segmental and Regional Analysis
- 9.2.4 Research & Development Expense
- 9.2.5 Recent strategies and developments:
- 9.2.5.1 Acquisition and Mergers:
- 9.2.6 SWOT Analysis
- 9.3 SAP SE
- 9.3.1 Company Overview
- 9.3.2 Financial Analysis
- 9.3.3 Segmental and Regional Analysis
- 9.3.4 Research & Development Expense
- 9.3.5 Recent strategies and developments:
- 9.3.5.1 Acquisition and Mergers:
- 9.3.6 SWOT Analysis
- 9.4 Broadcom, Inc.
- 9.4.1 Company Overview
- 9.4.2 Financial Analysis
- 9.4.3 Segmental and Regional Analysis
- 9.4.4 Research & Development Expense
- 9.4.5 Recent strategies and developments:
- 9.4.5.1 Partnerships, Collaborations, and Agreements:
- 9.4.5.2 Product Launches and Product Expansions:
- 9.4.5.3 Acquisition and Mergers:
- 9.5 Fujitsu Limited
- 9.5.1 Company Overview
- 9.5.2 Financial Analysis
- 9.5.3 Segmental Analysis
- 9.5.4 Recent strategies and developments:
- 9.5.4.1 Partnerships, Collaborations, and Agreements:
- 9.5.4.2 Product Launches and Product Expansions:
- 9.5.5 SWOT Analysis
- 9.6 Cisco Systems, Inc.
- 9.6.1 Company Overview
- 9.6.2 Financial Analysis
- 9.6.3 Regional Analysis
- 9.6.4 Research & Development Expense
- 9.6.5 Recent strategies and developments:
- 9.6.5.1 Partnerships, Collaborations, and Agreements:
- 9.6.5.2 Acquisition and Mergers:
- 9.6.6 SWOT Analysis
- 9.7 Wipro Limited
- 9.7.1 Company Overview
- 9.7.2 Financial Analysis
- 9.7.3 Segmental and Regional Analysis
- 9.7.4 Research & Development Expenses
- 9.7.5 Recent strategies and developments:
- 9.7.5.1 Partnerships, Collaborations, and Agreements:
- 9.8 HCL Technologies Ltd. (HCL Enterprises)
- 9.8.1 Company Overview
- 9.8.2 Financial Analysis
- 9.8.3 Segmental and Regional Analysis
- 9.8.4 Research & Development Expense
- 9.8.5 Recent strategies and developments:
- 9.8.5.1 Partnerships, Collaborations, and Agreements:
- 9.8.5.2 Product Launches and Product Expansions:
- 9.9 Software AG
- 9.9.1 Company Overview
- 9.9.2 Financial Analysis
- 9.9.3 Segmental and Regional Analysis
- 9.9.4 Research & Development Expense
- 9.9.5 Recent strategies and developments:
- 9.9.5.1 Product Launches and Product Expansions:
- 9.10. Tibco Software, Inc. (Vista Equity Partners)
- 9.10.1 Company Overview