|
|
市場調査レポート
商品コード
1115285
化合物管理の世界市場規模、シェア、産業動向分析レポートタイプ別、アプリケーション別、サンプルタイプ別(化合物、バイオサンプル)、エンドユーザー別、地域別展望と予測、2022年~2028年Global Compound Management Market Size, Share & Industry Trends Analysis Report By Type, By Application, By Sample Type (Chemical Compounds and Bio Samples), By End User, By Regional Outlook and Forecast, 2022 - 2028 |
||||||
|
|
|||||||


| 化合物管理の世界市場規模、シェア、産業動向分析レポートタイプ別、アプリケーション別、サンプルタイプ別(化合物、バイオサンプル)、エンドユーザー別、地域別展望と予測、2022年~2028年 |
|
出版日: 2022年07月29日
発行: KBV Research
ページ情報: 英文 280 Pages
納期: 即納可能
|
- 全表示
- 概要
- 図表
- 目次
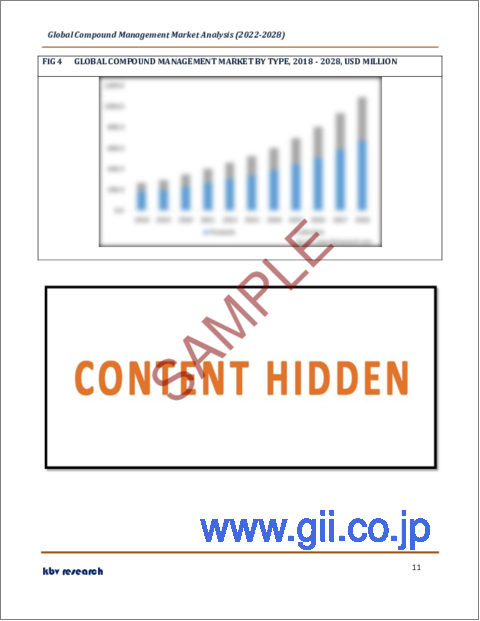
化合物管理の世界市場規模は、2028年までに11億米ドルに達し、予測期間中にCAGR15.5%の市場成長率で上昇すると予測されています。
化合物の収集管理はよりシンプルになり、サンプルの完全性は保証され、自動保管オプションによってサンプルのターンアラウンドタイムは短縮されます。さらに、新しいコンピュータ化されたサンプル管理技術によってもたらされる進歩により、新しいハイスループットスクリーニングメソッドがサポートされるようになりました。アッセイプレート調製、分子の計量と溶解、ライブラリのメンテナンスのための完全自動化プロセスは、労働集約的でミスを起こしやすいプロセスを減らすことによって、創薬ワークフローを大幅に向上させます。
COVID-19の影響分析
COVID-19の発生件数は減少しているもの、COVID-19ワクチン接種の重要性は著しく高まっています。COVID-19の新たな変異体が出現することが懸念され、COVID-19ワクチン接種の需要が高まっているのです。その結果、数多くの製薬会社がワクチンを作っています。そのため、COVID-19ワクチンの配合管理の需要が高まっているのと思われます。COVID-19の医薬品やワクチンの大半は、パンデミック時に開発中でした。しかし、2022年のPharma R &D年次評価によると、当時開発中の医薬品は、バイオテクノロジーと抗がん剤の2つが中心でした。バイオテクノロジーと抗がん剤の需要の増加により、これらの物質の医薬品パイプラインは今後数年で改善されると予想されます。コンパウンドマネジメント市場は、COVID-19の影響を大きく受けると予想されます。
市場の成長要因
医薬品・バイオ医薬品製造の成長
製薬業界で最も急速に成長しているサブセグメントがバイオ医薬品です。生物製剤の生産量増加に伴い、サンプル管理の需要が高まっており、この産業の拡大はサンプル管理市場の成長にも寄与することになります。生物製剤の需要は増加傾向にあり、バイオシミラーが開発され、生物製薬会社は研究開発に多くの費用を費やし、慢性疾患は増加傾向にあります。また、CROやCMOへの業務委託に集中することで、バイオテクノロジーやバイオファーマの大半の企業は、自社のコアコンピタンスに集中することができます。
化合物管理はスピードと精度の維持に役立つ
科学分野では、正確さとスピードがうまく両立しません。効果的な化合物管理システムは、スピードと正確さのバランスをとる必要があります。なぜなら、迅速な結果は、しばしば急いだり、不注意になったり、間違えたりすることがあるからです。ほとんどの化合物処理システムは、人による操作を減らすことを目的としています。なぜなら、それが問題の大部分を引き起こす原因だからです。ラック、カルーセル、ロボットアームは、化合物のバックアップとリカバリーの自動化システムで、化合物の保管と移送に頻繁に使用されています。保管方法としては、-20℃のジメチル・スルホキシド(DMSO)溶液での保管が推奨されています。
市場の抑制要因
化合物管理設備に巨額の投資が必要
研究施設で化学物質ライブラリーを管理する1人または複数の担当者が、定期的に化合物管理を行うため、多額の費用が発生します。ハイスループットなスクリーニングやケミカルゲノミクスにおいて、化合物管理は重要な技術要素となっています。化合物管理は大きな問題であるが、官民一体となった取り組みにより克服されつつあります。化合物・サンプル管理施設は、ハードとソフトの両面で多額の資金を必要とします。例えば、大量の在庫データベースに接続された新しい自動液体化合物保管システムの建設などが挙げられます。
タイプ別展望
化合物管理市場は、製品(化合物/サンプル自動保管システム、液体自動処理システム、その他の化合物/サンプル保管システム)とサービスに分類されます。2021年の化合物管理市場では、サービス分野が大きな収益シェアを示しています。これは、医薬品開発活動の増加、化合物管理サービスに対するニーズの高まり、医薬品研究に関連するコストを節約したいという願望の高まりが、サービスセグメントの拡大に影響を与える主な要因の一部です。
サンプルタイプの展望
化合物管理市場は、サンプルの種類によって、化学化合物とバイオサンプルに区分されます。バイオサンプルセグメントは、2021年に化合物管理市場でかなりの収益シェアを示しました。この業界は、テーラーメイド治療に対するニーズの高まりにより拡大しています。医療研究は、不可欠な生物学的材料へのアクセスを必要とします。細胞ベースの研究活動の成長は、バイオバンクに保管されている様々な生物試料の大きなニーズにつながっています。
アプリケーションの展望
化合物管理市場は、用途別に創薬、遺伝子合成、バイオバンキング、その他に分類されます。2021年の化合物管理市場では、創薬部門が最も高い収益シェアを獲得しました。生物学的標的で多数の化学物質を試験するために、高出力スクリーニングが行われるからです。ターゲットの活性に関する情報は、大規模なライブラリから収集されます。創薬により、より活性の高い分子を見つけることが可能です。したがって、創薬活動の活発化は、需要の大幅な増加につながると予測されます。
最終用途の展望
化合物管理市場は、最終用途に基づき、製薬会社、バイオ製薬会社、契約研究機関、その他に分類されます。2021年の化合物管理市場では、製薬企業セグメントが最も高い収益シェアを獲得しています。より多くの医薬品が発見されているため、化学物質のニーズが高まり、市場の拡大を後押ししているためです。化合物管理市場は、最終用途に応じて、バイオ医薬品事業者、製薬業界、受託研究機関(CRO)、政府機関や学術・研究機関を含むその他に分けられます。
地域別の展望
地域別に見ると、化合物管理市場は北米、欧州、アジア太平洋、LAMEAで分析されています。北米地域は、2021年の化合物管理市場において最大の収益シェアを調達しています。これは、同地域に創薬プロセスに従事する数多くの製薬会社やバイオテクノロジー企業が存在するためです。その結果、この分野でのサービスに対するニーズが高まっています。さらに、この分野の成長を促す要因として、疾病に関連する罹患率や死亡率の増加があり、それがより多くの医薬品候補の創出に繋がっています。公的機関による積極的な創薬・研究活動が、この地域の市場拡大をさらに後押ししています。
目次
第1章 市場の範囲と調査手法
- 市場の定義.
- 目的.
- 市場規模.
- セグメンテーション.
- 化合物管理の世界市場、タイプ別
- 化合物管理の世界市場、用途別
- 化合物管理の世界市場、サンプルタイプ別
- 化合物管理の世界市場、エンドユーザー別
- コンパウンドマネジメントの世界市場、地域別
- 調査手法
第2章 市場概要
- イントロダクション
- 概要説明
- 市場の構成とシナリオ.
- 概要説明
- 市場に影響を与える主な要因.
- 市場促進要因.
- 市場の抑制要因.
第3章 化合物管理の世界市場:タイプ別
- 製品の世界市場:地域別
- 製品タイプ別化合物管理の世界市場
- 化合物/サンプル自動保管システムの世界市場:地域別
- 自動リキッドハンドリングシステムの世界市場:地域別
- その他の地域別世界市場
- サービスの世界市場:地域別
第4章 化合物管理の世界市場:アプリケーション別
- 創薬の世界市場:地域別
- 遺伝子合成の世界市場:地域別
- バイオバンクの世界市場:地域別
- 世界のその他の市場:地域別
第5章 化合物管理の世界市場:サンプルタイプ別
- 化学化合物の世界市場:地域別
- バイオサンプルの世界市場:地域別
第6章 化合物管理の世界市場:エンドユーザー別
- 世界の製薬会社地域別市場
- バイオ製薬会社の世界市場:地域別
- 受託研究機関の世界市場:地域別
- 世界のその他地域別市場
第7章 化合物管理の世界市場:地域別
- 北米.
- 北米の化合物管理市場:国別
- 米国
- カナダ
- メキシコ
- 北米の残りの地域
- 北米の化合物管理市場:国別
- 欧州
- 欧州化合物管理市場:国別
- ドイツ
- 英国
- フランス
- ロシア
- スペイン
- イタリア
- その他欧州
- 欧州化合物管理市場:国別
- アジア太平洋地域
- アジア太平洋地域の化合物管理市場:国別
- 中国
- 日本
- インド
- 韓国
- シンガポール
- マレーシア
- その他アジア太平洋地域
- アジア太平洋地域の化合物管理市場:国別
- LAMEA
- LAMEA化合物管理市場:国別
- ブラジル
- アルゼンチン
- UAE
- サウジアラビア
- 南アフリカ
- ナイジェリア
- LAMEAの他の地域
- LAMEA化合物管理市場:国別
第8章 企業プロファイル
- Danaher Corporation(Beckman Coulter)
- Azenta US, Inc.
- Hamilton Company
- BioAscent
- Evotec SE
- SPT Labtech Ltd.
- Tecan Group Ltd.
- Titian Software
- LiCONiC AG
- AXXAM S.p.A.
LIST OF TABLES
- TABLE 1 Global Compound Management Market, 2018 - 2021, USD Million
- TABLE 2 Global Compound Management Market, 2022 - 2028, USD Million
- TABLE 3 Global Compound Management Market by Type, 2018 - 2021, USD Million
- TABLE 4 Global Compound Management Market by Type, 2022 - 2028, USD Million
- TABLE 5 Global Products Market by Region, 2018 - 2021, USD Million
- TABLE 6 Global Products Market by Region, 2022 - 2028, USD Million
- TABLE 7 Global Compound Management Market by Products Type, 2018 - 2021, USD Million
- TABLE 8 Global Compound Management Market by Products Type, 2022 - 2028, USD Million
- TABLE 9 Global Automated Compound/Sample Storage Systems Market by Region, 2018 - 2021, USD Million
- TABLE 10 Global Automated Compound/Sample Storage Systems Market by Region, 2022 - 2028, USD Million
- TABLE 11 Global Automated Liquid Handling Systems Market by Region, 2018 - 2021, USD Million
- TABLE 12 Global Automated Liquid Handling Systems Market by Region, 2022 - 2028, USD Million
- TABLE 13 Global Others Market by Region, 2018 - 2021, USD Million
- TABLE 14 Global Others Market by Region, 2022 - 2028, USD Million
- TABLE 15 Global Services Market by Region, 2018 - 2021, USD Million
- TABLE 16 Global Services Market by Region, 2022 - 2028, USD Million
- TABLE 17 Global Compound Management Market by Application, 2018 - 2021, USD Million
- TABLE 18 Global Compound Management Market by Application, 2022 - 2028, USD Million
- TABLE 19 Global Drug Discovery Market by Region, 2018 - 2021, USD Million
- TABLE 20 Global Drug Discovery Market by Region, 2022 - 2028, USD Million
- TABLE 21 Global Gene Synthesis Market by Region, 2018 - 2021, USD Million
- TABLE 22 Global Gene Synthesis Market by Region, 2022 - 2028, USD Million
- TABLE 23 Global Bio Banking Market by Region, 2018 - 2021, USD Million
- TABLE 24 Global Bio Banking Market by Region, 2022 - 2028, USD Million
- TABLE 25 Global Others Market by Region, 2018 - 2021, USD Million
- TABLE 26 Global Others Market by Region, 2022 - 2028, USD Million
- TABLE 27 Global Compound Management Market by Sample Type, 2018 - 2021, USD Million
- TABLE 28 Global Compound Management Market by Sample Type, 2022 - 2028, USD Million
- TABLE 29 Global Chemical Compounds Market by Region, 2018 - 2021, USD Million
- TABLE 30 Global Chemical Compounds Market by Region, 2022 - 2028, USD Million
- TABLE 31 Global Bio Samples Market by Region, 2018 - 2021, USD Million
- TABLE 32 Global Bio Samples Market by Region, 2022 - 2028, USD Million
- TABLE 33 Global Compound Management Market by End User, 2018 - 2021, USD Million
- TABLE 34 Global Compound Management Market by End User, 2022 - 2028, USD Million
- TABLE 35 Global Pharmaceutical Companies Market by Region, 2018 - 2021, USD Million
- TABLE 36 Global Pharmaceutical Companies Market by Region, 2022 - 2028, USD Million
- TABLE 37 Global Biopharmaceutical Companies Market by Region, 2018 - 2021, USD Million
- TABLE 38 Global Biopharmaceutical Companies Market by Region, 2022 - 2028, USD Million
- TABLE 39 Global Contract Research Organizations Market by Region, 2018 - 2021, USD Million
- TABLE 40 Global Contract Research Organizations Market by Region, 2022 - 2028, USD Million
- TABLE 41 Global Others Market by Region, 2018 - 2021, USD Million
- TABLE 42 Global Others Market by Region, 2022 - 2028, USD Million
- TABLE 43 Global Compound Management Market by Region, 2018 - 2021, USD Million
- TABLE 44 Global Compound Management Market by Region, 2022 - 2028, USD Million
- TABLE 45 North America Compound Management Market, 2018 - 2021, USD Million
- TABLE 46 North America Compound Management Market, 2022 - 2028, USD Million
- TABLE 47 North America Compound Management Market by Type, 2018 - 2021, USD Million
- TABLE 48 North America Compound Management Market by Type, 2022 - 2028, USD Million
- TABLE 49 North America Products Market by Country, 2018 - 2021, USD Million
- TABLE 50 North America Products Market by Country, 2022 - 2028, USD Million
- TABLE 51 North America Compound Management Market by Products Type, 2018 - 2021, USD Million
- TABLE 52 North America Compound Management Market by Products Type, 2022 - 2028, USD Million
- TABLE 53 North America Automated Compound/Sample Storage Systems Market by Country, 2018 - 2021, USD Million
- TABLE 54 North America Automated Compound/Sample Storage Systems Market by Country, 2022 - 2028, USD Million
- TABLE 55 North America Automated Liquid Handling Systems Market by Country, 2018 - 2021, USD Million
- TABLE 56 North America Automated Liquid Handling Systems Market by Country, 2022 - 2028, USD Million
- TABLE 57 North America Others Market by Country, 2018 - 2021, USD Million
- TABLE 58 North America Others Market by Country, 2022 - 2028, USD Million
- TABLE 59 North America Services Market by Country, 2018 - 2021, USD Million
- TABLE 60 North America Services Market by Country, 2022 - 2028, USD Million
- TABLE 61 North America Compound Management Market by Application, 2018 - 2021, USD Million
- TABLE 62 North America Compound Management Market by Application, 2022 - 2028, USD Million
- TABLE 63 North America Drug Discovery Market by Country, 2018 - 2021, USD Million
- TABLE 64 North America Drug Discovery Market by Country, 2022 - 2028, USD Million
- TABLE 65 North America Gene Synthesis Market by Country, 2018 - 2021, USD Million
- TABLE 66 North America Gene Synthesis Market by Country, 2022 - 2028, USD Million
- TABLE 67 North America Bio Banking Market by Country, 2018 - 2021, USD Million
- TABLE 68 North America Bio Banking Market by Country, 2022 - 2028, USD Million
- TABLE 69 North America Others Market by Country, 2018 - 2021, USD Million
- TABLE 70 North America Others Market by Country, 2022 - 2028, USD Million
- TABLE 71 North America Compound Management Market by Sample Type, 2018 - 2021, USD Million
- TABLE 72 North America Compound Management Market by Sample Type, 2022 - 2028, USD Million
- TABLE 73 North America Chemical Compounds Market by Country, 2018 - 2021, USD Million
- TABLE 74 North America Chemical Compounds Market by Country, 2022 - 2028, USD Million
- TABLE 75 North America Bio Samples Market by Country, 2018 - 2021, USD Million
- TABLE 76 North America Bio Samples Market by Country, 2022 - 2028, USD Million
- TABLE 77 North America Compound Management Market by End User, 2018 - 2021, USD Million
- TABLE 78 North America Compound Management Market by End User, 2022 - 2028, USD Million
- TABLE 79 North America Pharmaceutical Companies Market by Country, 2018 - 2021, USD Million
- TABLE 80 North America Pharmaceutical Companies Market by Country, 2022 - 2028, USD Million
- TABLE 81 North America Biopharmaceutical Companies Market by Country, 2018 - 2021, USD Million
- TABLE 82 North America Biopharmaceutical Companies Market by Country, 2022 - 2028, USD Million
- TABLE 83 North America Contract Research Organizations Market by Country, 2018 - 2021, USD Million
- TABLE 84 North America Contract Research Organizations Market by Country, 2022 - 2028, USD Million
- TABLE 85 North America Others Market by Country, 2018 - 2021, USD Million
- TABLE 86 North America Others Market by Country, 2022 - 2028, USD Million
- TABLE 87 North America Compound Management Market by Country, 2018 - 2021, USD Million
- TABLE 88 North America Compound Management Market by Country, 2022 - 2028, USD Million
- TABLE 89 US Compound Management Market, 2018 - 2021, USD Million
- TABLE 90 US Compound Management Market, 2022 - 2028, USD Million
- TABLE 91 US Compound Management Market by Type, 2018 - 2021, USD Million
- TABLE 92 US Compound Management Market by Type, 2022 - 2028, USD Million
- TABLE 93 US Compound Management Market by Products Type, 2018 - 2021, USD Million
- TABLE 94 US Compound Management Market by Products Type, 2022 - 2028, USD Million
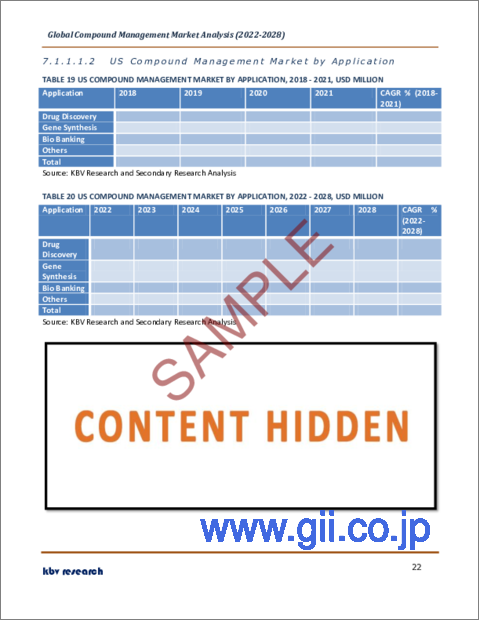
- TABLE 95 US Compound Management Market by Application, 2018 - 2021, USD Million
- TABLE 96 US Compound Management Market by Application, 2022 - 2028, USD Million
- TABLE 97 US Compound Management Market by Sample Type, 2018 - 2021, USD Million
- TABLE 98 US Compound Management Market by Sample Type, 2022 - 2028, USD Million
- TABLE 99 US Compound Management Market by End User, 2018 - 2021, USD Million
- TABLE 100 US Compound Management Market by End User, 2022 - 2028, USD Million
- TABLE 101 Canada Compound Management Market, 2018 - 2021, USD Million
- TABLE 102 Canada Compound Management Market, 2022 - 2028, USD Million
- TABLE 103 Canada Compound Management Market by Type, 2018 - 2021, USD Million
- TABLE 104 Canada Compound Management Market by Type, 2022 - 2028, USD Million
- TABLE 105 Canada Compound Management Market by Products Type, 2018 - 2021, USD Million
- TABLE 106 Canada Compound Management Market by Products Type, 2022 - 2028, USD Million
- TABLE 107 Canada Compound Management Market by Application, 2018 - 2021, USD Million
- TABLE 108 Canada Compound Management Market by Application, 2022 - 2028, USD Million
- TABLE 109 Canada Compound Management Market by Sample Type, 2018 - 2021, USD Million
- TABLE 110 Canada Compound Management Market by Sample Type, 2022 - 2028, USD Million
- TABLE 111 Canada Compound Management Market by End User, 2018 - 2021, USD Million
- TABLE 112 Canada Compound Management Market by End User, 2022 - 2028, USD Million
- TABLE 113 Mexico Compound Management Market, 2018 - 2021, USD Million
- TABLE 114 Mexico Compound Management Market, 2022 - 2028, USD Million
- TABLE 115 Mexico Compound Management Market by Type, 2018 - 2021, USD Million
- TABLE 116 Mexico Compound Management Market by Type, 2022 - 2028, USD Million
- TABLE 117 Mexico Compound Management Market by Products Type, 2018 - 2021, USD Million
- TABLE 118 Mexico Compound Management Market by Products Type, 2022 - 2028, USD Million
- TABLE 119 Mexico Compound Management Market by Application, 2018 - 2021, USD Million
- TABLE 120 Mexico Compound Management Market by Application, 2022 - 2028, USD Million
- TABLE 121 Mexico Compound Management Market by Sample Type, 2018 - 2021, USD Million
- TABLE 122 Mexico Compound Management Market by Sample Type, 2022 - 2028, USD Million
- TABLE 123 Mexico Compound Management Market by End User, 2018 - 2021, USD Million
- TABLE 124 Mexico Compound Management Market by End User, 2022 - 2028, USD Million
- TABLE 125 Rest of North America Compound Management Market, 2018 - 2021, USD Million
- TABLE 126 Rest of North America Compound Management Market, 2022 - 2028, USD Million
- TABLE 127 Rest of North America Compound Management Market by Type, 2018 - 2021, USD Million
- TABLE 128 Rest of North America Compound Management Market by Type, 2022 - 2028, USD Million
- TABLE 129 Rest of North America Compound Management Market by Products Type, 2018 - 2021, USD Million
- TABLE 130 Rest of North America Compound Management Market by Products Type, 2022 - 2028, USD Million
- TABLE 131 Rest of North America Compound Management Market by Application, 2018 - 2021, USD Million
- TABLE 132 Rest of North America Compound Management Market by Application, 2022 - 2028, USD Million
- TABLE 133 Rest of North America Compound Management Market by Sample Type, 2018 - 2021, USD Million
- TABLE 134 Rest of North America Compound Management Market by Sample Type, 2022 - 2028, USD Million
- TABLE 135 Rest of North America Compound Management Market by End User, 2018 - 2021, USD Million
- TABLE 136 Rest of North America Compound Management Market by End User, 2022 - 2028, USD Million
- TABLE 137 Europe Compound Management Market, 2018 - 2021, USD Million
- TABLE 138 Europe Compound Management Market, 2022 - 2028, USD Million
- TABLE 139 Europe Compound Management Market by Type, 2018 - 2021, USD Million
- TABLE 140 Europe Compound Management Market by Type, 2022 - 2028, USD Million
- TABLE 141 Europe Products Market by Country, 2018 - 2021, USD Million
- TABLE 142 Europe Products Market by Country, 2022 - 2028, USD Million
- TABLE 143 Europe Compound Management Market by Products Type, 2018 - 2021, USD Million
- TABLE 144 Europe Compound Management Market by Products Type, 2022 - 2028, USD Million
- TABLE 145 Europe Automated Compound/Sample Storage Systems Market by Country, 2018 - 2021, USD Million
- TABLE 146 Europe Automated Compound/Sample Storage Systems Market by Country, 2022 - 2028, USD Million
- TABLE 147 Europe Automated Liquid Handling Systems Market by Country, 2018 - 2021, USD Million
- TABLE 148 Europe Automated Liquid Handling Systems Market by Country, 2022 - 2028, USD Million
- TABLE 149 Europe Others Market by Country, 2018 - 2021, USD Million
- TABLE 150 Europe Others Market by Country, 2022 - 2028, USD Million
- TABLE 151 Europe Services Market by Country, 2018 - 2021, USD Million
- TABLE 152 Europe Services Market by Country, 2022 - 2028, USD Million
- TABLE 153 Europe Compound Management Market by Application, 2018 - 2021, USD Million
- TABLE 154 Europe Compound Management Market by Application, 2022 - 2028, USD Million
- TABLE 155 Europe Drug Discovery Market by Country, 2018 - 2021, USD Million
- TABLE 156 Europe Drug Discovery Market by Country, 2022 - 2028, USD Million
- TABLE 157 Europe Gene Synthesis Market by Country, 2018 - 2021, USD Million
- TABLE 158 Europe Gene Synthesis Market by Country, 2022 - 2028, USD Million
- TABLE 159 Europe Bio Banking Market by Country, 2018 - 2021, USD Million
- TABLE 160 Europe Bio Banking Market by Country, 2022 - 2028, USD Million
- TABLE 161 Europe Others Market by Country, 2018 - 2021, USD Million
- TABLE 162 Europe Others Market by Country, 2022 - 2028, USD Million
- TABLE 163 Europe Compound Management Market by Sample Type, 2018 - 2021, USD Million
- TABLE 164 Europe Compound Management Market by Sample Type, 2022 - 2028, USD Million
- TABLE 165 Europe Chemical Compounds Market by Country, 2018 - 2021, USD Million
- TABLE 166 Europe Chemical Compounds Market by Country, 2022 - 2028, USD Million
- TABLE 167 Europe Bio Samples Market by Country, 2018 - 2021, USD Million
- TABLE 168 Europe Bio Samples Market by Country, 2022 - 2028, USD Million
- TABLE 169 Europe Compound Management Market by End User, 2018 - 2021, USD Million
- TABLE 170 Europe Compound Management Market by End User, 2022 - 2028, USD Million
- TABLE 171 Europe Pharmaceutical Companies Market by Country, 2018 - 2021, USD Million
- TABLE 172 Europe Pharmaceutical Companies Market by Country, 2022 - 2028, USD Million
- TABLE 173 Europe Biopharmaceutical Companies Market by Country, 2018 - 2021, USD Million
- TABLE 174 Europe Biopharmaceutical Companies Market by Country, 2022 - 2028, USD Million
- TABLE 175 Europe Contract Research Organizations Market by Country, 2018 - 2021, USD Million
- TABLE 176 Europe Contract Research Organizations Market by Country, 2022 - 2028, USD Million
- TABLE 177 Europe Others Market by Country, 2018 - 2021, USD Million
- TABLE 178 Europe Others Market by Country, 2022 - 2028, USD Million
- TABLE 179 Europe Compound Management Market by Country, 2018 - 2021, USD Million
- TABLE 180 Europe Compound Management Market by Country, 2022 - 2028, USD Million
- TABLE 181 Germany Compound Management Market, 2018 - 2021, USD Million
- TABLE 182 Germany Compound Management Market, 2022 - 2028, USD Million
- TABLE 183 Germany Compound Management Market by Type, 2018 - 2021, USD Million
- TABLE 184 Germany Compound Management Market by Type, 2022 - 2028, USD Million
- TABLE 185 Germany Compound Management Market by Products Type, 2018 - 2021, USD Million
- TABLE 186 Germany Compound Management Market by Products Type, 2022 - 2028, USD Million
- TABLE 187 Germany Compound Management Market by Application, 2018 - 2021, USD Million
- TABLE 188 Germany Compound Management Market by Application, 2022 - 2028, USD Million
- TABLE 189 Germany Compound Management Market by Sample Type, 2018 - 2021, USD Million
- TABLE 190 Germany Compound Management Market by Sample Type, 2022 - 2028, USD Million
- TABLE 191 Germany Compound Management Market by End User, 2018 - 2021, USD Million
- TABLE 192 Germany Compound Management Market by End User, 2022 - 2028, USD Million
- TABLE 193 UK Compound Management Market, 2018 - 2021, USD Million
- TABLE 194 UK Compound Management Market, 2022 - 2028, USD Million
- TABLE 195 UK Compound Management Market by Type, 2018 - 2021, USD Million
- TABLE 196 UK Compound Management Market by Type, 2022 - 2028, USD Million
- TABLE 197 UK Compound Management Market by Products Type, 2018 - 2021, USD Million
- TABLE 198 UK Compound Management Market by Products Type, 2022 - 2028, USD Million
- TABLE 199 UK Compound Management Market by Application, 2018 - 2021, USD Million
- TABLE 200 UK Compound Management Market by Application, 2022 - 2028, USD Million
- TABLE 201 UK Compound Management Market by Sample Type, 2018 - 2021, USD Million
- TABLE 202 UK Compound Management Market by Sample Type, 2022 - 2028, USD Million
- TABLE 203 UK Compound Management Market by End User, 2018 - 2021, USD Million
- TABLE 204 UK Compound Management Market by End User, 2022 - 2028, USD Million
- TABLE 205 France Compound Management Market, 2018 - 2021, USD Million
- TABLE 206 France Compound Management Market, 2022 - 2028, USD Million
- TABLE 207 France Compound Management Market by Type, 2018 - 2021, USD Million
- TABLE 208 France Compound Management Market by Type, 2022 - 2028, USD Million
- TABLE 209 France Compound Management Market by Products Type, 2018 - 2021, USD Million
- TABLE 210 France Compound Management Market by Products Type, 2022 - 2028, USD Million
- TABLE 211 France Compound Management Market by Application, 2018 - 2021, USD Million
- TABLE 212 France Compound Management Market by Application, 2022 - 2028, USD Million
- TABLE 213 France Compound Management Market by Sample Type, 2018 - 2021, USD Million
- TABLE 214 France Compound Management Market by Sample Type, 2022 - 2028, USD Million
- TABLE 215 France Compound Management Market by End User, 2018 - 2021, USD Million
- TABLE 216 France Compound Management Market by End User, 2022 - 2028, USD Million
- TABLE 217 Russia Compound Management Market, 2018 - 2021, USD Million
- TABLE 218 Russia Compound Management Market, 2022 - 2028, USD Million
- TABLE 219 Russia Compound Management Market by Type, 2018 - 2021, USD Million
- TABLE 220 Russia Compound Management Market by Type, 2022 - 2028, USD Million
- TABLE 221 Russia Compound Management Market by Products Type, 2018 - 2021, USD Million
- TABLE 222 Russia Compound Management Market by Products Type, 2022 - 2028, USD Million
- TABLE 223 Russia Compound Management Market by Application, 2018 - 2021, USD Million
- TABLE 224 Russia Compound Management Market by Application, 2022 - 2028, USD Million
- TABLE 225 Russia Compound Management Market by Sample Type, 2018 - 2021, USD Million
- TABLE 226 Russia Compound Management Market by Sample Type, 2022 - 2028, USD Million
- TABLE 227 Russia Compound Management Market by End User, 2018 - 2021, USD Million
- TABLE 228 Russia Compound Management Market by End User, 2022 - 2028, USD Million
- TABLE 229 Spain Compound Management Market, 2018 - 2021, USD Million
- TABLE 230 Spain Compound Management Market, 2022 - 2028, USD Million
- TABLE 231 Spain Compound Management Market by Type, 2018 - 2021, USD Million
- TABLE 232 Spain Compound Management Market by Type, 2022 - 2028, USD Million
- TABLE 233 Spain Compound Management Market by Products Type, 2018 - 2021, USD Million
- TABLE 234 Spain Compound Management Market by Products Type, 2022 - 2028, USD Million
- TABLE 235 Spain Compound Management Market by Application, 2018 - 2021, USD Million
- TABLE 236 Spain Compound Management Market by Application, 2022 - 2028, USD Million
- TABLE 237 Spain Compound Management Market by Sample Type, 2018 - 2021, USD Million
- TABLE 238 Spain Compound Management Market by Sample Type, 2022 - 2028, USD Million
- TABLE 239 Spain Compound Management Market by End User, 2018 - 2021, USD Million
- TABLE 240 Spain Compound Management Market by End User, 2022 - 2028, USD Million
- TABLE 241 Italy Compound Management Market, 2018 - 2021, USD Million
- TABLE 242 Italy Compound Management Market, 2022 - 2028, USD Million
- TABLE 243 Italy Compound Management Market by Type, 2018 - 2021, USD Million
- TABLE 244 Italy Compound Management Market by Type, 2022 - 2028, USD Million
- TABLE 245 Italy Compound Management Market by Products Type, 2018 - 2021, USD Million
- TABLE 246 Italy Compound Management Market by Products Type, 2022 - 2028, USD Million
- TABLE 247 Italy Compound Management Market by Application, 2018 - 2021, USD Million
- TABLE 248 Italy Compound Management Market by Application, 2022 - 2028, USD Million
- TABLE 249 Italy Compound Management Market by Sample Type, 2018 - 2021, USD Million
- TABLE 250 Italy Compound Management Market by Sample Type, 2022 - 2028, USD Million
- TABLE 251 Italy Compound Management Market by End User, 2018 - 2021, USD Million
- TABLE 252 Italy Compound Management Market by End User, 2022 - 2028, USD Million
- TABLE 253 Rest of Europe Compound Management Market, 2018 - 2021, USD Million
- TABLE 254 Rest of Europe Compound Management Market, 2022 - 2028, USD Million
- TABLE 255 Rest of Europe Compound Management Market by Type, 2018 - 2021, USD Million
- TABLE 256 Rest of Europe Compound Management Market by Type, 2022 - 2028, USD Million
- TABLE 257 Rest of Europe Compound Management Market by Products Type, 2018 - 2021, USD Million
- TABLE 258 Rest of Europe Compound Management Market by Products Type, 2022 - 2028, USD Million
- TABLE 259 Rest of Europe Compound Management Market by Application, 2018 - 2021, USD Million
- TABLE 260 Rest of Europe Compound Management Market by Application, 2022 - 2028, USD Million
- TABLE 261 Rest of Europe Compound Management Market by Sample Type, 2018 - 2021, USD Million
- TABLE 262 Rest of Europe Compound Management Market by Sample Type, 2022 - 2028, USD Million
- TABLE 263 Rest of Europe Compound Management Market by End User, 2018 - 2021, USD Million
- TABLE 264 Rest of Europe Compound Management Market by End User, 2022 - 2028, USD Million
- TABLE 265 Asia Pacific Compound Management Market, 2018 - 2021, USD Million
- TABLE 266 Asia Pacific Compound Management Market, 2022 - 2028, USD Million
- TABLE 267 Asia Pacific Compound Management Market by Type, 2018 - 2021, USD Million
- TABLE 268 Asia Pacific Compound Management Market by Type, 2022 - 2028, USD Million
- TABLE 269 Asia Pacific Products Market by Country, 2018 - 2021, USD Million
- TABLE 270 Asia Pacific Products Market by Country, 2022 - 2028, USD Million
- TABLE 271 Asia Pacific Compound Management Market by Products Type, 2018 - 2021, USD Million
- TABLE 272 Asia Pacific Compound Management Market by Products Type, 2022 - 2028, USD Million
- TABLE 273 Asia Pacific Automated Compound/Sample Storage Systems Market by Country, 2018 - 2021, USD Million
- TABLE 274 Asia Pacific Automated Compound/Sample Storage Systems Market by Country, 2022 - 2028, USD Million
- TABLE 275 Asia Pacific Automated Liquid Handling Systems Market by Country, 2018 - 2021, USD Million
- TABLE 276 Asia Pacific Automated Liquid Handling Systems Market by Country, 2022 - 2028, USD Million
- TABLE 277 Asia Pacific Others Market by Country, 2018 - 2021, USD Million
- TABLE 278 Asia Pacific Others Market by Country, 2022 - 2028, USD Million
- TABLE 279 Asia Pacific Services Market by Country, 2018 - 2021, USD Million
- TABLE 280 Asia Pacific Services Market by Country, 2022 - 2028, USD Million
- TABLE 281 Asia Pacific Compound Management Market by Application, 2018 - 2021, USD Million
- TABLE 282 Asia Pacific Compound Management Market by Application, 2022 - 2028, USD Million
- TABLE 283 Asia Pacific Drug Discovery Market by Country, 2018 - 2021, USD Million
- TABLE 284 Asia Pacific Drug Discovery Market by Country, 2022 - 2028, USD Million
- TABLE 285 Asia Pacific Gene Synthesis Market by Country, 2018 - 2021, USD Million
- TABLE 286 Asia Pacific Gene Synthesis Market by Country, 2022 - 2028, USD Million
- TABLE 287 Asia Pacific Bio Banking Market by Country, 2018 - 2021, USD Million
- TABLE 288 Asia Pacific Bio Banking Market by Country, 2022 - 2028, USD Million
- TABLE 289 Asia Pacific Others Market by Country, 2018 - 2021, USD Million
- TABLE 290 Asia Pacific Others Market by Country, 2022 - 2028, USD Million
- TABLE 291 Asia Pacific Compound Management Market by Sample Type, 2018 - 2021, USD Million
- TABLE 292 Asia Pacific Compound Management Market by Sample Type, 2022 - 2028, USD Million
- TABLE 293 Asia Pacific Chemical Compounds Market by Country, 2018 - 2021, USD Million
- TABLE 294 Asia Pacific Chemical Compounds Market by Country, 2022 - 2028, USD Million
- TABLE 295 Asia Pacific Bio Samples Market by Country, 2018 - 2021, USD Million
- TABLE 296 Asia Pacific Bio Samples Market by Country, 2022 - 2028, USD Million
- TABLE 297 Asia Pacific Compound Management Market by End User, 2018 - 2021, USD Million
- TABLE 298 Asia Pacific Compound Management Market by End User, 2022 - 2028, USD Million
- TABLE 299 Asia Pacific Pharmaceutical Companies Market by Country, 2018 - 2021, USD Million
- TABLE 300 Asia Pacific Pharmaceutical Companies Market by Country, 2022 - 2028, USD Million
- TABLE 301 Asia Pacific Biopharmaceutical Companies Market by Country, 2018 - 2021, USD Million
- TABLE 302 Asia Pacific Biopharmaceutical Companies Market by Country, 2022 - 2028, USD Million
- TABLE 303 Asia Pacific Contract Research Organizations Market by Country, 2018 - 2021, USD Million
- TABLE 304 Asia Pacific Contract Research Organizations Market by Country, 2022 - 2028, USD Million
- TABLE 305 Asia Pacific Others Market by Country, 2018 - 2021, USD Million
- TABLE 306 Asia Pacific Others Market by Country, 2022 - 2028, USD Million
- TABLE 307 Asia Pacific Compound Management Market by Country, 2018 - 2021, USD Million
- TABLE 308 Asia Pacific Compound Management Market by Country, 2022 - 2028, USD Million
- TABLE 309 China Compound Management Market, 2018 - 2021, USD Million
- TABLE 310 China Compound Management Market, 2022 - 2028, USD Million
- TABLE 311 China Compound Management Market by Type, 2018 - 2021, USD Million
- TABLE 312 China Compound Management Market by Type, 2022 - 2028, USD Million
- TABLE 313 China Compound Management Market by Products Type, 2018 - 2021, USD Million
- TABLE 314 China Compound Management Market by Products Type, 2022 - 2028, USD Million
- TABLE 315 China Compound Management Market by Application, 2018 - 2021, USD Million
- TABLE 316 China Compound Management Market by Application, 2022 - 2028, USD Million
- TABLE 317 China Compound Management Market by Sample Type, 2018 - 2021, USD Million
- TABLE 318 China Compound Management Market by Sample Type, 2022 - 2028, USD Million
- TABLE 319 China Compound Management Market by End User, 2018 - 2021, USD Million
- TABLE 320 China Compound Management Market by End User, 2022 - 2028, USD Million
- TABLE 321 Japan Compound Management Market, 2018 - 2021, USD Million
- TABLE 322 Japan Compound Management Market, 2022 - 2028, USD Million
- TABLE 323 Japan Compound Management Market by Type, 2018 - 2021, USD Million
- TABLE 324 Japan Compound Management Market by Type, 2022 - 2028, USD Million
- TABLE 325 Japan Compound Management Market by Products Type, 2018 - 2021, USD Million
- TABLE 326 Japan Compound Management Market by Products Type, 2022 - 2028, USD Million
- TABLE 327 Japan Compound Management Market by Application, 2018 - 2021, USD Million
- TABLE 328 Japan Compound Management Market by Application, 2022 - 2028, USD Million
- TABLE 329 Japan Compound Management Market by Sample Type, 2018 - 2021, USD Million
- TABLE 330 Japan Compound Management Market by Sample Type, 2022 - 2028, USD Million
- TABLE 331 Japan Compound Management Market by End User, 2018 - 2021, USD Million
- TABLE 332 Japan Compound Management Market by End User, 2022 - 2028, USD Million
- TABLE 333 India Compound Management Market, 2018 - 2021, USD Million
- TABLE 334 India Compound Management Market, 2022 - 2028, USD Million
- TABLE 335 India Compound Management Market by Type, 2018 - 2021, USD Million
- TABLE 336 India Compound Management Market by Type, 2022 - 2028, USD Million
- TABLE 337 India Compound Management Market by Products Type, 2018 - 2021, USD Million
- TABLE 338 India Compound Management Market by Products Type, 2022 - 2028, USD Million
- TABLE 339 India Compound Management Market by Application, 2018 - 2021, USD Million
- TABLE 340 India Compound Management Market by Application, 2022 - 2028, USD Million
- TABLE 341 India Compound Management Market by Sample Type, 2018 - 2021, USD Million
- TABLE 342 India Compound Management Market by Sample Type, 2022 - 2028, USD Million
- TABLE 343 India Compound Management Market by End User, 2018 - 2021, USD Million
- TABLE 344 India Compound Management Market by End User, 2022 - 2028, USD Million
- TABLE 345 South Korea Compound Management Market, 2018 - 2021, USD Million
- TABLE 346 South Korea Compound Management Market, 2022 - 2028, USD Million
- TABLE 347 South Korea Compound Management Market by Type, 2018 - 2021, USD Million
- TABLE 348 South Korea Compound Management Market by Type, 2022 - 2028, USD Million
- TABLE 349 South Korea Compound Management Market by Products Type, 2018 - 2021, USD Million
- TABLE 350 South Korea Compound Management Market by Products Type, 2022 - 2028, USD Million
- TABLE 351 South Korea Compound Management Market by Application, 2018 - 2021, USD Million
- TABLE 352 South Korea Compound Management Market by Application, 2022 - 2028, USD Million
- TABLE 353 South Korea Compound Management Market by Sample Type, 2018 - 2021, USD Million
- TABLE 354 South Korea Compound Management Market by Sample Type, 2022 - 2028, USD Million
- TABLE 355 South Korea Compound Management Market by End User, 2018 - 2021, USD Million
- TABLE 356 South Korea Compound Management Market by End User, 2022 - 2028, USD Million
- TABLE 357 Singapore Compound Management Market, 2018 - 2021, USD Million
- TABLE 358 Singapore Compound Management Market, 2022 - 2028, USD Million
- TABLE 359 Singapore Compound Management Market by Type, 2018 - 2021, USD Million
- TABLE 360 Singapore Compound Management Market by Type, 2022 - 2028, USD Million
- TABLE 361 Singapore Compound Management Market by Products Type, 2018 - 2021, USD Million
- TABLE 362 Singapore Compound Management Market by Products Type, 2022 - 2028, USD Million
- TABLE 363 Singapore Compound Management Market by Application, 2018 - 2021, USD Million
- TABLE 364 Singapore Compound Management Market by Application, 2022 - 2028, USD Million
- TABLE 365 Singapore Compound Management Market by Sample Type, 2018 - 2021, USD Million
- TABLE 366 Singapore Compound Management Market by Sample Type, 2022 - 2028, USD Million
- TABLE 367 Singapore Compound Management Market by End User, 2018 - 2021, USD Million
- TABLE 368 Singapore Compound Management Market by End User, 2022 - 2028, USD Million
- TABLE 369 Malaysia Compound Management Market, 2018 - 2021, USD Million
- TABLE 370 Malaysia Compound Management Market, 2022 - 2028, USD Million
- TABLE 371 Malaysia Compound Management Market by Type, 2018 - 2021, USD Million
- TABLE 372 Malaysia Compound Management Market by Type, 2022 - 2028, USD Million
- TABLE 373 Malaysia Compound Management Market by Products Type, 2018 - 2021, USD Million
- TABLE 374 Malaysia Compound Management Market by Products Type, 2022 - 2028, USD Million
- TABLE 375 Malaysia Compound Management Market by Application, 2018 - 2021, USD Million
- TABLE 376 Malaysia Compound Management Market by Application, 2022 - 2028, USD Million
- TABLE 377 Malaysia Compound Management Market by Sample Type, 2018 - 2021, USD Million
- TABLE 378 Malaysia Compound Management Market by Sample Type, 2022 - 2028, USD Million
- TABLE 379 Malaysia Compound Management Market by End User, 2018 - 2021, USD Million
- TABLE 380 Malaysia Compound Management Market by End User, 2022 - 2028, USD Million
- TABLE 381 Rest of Asia Pacific Compound Management Market, 2018 - 2021, USD Million
- TABLE 382 Rest of Asia Pacific Compound Management Market, 2022 - 2028, USD Million
- TABLE 383 Rest of Asia Pacific Compound Management Market by Type, 2018 - 2021, USD Million
- TABLE 384 Rest of Asia Pacific Compound Management Market by Type, 2022 - 2028, USD Million
- TABLE 385 Rest of Asia Pacific Compound Management Market by Products Type, 2018 - 2021, USD Million
- TABLE 386 Rest of Asia Pacific Compound Management Market by Products Type, 2022 - 2028, USD Million
- TABLE 387 Rest of Asia Pacific Compound Management Market by Application, 2018 - 2021, USD Million
- TABLE 388 Rest of Asia Pacific Compound Management Market by Application, 2022 - 2028, USD Million
- TABLE 389 Rest of Asia Pacific Compound Management Market by Sample Type, 2018 - 2021, USD Million
- TABLE 390 Rest of Asia Pacific Compound Management Market by Sample Type, 2022 - 2028, USD Million
- TABLE 391 Rest of Asia Pacific Compound Management Market by End User, 2018 - 2021, USD Million
- TABLE 392 Rest of Asia Pacific Compound Management Market by End User, 2022 - 2028, USD Million
- TABLE 393 LAMEA Compound Management Market, 2018 - 2021, USD Million
- TABLE 394 LAMEA Compound Management Market, 2022 - 2028, USD Million
- TABLE 395 LAMEA Compound Management Market by Type, 2018 - 2021, USD Million
- TABLE 396 LAMEA Compound Management Market by Type, 2022 - 2028, USD Million
- TABLE 397 LAMEA Products Market by Country, 2018 - 2021, USD Million
- TABLE 398 LAMEA Products Market by Country, 2022 - 2028, USD Million
- TABLE 399 LAMEA Compound Management Market by Products Type, 2018 - 2021, USD Million
- TABLE 400 LAMEA Compound Management Market by Products Type, 2022 - 2028, USD Million
- TABLE 401 LAMEA Automated Compound/Sample Storage Systems Market by Country, 2018 - 2021, USD Million
- TABLE 402 LAMEA Automated Compound/Sample Storage Systems Market by Country, 2022 - 2028, USD Million
- TABLE 403 LAMEA Automated Liquid Handling Systems Market by Country, 2018 - 2021, USD Million
- TABLE 404 LAMEA Automated Liquid Handling Systems Market by Country, 2022 - 2028, USD Million
- TABLE 405 LAMEA Others Market by Country, 2018 - 2021, USD Million
- TABLE 406 LAMEA Others Market by Country, 2022 - 2028, USD Million
- TABLE 407 LAMEA Services Market by Country, 2018 - 2021, USD Million
- TABLE 408 LAMEA Services Market by Country, 2022 - 2028, USD Million
- TABLE 409 LAMEA Compound Management Market by Application, 2018 - 2021, USD Million
- TABLE 410 LAMEA Compound Management Market by Application, 2022 - 2028, USD Million
- TABLE 411 LAMEA Drug Discovery Market by Country, 2018 - 2021, USD Million
- TABLE 412 LAMEA Drug Discovery Market by Country, 2022 - 2028, USD Million
- TABLE 413 LAMEA Gene Synthesis Market by Country, 2018 - 2021, USD Million
- TABLE 414 LAMEA Gene Synthesis Market by Country, 2022 - 2028, USD Million
- TABLE 415 LAMEA Bio Banking Market by Country, 2018 - 2021, USD Million
- TABLE 416 LAMEA Bio Banking Market by Country, 2022 - 2028, USD Million
- TABLE 417 LAMEA Others Market by Country, 2018 - 2021, USD Million
- TABLE 418 LAMEA Others Market by Country, 2022 - 2028, USD Million
- TABLE 419 LAMEA Compound Management Market by Sample Type, 2018 - 2021, USD Million
- TABLE 420 LAMEA Compound Management Market by Sample Type, 2022 - 2028, USD Million
- TABLE 421 LAMEA Chemical Compounds Market by Country, 2018 - 2021, USD Million
- TABLE 422 LAMEA Chemical Compounds Market by Country, 2022 - 2028, USD Million
- TABLE 423 LAMEA Bio Samples Market by Country, 2018 - 2021, USD Million
- TABLE 424 LAMEA Bio Samples Market by Country, 2022 - 2028, USD Million
- TABLE 425 LAMEA Compound Management Market by End User, 2018 - 2021, USD Million
- TABLE 426 LAMEA Compound Management Market by End User, 2022 - 2028, USD Million
- TABLE 427 LAMEA Pharmaceutical Companies Market by Country, 2018 - 2021, USD Million
- TABLE 428 LAMEA Pharmaceutical Companies Market by Country, 2022 - 2028, USD Million
- TABLE 429 LAMEA Biopharmaceutical Companies Market by Country, 2018 - 2021, USD Million
- TABLE 430 LAMEA Biopharmaceutical Companies Market by Country, 2022 - 2028, USD Million
- TABLE 431 LAMEA Contract Research Organizations Market by Country, 2018 - 2021, USD Million
- TABLE 432 LAMEA Contract Research Organizations Market by Country, 2022 - 2028, USD Million
- TABLE 433 LAMEA Others Market by Country, 2018 - 2021, USD Million
- TABLE 434 LAMEA Others Market by Country, 2022 - 2028, USD Million
- TABLE 435 LAMEA Compound Management Market by Country, 2018 - 2021, USD Million
- TABLE 436 LAMEA Compound Management Market by Country, 2022 - 2028, USD Million
- TABLE 437 Brazil Compound Management Market, 2018 - 2021, USD Million
- TABLE 438 Brazil Compound Management Market, 2022 - 2028, USD Million
- TABLE 439 Brazil Compound Management Market by Type, 2018 - 2021, USD Million
- TABLE 440 Brazil Compound Management Market by Type, 2022 - 2028, USD Million
- TABLE 441 Brazil Compound Management Market by Products Type, 2018 - 2021, USD Million
- TABLE 442 Brazil Compound Management Market by Products Type, 2022 - 2028, USD Million
- TABLE 443 Brazil Compound Management Market by Application, 2018 - 2021, USD Million
- TABLE 444 Brazil Compound Management Market by Application, 2022 - 2028, USD Million
- TABLE 445 Brazil Compound Management Market by Sample Type, 2018 - 2021, USD Million
- TABLE 446 Brazil Compound Management Market by Sample Type, 2022 - 2028, USD Million
- TABLE 447 Brazil Compound Management Market by End User, 2018 - 2021, USD Million
- TABLE 448 Brazil Compound Management Market by End User, 2022 - 2028, USD Million
- TABLE 449 Argentina Compound Management Market, 2018 - 2021, USD Million
- TABLE 450 Argentina Compound Management Market, 2022 - 2028, USD Million
- TABLE 451 Argentina Compound Management Market by Type, 2018 - 2021, USD Million
- TABLE 452 Argentina Compound Management Market by Type, 2022 - 2028, USD Million
- TABLE 453 Argentina Compound Management Market by Products Type, 2018 - 2021, USD Million
- TABLE 454 Argentina Compound Management Market by Products Type, 2022 - 2028, USD Million
- TABLE 455 Argentina Compound Management Market by Application, 2018 - 2021, USD Million
- TABLE 456 Argentina Compound Management Market by Application, 2022 - 2028, USD Million
- TABLE 457 Argentina Compound Management Market by Sample Type, 2018 - 2021, USD Million
- TABLE 458 Argentina Compound Management Market by Sample Type, 2022 - 2028, USD Million
- TABLE 459 Argentina Compound Management Market by End User, 2018 - 2021, USD Million
- TABLE 460 Argentina Compound Management Market by End User, 2022 - 2028, USD Million
- TABLE 461 UAE Compound Management Market, 2018 - 2021, USD Million
- TABLE 462 UAE Compound Management Market, 2022 - 2028, USD Million
- TABLE 463 UAE Compound Management Market by Type, 2018 - 2021, USD Million
- TABLE 464 UAE Compound Management Market by Type, 2022 - 2028, USD Million
- TABLE 465 UAE Compound Management Market by Products Type, 2018 - 2021, USD Million
- TABLE 466 UAE Compound Management Market by Products Type, 2022 - 2028, USD Million
- TABLE 467 UAE Compound Management Market by Application, 2018 - 2021, USD Million
- TABLE 468 UAE Compound Management Market by Application, 2022 - 2028, USD Million
- TABLE 469 UAE Compound Management Market by Sample Type, 2018 - 2021, USD Million
- TABLE 470 UAE Compound Management Market by Sample Type, 2022 - 2028, USD Million
- TABLE 471 UAE Compound Management Market by End User, 2018 - 2021, USD Million
- TABLE 472 UAE Compound Management Market by End User, 2022 - 2028, USD Million
- TABLE 473 Saudi Arabia Compound Management Market, 2018 - 2021, USD Million
- TABLE 474 Saudi Arabia Compound Management Market, 2022 - 2028, USD Million
- TABLE 475 Saudi Arabia Compound Management Market by Type, 2018 - 2021, USD Million
- TABLE 476 Saudi Arabia Compound Management Market by Type, 2022 - 2028, USD Million
- TABLE 477 Saudi Arabia Compound Management Market by Products Type, 2018 - 2021, USD Million
- TABLE 478 Saudi Arabia Compound Management Market by Products Type, 2022 - 2028, USD Million
- TABLE 479 Saudi Arabia Compound Management Market by Application, 2018 - 2021, USD Million
- TABLE 480 Saudi Arabia Compound Management Market by Application, 2022 - 2028, USD Million
- TABLE 481 Saudi Arabia Compound Management Market by Sample Type, 2018 - 2021, USD Million
- TABLE 482 Saudi Arabia Compound Management Market by Sample Type, 2022 - 2028, USD Million
- TABLE 483 Saudi Arabia Compound Management Market by End User, 2018 - 2021, USD Million
- TABLE 484 Saudi Arabia Compound Management Market by End User, 2022 - 2028, USD Million
- TABLE 485 South Africa Compound Management Market, 2018 - 2021, USD Million
- TABLE 486 South Africa Compound Management Market, 2022 - 2028, USD Million
- TABLE 487 South Africa Compound Management Market by Type, 2018 - 2021, USD Million
- TABLE 488 South Africa Compound Management Market by Type, 2022 - 2028, USD Million
- TABLE 489 South Africa Compound Management Market by Products Type, 2018 - 2021, USD Million
- TABLE 490 South Africa Compound Management Market by Products Type, 2022 - 2028, USD Million
- TABLE 491 South Africa Compound Management Market by Application, 2018 - 2021, USD Million
- TABLE 492 South Africa Compound Management Market by Application, 2022 - 2028, USD Million
- TABLE 493 South Africa Compound Management Market by Sample Type, 2018 - 2021, USD Million
- TABLE 494 South Africa Compound Management Market by Sample Type, 2022 - 2028, USD Million
- TABLE 495 South Africa Compound Management Market by End User, 2018 - 2021, USD Million
- TABLE 496 South Africa Compound Management Market by End User, 2022 - 2028, USD Million
- TABLE 497 Nigeria Compound Management Market, 2018 - 2021, USD Million
- TABLE 498 Nigeria Compound Management Market, 2022 - 2028, USD Million
- TABLE 499 Nigeria Compound Management Market by Type, 2018 - 2021, USD Million
- TABLE 500 Nigeria Compound Management Market by Type, 2022 - 2028, USD Million
- TABLE 501 Nigeria Compound Management Market by Products Type, 2018 - 2021, USD Million
- TABLE 502 Nigeria Compound Management Market by Products Type, 2022 - 2028, USD Million
- TABLE 503 Nigeria Compound Management Market by Application, 2018 - 2021, USD Million
- TABLE 504 Nigeria Compound Management Market by Application, 2022 - 2028, USD Million
- TABLE 505 Nigeria Compound Management Market by Sample Type, 2018 - 2021, USD Million
- TABLE 506 Nigeria Compound Management Market by Sample Type, 2022 - 2028, USD Million
- TABLE 507 Nigeria Compound Management Market by End User, 2018 - 2021, USD Million
- TABLE 508 Nigeria Compound Management Market by End User, 2022 - 2028, USD Million
- TABLE 509 Rest of LAMEA Compound Management Market, 2018 - 2021, USD Million
- TABLE 510 Rest of LAMEA Compound Management Market, 2022 - 2028, USD Million
- TABLE 511 Rest of LAMEA Compound Management Market by Type, 2018 - 2021, USD Million
- TABLE 512 Rest of LAMEA Compound Management Market by Type, 2022 - 2028, USD Million
- TABLE 513 Rest of LAMEA Compound Management Market by Products Type, 2018 - 2021, USD Million
- TABLE 514 Rest of LAMEA Compound Management Market by Products Type, 2022 - 2028, USD Million
- TABLE 515 Rest of LAMEA Compound Management Market by Application, 2018 - 2021, USD Million
- TABLE 516 Rest of LAMEA Compound Management Market by Application, 2022 - 2028, USD Million
- TABLE 517 Rest of LAMEA Compound Management Market by Sample Type, 2018 - 2021, USD Million
- TABLE 518 Rest of LAMEA Compound Management Market by Sample Type, 2022 - 2028, USD Million
- TABLE 519 Rest of LAMEA Compound Management Market by End User, 2018 - 2021, USD Million
- TABLE 520 Rest of LAMEA Compound Management Market by End User, 2022 - 2028, USD Million
- TABLE 521 Key Information - Danaher Corporation
- TABLE 522 Key Information - Azenta US, Inc.
- TABLE 523 key information - Hamilton Company
- TABLE 524 key Information - BioAscent
- TABLE 525 Key Information - Evotec SE
- TABLE 526 Key Information - SPT Labtech LTD.
- TABLE 527 Key Information - Tecan Group Ltd.
- TABLE 528 Key Information - Titian Software
- TABLE 529 Key Information - LiCONiC AG
- TABLE 530 Key Information - AXXAM S.p.A.
List of Figures
- FIG 1 Methodology for the research
- FIG 2 Global Compound Management Market share by Type, 2021
- FIG 3 Global Compound Management Market share by Type, 2028
- FIG 4 Global Compound Management Market by Type, 2018 - 2028, USD Million
- FIG 5 Global Compound Management Market share by Application, 2021
- FIG 6 Global Compound Management Market share by Application, 2028
- FIG 7 Global Compound Management Market by Application, 2018 - 2028, USD Million
- FIG 8 Global Compound Management Market share by Sample Type, 2021
- FIG 9 Global Compound Management Market share by Sample Type, 2028
- FIG 10 Global Compound Management Market by Sample Type, 2018 - 2028, USD Million
- FIG 11 Global Compound Management Market share by End User, 2021
- FIG 12 Global Compound Management Market share by End User, 2028
- FIG 13 Global Compound Management Market by End User, 2018 - 2028, USD Million
- FIG 14 Global Compound Management Market share by Region, 2021
- FIG 15 Global Compound Management Market share by Region, 2028
- FIG 16 Global Compound Management Market by Region, 2018 - 2028, USD Million
The Global Compound Management Market size is expected to reach $1.1 billion by 2028, rising at a market growth of 15.5% CAGR during the forecast period.
Compound management comprises maintaining the chemical libraries, which includes robotics for chemical retrieval and database updates of chemical information. It also includes restoring out-of-date chemicals and maintaining the quality of the storage environment. Compound Control is another name for compound management.
Compound Management provides the infrastructure and logistics that aid in managing research compounds. It aids in the development of new drugs, and entails the logistics of storing, preparing, and evaluating compounds for testing as well as dispensing them during the drug discovery process. To avoid significant ripple effects that could prevent the release of treatments that are feasible and effective, compound management must be handled properly and meticulously. Due to the impact of using the incorrect chemical for comparison, inaccurate compound concentrations, or testing.
Compound collection management is made simpler, sample integrity is guaranteed, and turnaround times for samples are sped up through automated storage options. Additionally, novel high-throughput screening methods are now supported by advancements brought about by new computerized sample management technology. Fully automated processes for assay plate preparation, molecular weighing and dissolution, and library maintenance greatly enhance drug discovery workflows by reducing labor-intensive and error-prone processes.
COVID-19 Impact Analysis
Despite the decrease in COVID-19 incidences, the importance of COVID-19 vaccinations has increased significantly. The demand for COVID-19 vaccinations is rising as a result of the concern that a new COVID-19 variation would emerge. As a result, numerous pharmaceutical companies are creating vaccines. This is probably going to increase demand for COVID-19 vaccine compound management. The majority of COVID-19 medications and vaccines were in development during the pandemic. However, according to the Pharma R & D annual assessment for 2022, the two main pharmaceuticals in development at the time were biotechnology and anticancer medications. Due to the increased demand for biotechnology and anticancer medications, the drug pipeline for these substances is anticipated to improve in the upcoming years. The Compound Management market is anticipated to be significantly affected by COVID 19.
Market Growth Factors
Growing Pharmaceutical And Biopharmaceutical Manufacturing
The pharmaceutical industry's fastest-growing subsegment is biopharmaceuticals. As the demand for sample management rises as a result of increased biologic production, the expansion of this industry will also aid that of the sample management market. Biologics demand is on the rise, biosimilars are developing, biopharmaceutical companies are spending more on research and development, and chronic diseases are on the rise. Additionally, by concentrating on outsourcing tasks to CROs and CMOs, the majority of biotech and biopharma businesses can concentrate on their core competencies.
Compound Management Helps Maintain Speed And Accuracy
inIn the sciences, accuracy and speed don't combine well. An effective compound management system must strike a balance between speed and accuracy because quick outcomes are frequently hurried, careless, or erroneous. Most compound handling systems aim to reduce human handling because it is the source of the vast majority of problems. Racks, carousels, and robotic arms are frequently used in automated compound backup and recovery systems to store and transfer compounds. The recommended method of storage is in a -20 °C dimethyl sulfoxide (DMSO) solution.
Market Restraining Factors
Compound Management Facilities Required Huge Investments
One or more people who oversee a chemical library at a research facility incur large costs for compound management regularly. For high-throughput screening and chemical genomics, it has emerged as a crucial technological element. The requirement for compound management presents significant problems, which are being overcome by coordinated efforts in both the public and private spheres. A compound/sample management facility requires significant financial outlays for both hardware and software, including the construction of new automated liquid compound storage systems connected to a substantial inventory database.
Type Outlook
Based on type, the compound management market is classified into Products (Automated Compound/Sample Storage Systems, Automated Liquid Handling Systems, and Other Compound/Sample Storage Systems) and services. The service segment witnessed a significant revenue share in the compound management market in 2021. It is due to the rise in drug development activities, the rising need for compound management services, and the growing desire to save costs associated with drug research are some of the key factors influencing the service segment's expansion.
Sample Type Outlook
On the basis of sample type, the compound management market is segmented into Chemical Compounds and Bio Samples. The bio sample segment witnessed a substantial revenue share in the compound management market in 2021. The industry is expanding due to the rising need for tailored treatments. Medical research requires access to essential biological material. The growth of cell-based research activities has resulted in a significant need for various biospecimens kept in biobanks.
Application Outlook
By application, the compound management market is divided into Drug Discovery, Gene Synthesis, Bio Banking and Others. The drug discovery segment garnered the highest revenue share in the compound management market in 2021. It is because to test a large number of chemicals with a biological target, high output screening is performed. The information on target activities is gathered from a large library. It is possible to find more active molecules through drug discovery. Thus, it is projected that an increase in drug discovery activity would lead to a significant increase in demand.
End-Use Outlook
Based on end-use, the compound management market is fragmented into Pharmaceutical Companies, Biopharmaceutical Companies, Contract Research Organizations and Others. The pharmaceutical companies segment garnered the highest revenue share in the compound management market in 2021. It is because more drugs are being discovered, that there is a raising need for chemicals, which is boosting the market's expansion. The market for compound management is divided into biopharmaceutical businesses, the pharmaceutical industry, contract research organizations (CROs), and others, which include governmental, academic, and research institutions, based on end-use.
Regional Outlook
Region-wise, the compound management market is analyzed across North America, Europe, Asia Pacific and LAMEA. The North America region procured the largest revenue share in the compound management market in 2021. This is because the region is home to numerous pharmaceutical and biotechnology companies engaged in the drug discovery process. Consequently, there is a raising need for services in this area. A further factor driving this sector's growth is the increase in disease-related morbidity and mortality, which has led to the creation of more medication candidates. Positive drug discovery and research endeavors by public entities are further fostering regional market expansion.
The market research report covers the analysis of key stake holders of the market. Key companies profiled in the report include Danaher Corporation (Beckman Coulter), Azenta US, Inc., Hamilton Company, BioAscent, Evotec SE, SPT Labtech Ltd., Tecan Group Ltd., Titian Software, LiCONiC AG, and AXXAM S.p.A.
Scope of the Study
Market Segments covered in the Report:
By Type
- Products
- Automated Compound/Sample Storage Systems
- Automated Liquid Handling Systems
- Others
- Services
By Application
- Drug Discovery
- Gene Synthesis
- Bio Banking
- Others
By Sample Type
- Chemical Compounds
- Bio Samples
By End User
- Pharmaceutical Companies
- Biopharmaceutical Companies
- Contract Research Organizations
- Others
By Geography
- North America
- US
- Canada
- Mexico
- Rest of North America
- Europe
- Germany
- UK
- France
- Russia
- Spain
- Italy
- Rest of Europe
- Asia Pacific
- China
- Japan
- India
- South Korea
- Singapore
- Malaysia
- Rest of Asia Pacific
- LAMEA
- Brazil
- Argentina
- UAE
- Saudi Arabia
- South Africa
- Nigeria
- Rest of LAMEA
Companies Profiled
- Danaher Corporation (Beckman Coulter)
- Azenta US, Inc.
- Hamilton Company
- BioAscent
- Evotec SE
- SPT Labtech Ltd.
- Tecan Group Ltd.
- Titian Software
- LiCONiC AG
- AXXAM S.p.A.
Unique Offerings from KBV Research
- Exhaustive coverage
- Highest number of market tables and figures
- Subscription based model available
- Guaranteed best price
- Assured post sales research support with 10% customization free
Table of Contents
Chapter 1. Market Scope & Methodology
- 1.1 Market Definition
- 1.2 Objectives
- 1.3 Market Scope
- 1.4 Segmentation
- 1.4.1 Global Compound Management Market, by Type
- 1.4.2 Global Compound Management Market, by Application
- 1.4.3 Global Compound Management Market, by Sample Type
- 1.4.4 Global Compound Management Market, by End User
- 1.4.5 Global Compound Management Market, by Geography
- 1.5 Methodology for the research
Chapter 2. Market Overview
- 2.1 Introduction
- 2.1.1 Overview
- 2.1.1.1 Market Composition and Scenario
- 2.1.1 Overview
- 2.2 Key Factors Impacting the Market
- 2.2.1 Market Drivers
- 2.2.2 Market Restraints
Chapter 3. Global Compound Management Market by Type
- 3.1 Global Products Market by Region
- 3.2 Global Compound Management Market by Products Type
- 3.2.1 Global Automated Compound/Sample Storage Systems Market by Region
- 3.2.2 Global Automated Liquid Handling Systems Market by Region
- 3.2.3 Global Others Market by Region
- 3.3 Global Services Market by Region
Chapter 4. Global Compound Management Market by Application
- 4.1 Global Drug Discovery Market by Region
- 4.2 Global Gene Synthesis Market by Region
- 4.3 Global Bio Banking Market by Region
- 4.4 Global Others Market by Region
Chapter 5. Global Compound Management Market by Sample Type
- 5.1 Global Chemical Compounds Market by Region
- 5.2 Global Bio Samples Market by Region
Chapter 6. Global Compound Management Market by End User
- 6.1 Global Pharmaceutical Companies Market by Region
- 6.2 Global Biopharmaceutical Companies Market by Region
- 6.3 Global Contract Research Organizations Market by Region
- 6.4 Global Others Market by Region
Chapter 7. Global Compound Management Market by Region
- 7.1 North America Compound Management Market
- 7.1.1 North America Compound Management Market by Type
- 7.1.1.1 North America Products Market by Country
- 7.1.1.2 North America Compound Management Market by Products Type
- 7.1.1.2.1 North America Automated Compound/Sample Storage Systems Market by Country
- 7.1.1.2.2 North America Automated Liquid Handling Systems Market by Country
- 7.1.1.2.3 North America Others Market by Country
- 7.1.1.3 North America Services Market by Country
- 7.1.2 North America Compound Management Market by Application
- 7.1.2.1 North America Drug Discovery Market by Country
- 7.1.2.2 North America Gene Synthesis Market by Country
- 7.1.2.3 North America Bio Banking Market by Country
- 7.1.2.4 North America Others Market by Country
- 7.1.3 North America Compound Management Market by Sample Type
- 7.1.3.1 North America Chemical Compounds Market by Country
- 7.1.3.2 North America Bio Samples Market by Country
- 7.1.4 North America Compound Management Market by End User
- 7.1.4.1 North America Pharmaceutical Companies Market by Country
- 7.1.4.2 North America Biopharmaceutical Companies Market by Country
- 7.1.4.3 North America Contract Research Organizations Market by Country
- 7.1.4.4 North America Others Market by Country
- 7.1.5 North America Compound Management Market by Country
- 7.1.5.1 US Compound Management Market
- 7.1.5.1.1 US Compound Management Market by Type
- 7.1.5.1.2 US Compound Management Market by Application
- 7.1.5.1.3 US Compound Management Market by Sample Type
- 7.1.5.1.4 US Compound Management Market by End User
- 7.1.5.2 Canada Compound Management Market
- 7.1.5.2.1 Canada Compound Management Market by Type
- 7.1.5.2.2 Canada Compound Management Market by Application
- 7.1.5.2.3 Canada Compound Management Market by Sample Type
- 7.1.5.2.4 Canada Compound Management Market by End User
- 7.1.5.3 Mexico Compound Management Market
- 7.1.5.3.1 Mexico Compound Management Market by Type
- 7.1.5.3.2 Mexico Compound Management Market by Application
- 7.1.5.3.3 Mexico Compound Management Market by Sample Type
- 7.1.5.3.4 Mexico Compound Management Market by End User
- 7.1.5.4 Rest of North America Compound Management Market
- 7.1.5.4.1 Rest of North America Compound Management Market by Type
- 7.1.5.4.2 Rest of North America Compound Management Market by Application
- 7.1.5.4.3 Rest of North America Compound Management Market by Sample Type
- 7.1.5.4.4 Rest of North America Compound Management Market by End User
- 7.1.5.1 US Compound Management Market
- 7.1.1 North America Compound Management Market by Type
- 7.2 Europe Compound Management Market
- 7.2.1 Europe Compound Management Market by Type
- 7.2.1.1 Europe Products Market by Country
- 7.2.1.2 Europe Compound Management Market by Products Type
- 7.2.1.2.1 Europe Automated Compound/Sample Storage Systems Market by Country
- 7.2.1.2.2 Europe Automated Liquid Handling Systems Market by Country
- 7.2.1.2.3 Europe Others Market by Country
- 7.2.1.3 Europe Services Market by Country
- 7.2.2 Europe Compound Management Market by Application
- 7.2.2.1 Europe Drug Discovery Market by Country
- 7.2.2.2 Europe Gene Synthesis Market by Country
- 7.2.2.3 Europe Bio Banking Market by Country
- 7.2.2.4 Europe Others Market by Country
- 7.2.3 Europe Compound Management Market by Sample Type
- 7.2.3.1 Europe Chemical Compounds Market by Country
- 7.2.3.2 Europe Bio Samples Market by Country
- 7.2.4 Europe Compound Management Market by End User
- 7.2.4.1 Europe Pharmaceutical Companies Market by Country
- 7.2.4.2 Europe Biopharmaceutical Companies Market by Country
- 7.2.4.3 Europe Contract Research Organizations Market by Country
- 7.2.4.4 Europe Others Market by Country
- 7.2.5 Europe Compound Management Market by Country
- 7.2.5.1 Germany Compound Management Market
- 7.2.5.1.1 Germany Compound Management Market by Type
- 7.2.5.1.2 Germany Compound Management Market by Application
- 7.2.5.1.3 Germany Compound Management Market by Sample Type
- 7.2.5.1.4 Germany Compound Management Market by End User
- 7.2.5.2 UK Compound Management Market
- 7.2.5.2.1 UK Compound Management Market by Type
- 7.2.5.2.2 UK Compound Management Market by Application
- 7.2.5.2.3 UK Compound Management Market by Sample Type
- 7.2.5.2.4 UK Compound Management Market by End User
- 7.2.5.3 France Compound Management Market
- 7.2.5.3.1 France Compound Management Market by Type
- 7.2.5.3.2 France Compound Management Market by Application
- 7.2.5.3.3 France Compound Management Market by Sample Type
- 7.2.5.3.4 France Compound Management Market by End User
- 7.2.5.4 Russia Compound Management Market
- 7.2.5.4.1 Russia Compound Management Market by Type
- 7.2.5.4.2 Russia Compound Management Market by Application
- 7.2.5.4.3 Russia Compound Management Market by Sample Type
- 7.2.5.4.4 Russia Compound Management Market by End User
- 7.2.5.5 Spain Compound Management Market
- 7.2.5.5.1 Spain Compound Management Market by Type
- 7.2.5.5.2 Spain Compound Management Market by Application
- 7.2.5.5.3 Spain Compound Management Market by Sample Type
- 7.2.5.5.4 Spain Compound Management Market by End User
- 7.2.5.6 Italy Compound Management Market
- 7.2.5.6.1 Italy Compound Management Market by Type
- 7.2.5.6.2 Italy Compound Management Market by Application
- 7.2.5.6.3 Italy Compound Management Market by Sample Type
- 7.2.5.6.4 Italy Compound Management Market by End User
- 7.2.5.7 Rest of Europe Compound Management Market
- 7.2.5.7.1 Rest of Europe Compound Management Market by Type
- 7.2.5.7.2 Rest of Europe Compound Management Market by Application
- 7.2.5.7.3 Rest of Europe Compound Management Market by Sample Type
- 7.2.5.7.4 Rest of Europe Compound Management Market by End User
- 7.2.5.1 Germany Compound Management Market
- 7.2.1 Europe Compound Management Market by Type
- 7.3 Asia Pacific Compound Management Market
- 7.3.1 Asia Pacific Compound Management Market by Type
- 7.3.1.1 Asia Pacific Products Market by Country
- 7.3.1.2 Asia Pacific Compound Management Market by Products Type
- 7.3.1.2.1 Asia Pacific Automated Compound/Sample Storage Systems Market by Country
- 7.3.1.2.2 Asia Pacific Automated Liquid Handling Systems Market by Country
- 7.3.1.2.3 Asia Pacific Others Market by Country
- 7.3.1.3 Asia Pacific Services Market by Country
- 7.3.2 Asia Pacific Compound Management Market by Application
- 7.3.2.1 Asia Pacific Drug Discovery Market by Country
- 7.3.2.2 Asia Pacific Gene Synthesis Market by Country
- 7.3.2.3 Asia Pacific Bio Banking Market by Country
- 7.3.2.4 Asia Pacific Others Market by Country
- 7.3.3 Asia Pacific Compound Management Market by Sample Type
- 7.3.3.1 Asia Pacific Chemical Compounds Market by Country
- 7.3.3.2 Asia Pacific Bio Samples Market by Country
- 7.3.4 Asia Pacific Compound Management Market by End User
- 7.3.4.1 Asia Pacific Pharmaceutical Companies Market by Country
- 7.3.4.2 Asia Pacific Biopharmaceutical Companies Market by Country
- 7.3.4.3 Asia Pacific Contract Research Organizations Market by Country
- 7.3.4.4 Asia Pacific Others Market by Country
- 7.3.5 Asia Pacific Compound Management Market by Country
- 7.3.5.1 China Compound Management Market
- 7.3.5.1.1 China Compound Management Market by Type
- 7.3.5.1.2 China Compound Management Market by Application
- 7.3.5.1.3 China Compound Management Market by Sample Type
- 7.3.5.1.4 China Compound Management Market by End User
- 7.3.5.2 Japan Compound Management Market
- 7.3.5.2.1 Japan Compound Management Market by Type
- 7.3.5.2.2 Japan Compound Management Market by Application
- 7.3.5.2.3 Japan Compound Management Market by Sample Type
- 7.3.5.2.4 Japan Compound Management Market by End User
- 7.3.5.3 India Compound Management Market
- 7.3.5.3.1 India Compound Management Market by Type
- 7.3.5.3.2 India Compound Management Market by Application
- 7.3.5.3.3 India Compound Management Market by Sample Type
- 7.3.5.3.4 India Compound Management Market by End User
- 7.3.5.4 South Korea Compound Management Market
- 7.3.5.4.1 South Korea Compound Management Market by Type
- 7.3.5.4.2 South Korea Compound Management Market by Application
- 7.3.5.4.3 South Korea Compound Management Market by Sample Type
- 7.3.5.4.4 South Korea Compound Management Market by End User
- 7.3.5.5 Singapore Compound Management Market
- 7.3.5.5.1 Singapore Compound Management Market by Type
- 7.3.5.5.2 Singapore Compound Management Market by Application
- 7.3.5.5.3 Singapore Compound Management Market by Sample Type
- 7.3.5.5.4 Singapore Compound Management Market by End User
- 7.3.5.6 Malaysia Compound Management Market
- 7.3.5.6.1 Malaysia Compound Management Market by Type
- 7.3.5.6.2 Malaysia Compound Management Market by Application
- 7.3.5.6.3 Malaysia Compound Management Market by Sample Type
- 7.3.5.6.4 Malaysia Compound Management Market by End User
- 7.3.5.7 Rest of Asia Pacific Compound Management Market
- 7.3.5.7.1 Rest of Asia Pacific Compound Management Market by Type
- 7.3.5.7.2 Rest of Asia Pacific Compound Management Market by Application
- 7.3.5.7.3 Rest of Asia Pacific Compound Management Market by Sample Type
- 7.3.5.7.4 Rest of Asia Pacific Compound Management Market by End User
- 7.3.5.1 China Compound Management Market
- 7.3.1 Asia Pacific Compound Management Market by Type
- 7.4 LAMEA Compound Management Market
- 7.4.1 LAMEA Compound Management Market by Type
- 7.4.1.1 LAMEA Products Market by Country
- 7.4.1.2 LAMEA Compound Management Market by Products Type
- 7.4.1.2.1 LAMEA Automated Compound/Sample Storage Systems Market by Country
- 7.4.1.2.2 LAMEA Automated Liquid Handling Systems Market by Country
- 7.4.1.2.3 LAMEA Others Market by Country
- 7.4.1.3 LAMEA Services Market by Country
- 7.4.2 LAMEA Compound Management Market by Application
- 7.4.2.1 LAMEA Drug Discovery Market by Country
- 7.4.2.2 LAMEA Gene Synthesis Market by Country
- 7.4.2.3 LAMEA Bio Banking Market by Country
- 7.4.2.4 LAMEA Others Market by Country
- 7.4.3 LAMEA Compound Management Market by Sample Type
- 7.4.3.1 LAMEA Chemical Compounds Market by Country
- 7.4.3.2 LAMEA Bio Samples Market by Country
- 7.4.4 LAMEA Compound Management Market by End User
- 7.4.4.1 LAMEA Pharmaceutical Companies Market by Country
- 7.4.4.2 LAMEA Biopharmaceutical Companies Market by Country
- 7.4.4.3 LAMEA Contract Research Organizations Market by Country
- 7.4.4.4 LAMEA Others Market by Country
- 7.4.5 LAMEA Compound Management Market by Country
- 7.4.5.1 Brazil Compound Management Market
- 7.4.5.1.1 Brazil Compound Management Market by Type
- 7.4.5.1.2 Brazil Compound Management Market by Application
- 7.4.5.1.3 Brazil Compound Management Market by Sample Type
- 7.4.5.1.4 Brazil Compound Management Market by End User
- 7.4.5.2 Argentina Compound Management Market
- 7.4.5.2.1 Argentina Compound Management Market by Type
- 7.4.5.2.2 Argentina Compound Management Market by Application
- 7.4.5.2.3 Argentina Compound Management Market by Sample Type
- 7.4.5.2.4 Argentina Compound Management Market by End User
- 7.4.5.3 UAE Compound Management Market
- 7.4.5.3.1 UAE Compound Management Market by Type
- 7.4.5.3.2 UAE Compound Management Market by Application
- 7.4.5.3.3 UAE Compound Management Market by Sample Type
- 7.4.5.3.4 UAE Compound Management Market by End User
- 7.4.5.4 Saudi Arabia Compound Management Market
- 7.4.5.4.1 Saudi Arabia Compound Management Market by Type
- 7.4.5.4.2 Saudi Arabia Compound Management Market by Application
- 7.4.5.4.3 Saudi Arabia Compound Management Market by Sample Type
- 7.4.5.4.4 Saudi Arabia Compound Management Market by End User
- 7.4.5.5 South Africa Compound Management Market
- 7.4.5.5.1 South Africa Compound Management Market by Type
- 7.4.5.5.2 South Africa Compound Management Market by Application
- 7.4.5.5.3 South Africa Compound Management Market by Sample Type
- 7.4.5.5.4 South Africa Compound Management Market by End User
- 7.4.5.6 Nigeria Compound Management Market
- 7.4.5.6.1 Nigeria Compound Management Market by Type
- 7.4.5.6.2 Nigeria Compound Management Market by Application
- 7.4.5.6.3 Nigeria Compound Management Market by Sample Type
- 7.4.5.6.4 Nigeria Compound Management Market by End User
- 7.4.5.7 Rest of LAMEA Compound Management Market
- 7.4.5.7.1 Rest of LAMEA Compound Management Market by Type
- 7.4.5.7.2 Rest of LAMEA Compound Management Market by Application
- 7.4.5.7.3 Rest of LAMEA Compound Management Market by Sample Type
- 7.4.5.7.4 Rest of LAMEA Compound Management Market by End User
- 7.4.5.1 Brazil Compound Management Market
- 7.4.1 LAMEA Compound Management Market by Type
Chapter 8. Company Profiles
- 8.1 Danaher Corporation (Beckman Coulter)
- 8.1.1 Company Overview
- 8.1.2 Financial Analysis
- 8.1.3 Segmental and Regional Analysis
- 8.1.4 Research & Development Expense
- 8.2 Azenta US, Inc.
- 8.2.1 Company Overview
- 8.2.2 Financial Analysis
- 8.2.3 Segmental and Regional Analysis
- 8.2.4 Research & Development Expense
- 8.3 Hamilton Company
- 8.3.1 Company Overview
- 8.4 BioAscent
- 8.4.1 Company Overview
- 8.5 Evotec SE
- 8.5.1 Company Overview
- 8.5.1 Financial Analysis
- 8.5.2 Regional Analysis
- 8.5.3 Research & Development Expense
- 8.6 SPT Labtech Ltd.
- 8.6.1 Company Overview
- 8.7 Tecan Group Ltd.
- 8.7.1 Company Overview
- 8.8 Titian Software
- 8.8.1 Company Overview
- 8.9 LiCONiC AG
- 8.9.1 Company Overview
- 8.10. AXXAM S.p.A.
- 8.10.1 Company Overview