|
|
市場調査レポート
商品コード
1093109
ロボットビジョンの世界市場規模、シェア、産業動向分析:コンポーネント別、用途別、産業別、タイプ別、展開別、地域別の展望と予測(2022年~2028年)Global Robotic Vision Market Size, Share & Industry Trends Analysis Report By Component (Hardware and Software), By Application, By Industry, By Type, By Deployment, By Regional Outlook and Forecast, 2022 - 2028 |
||||||
|
|
|||||||


| ロボットビジョンの世界市場規模、シェア、産業動向分析:コンポーネント別、用途別、産業別、タイプ別、展開別、地域別の展望と予測(2022年~2028年) |
|
出版日: 2022年05月31日
発行: KBV Research
ページ情報: 英文 354 Pages
納期: 即納可能
|
- 全表示
- 概要
- 図表
- 目次
世界のロボットビジョンの市場規模は、2028年までに38億米ドルに達し、予測期間中にCAGR9.3%で成長すると予測されています。
当レポートでは、世界のロボットビジョン市場について調査し、市場概要、競合分析、セグメント、地域別の市場分析、主要企業のプロファイルなどの情報を提供しています。
目次
第1章 市場の範囲と調査手法
第2章 市場概要
- イントロダクション
- 市場に影響を与える主な要因
第3章 世界の競合分析
- KBVカーディナルマトリックス
- 最近の業界全体の戦略的開発
- 主な成功戦略
第4章 世界のロボットビジョン市場:コンポーネント別
- ハードウェア
- ソフトウェア
第5章 世界のロボットビジョン市場:用途別
- マテリアルハンドリング
- 包装・パレタイジング
- 組み立て・分解
- 塗装・切断・プレス・研削・バリ取り
- 溶接・はんだ付け
- 測定・検査・テスト
第6章 世界のロボットビジョン市場:業界別
- 電気・電子機器
- 金属・機械
- 精密工学・光学
- 自動車
- 医薬品・化粧品
- 食品・飲料
- 化学・ゴム・プラスチック
- その他
第7章 世界のロボットビジョン市場:タイプ別
- 2Dビジョンシステム
- 3Dビジョンシステム
第8章 世界のロボットビジョン市場:展開別
- ロボット誘導システム
- ロボットセル
第9章 世界のロボットビジョン市場:地域別
- 北米
- 欧州
- アジア太平洋
- ラテンアメリカ・中東・アフリカ
第10章 企業プロファイル
- Cognex Corporation
- ISRA Vision AG (Atlas Copco)
- Basler AG
- Omron Corporation
- National Instruments Corporation
- Teledyne Technologies, Inc. (Teledyne DALSA)
- Keyence Corporation
- FANUC Corporation
- Hexagon AB
- Sick AG
LIST OF TABLES
- TABLE 1 Global Robotic Vision Market, 2018 - 2021, USD Million
- TABLE 2 Global Robotic Vision Market, 2022 - 2028, USD Million
- TABLE 3 Partnerships, Collaborations and Agreements- Robotic Vision Market
- TABLE 4 Product Launches And Product Expansions- Robotic Vision Market
- TABLE 5 Acquisition and Mergers- Robotic Vision Market
- TABLE 6 Global Robotic Vision Market by Component, 2018 - 2021, USD Million
- TABLE 7 Global Robotic Vision Market by Component, 2022 - 2028, USD Million
- TABLE 8 Global Hardware Market by Region, 2018 - 2021, USD Million
- TABLE 9 Global Hardware Market by Region, 2022 - 2028, USD Million
- TABLE 10 Global Software Market by Region, 2018 - 2021, USD Million
- TABLE 11 Global Software Market by Region, 2022 - 2028, USD Million
- TABLE 12 Global Robotic Vision Market by Application, 2018 - 2021, USD Million
- TABLE 13 Global Robotic Vision Market by Application, 2022 - 2028, USD Million
- TABLE 14 Global Material Handling Market by Region, 2018 - 2021, USD Million
- TABLE 15 Global Material Handling Market by Region, 2022 - 2028, USD Million
- TABLE 16 Global Packaging & Palletizing Market by Region, 2018 - 2021, USD Million
- TABLE 17 Global Packaging & Palletizing Market by Region, 2022 - 2028, USD Million
- TABLE 18 Global Assembling & Disassembling Market by Region, 2018 - 2021, USD Million
- TABLE 19 Global Assembling & Disassembling Market by Region, 2022 - 2028, USD Million
- TABLE 20 Global Painting, Cutting, Pressing, Grinding, & Deburring Market by Region, 2018 - 2021, USD Million
- TABLE 21 Global Painting, Cutting, Pressing, Grinding, & Deburring Market by Region, 2022 - 2028, USD Million
- TABLE 22 Global Welding & Soldering Market by Region, 2018 - 2021, USD Million
- TABLE 23 Global Welding & Soldering Market by Region, 2022 - 2028, USD Million
- TABLE 24 Global Measurement, Inspection, & Testing Market by Region, 2018 - 2021, USD Million
- TABLE 25 Global Measurement, Inspection, & Testing Market by Region, 2022 - 2028, USD Million
- TABLE 26 Global Robotic Vision Market by Industry, 2018 - 2021, USD Million
- TABLE 27 Global Robotic Vision Market by Industry, 2022 - 2028, USD Million
- TABLE 28 Global Electrical & Electronics Market by Region, 2018 - 2021, USD Million
- TABLE 29 Global Electrical & Electronics Market by Region, 2022 - 2028, USD Million
- TABLE 30 Global Metals & Machinery Market by Region, 2018 - 2021, USD Million
- TABLE 31 Global Metals & Machinery Market by Region, 2022 - 2028, USD Million
- TABLE 32 Global Precision Engineering & Optics Market by Region, 2018 - 2021, USD Million
- TABLE 33 Global Precision Engineering & Optics Market by Region, 2022 - 2028, USD Million
- TABLE 34 Global Automotive Market by Region, 2018 - 2021, USD Million
- TABLE 35 Global Automotive Market by Region, 2022 - 2028, USD Million
- TABLE 36 Global Pharmaceuticals & Cosmetics Market by Region, 2018 - 2021, USD Million
- TABLE 37 Global Pharmaceuticals & Cosmetics Market by Region, 2022 - 2028, USD Million
- TABLE 38 Global Food & Beverages Market by Region, 2018 - 2021, USD Million
- TABLE 39 Global Food & Beverages Market by Region, 2022 - 2028, USD Million
- TABLE 40 Global Chemical, Rubber, & Plastic Market by Region, 2018 - 2021, USD Million
- TABLE 41 Global Chemical, Rubber, & Plastic Market by Region, 2022 - 2028, USD Million
- TABLE 42 Global Other Industry Market by Region, 2018 - 2021, USD Million
- TABLE 43 Global Other Industry Market by Region, 2022 - 2028, USD Million
- TABLE 44 Global Robotic Vision Market by Type, 2018 - 2021, USD Million
- TABLE 45 Global Robotic Vision Market by Type, 2022 - 2028, USD Million
- TABLE 46 Global 2D Vision Systems Market by Region, 2018 - 2021, USD Million
- TABLE 47 Global 2D Vision Systems Market by Region, 2022 - 2028, USD Million
- TABLE 48 Global 3D Vision Systems Market by Region, 2018 - 2021, USD Million
- TABLE 49 Global 3D Vision Systems Market by Region, 2022 - 2028, USD Million
- TABLE 50 Global Robotic Vision Market by Deployment, 2018 - 2021, USD Million
- TABLE 51 Global Robotic Vision Market by Deployment, 2022 - 2028, USD Million
- TABLE 52 Global Robotic Guidance Systems Market by Region, 2018 - 2021, USD Million
- TABLE 53 Global Robotic Guidance Systems Market by Region, 2022 - 2028, USD Million
- TABLE 54 Global Robotic Cells Market by Region, 2018 - 2021, USD Million
- TABLE 55 Global Robotic Cells Market by Region, 2022 - 2028, USD Million
- TABLE 56 Global Robotic Vision Market by Region, 2018 - 2021, USD Million
- TABLE 57 Global Robotic Vision Market by Region, 2022 - 2028, USD Million
- TABLE 58 North America Robotic Vision Market, 2018 - 2021, USD Million
- TABLE 59 North America Robotic Vision Market, 2022 - 2028, USD Million
- TABLE 60 North America Robotic Vision Market by Component, 2018 - 2021, USD Million
- TABLE 61 North America Robotic Vision Market by Component, 2022 - 2028, USD Million
- TABLE 62 North America Hardware Market by Country, 2018 - 2021, USD Million
- TABLE 63 North America Hardware Market by Country, 2022 - 2028, USD Million
- TABLE 64 North America Software Market by Country, 2018 - 2021, USD Million
- TABLE 65 North America Software Market by Country, 2022 - 2028, USD Million
- TABLE 66 North America Robotic Vision Market by Application, 2018 - 2021, USD Million
- TABLE 67 North America Robotic Vision Market by Application, 2022 - 2028, USD Million
- TABLE 68 North America Material Handling Market by Country, 2018 - 2021, USD Million
- TABLE 69 North America Material Handling Market by Country, 2022 - 2028, USD Million
- TABLE 70 North America Packaging & Palletizing Market by Country, 2018 - 2021, USD Million
- TABLE 71 North America Packaging & Palletizing Market by Country, 2022 - 2028, USD Million
- TABLE 72 North America Assembling & Disassembling Market by Country, 2018 - 2021, USD Million
- TABLE 73 North America Assembling & Disassembling Market by Country, 2022 - 2028, USD Million
- TABLE 74 North America Painting, Cutting, Pressing, Grinding, & Deburring Market by Country, 2018 - 2021, USD Million
- TABLE 75 North America Painting, Cutting, Pressing, Grinding, & Deburring Market by Country, 2022 - 2028, USD Million
- TABLE 76 North America Welding & Soldering Market by Country, 2018 - 2021, USD Million
- TABLE 77 North America Welding & Soldering Market by Country, 2022 - 2028, USD Million
- TABLE 78 North America Measurement, Inspection, & Testing Market by Country, 2018 - 2021, USD Million
- TABLE 79 North America Measurement, Inspection, & Testing Market by Country, 2022 - 2028, USD Million
- TABLE 80 North America Robotic Vision Market by Industry, 2018 - 2021, USD Million
- TABLE 81 North America Robotic Vision Market by Industry, 2022 - 2028, USD Million
- TABLE 82 North America Electrical & Electronics Market by Country, 2018 - 2021, USD Million
- TABLE 83 North America Electrical & Electronics Market by Country, 2022 - 2028, USD Million
- TABLE 84 North America Metals & Machinery Market by Country, 2018 - 2021, USD Million
- TABLE 85 North America Metals & Machinery Market by Country, 2022 - 2028, USD Million
- TABLE 86 North America Precision Engineering & Optics Market by Country, 2018 - 2021, USD Million
- TABLE 87 North America Precision Engineering & Optics Market by Country, 2022 - 2028, USD Million
- TABLE 88 North America Automotive Market by Country, 2018 - 2021, USD Million
- TABLE 89 North America Automotive Market by Country, 2022 - 2028, USD Million
- TABLE 90 North America Pharmaceuticals & Cosmetics Market by Country, 2018 - 2021, USD Million
- TABLE 91 North America Pharmaceuticals & Cosmetics Market by Country, 2022 - 2028, USD Million
- TABLE 92 North America Food & Beverages Market by Country, 2018 - 2021, USD Million
- TABLE 93 North America Food & Beverages Market by Country, 2022 - 2028, USD Million
- TABLE 94 North America Chemical, Rubber, & Plastic Market by Country, 2018 - 2021, USD Million
- TABLE 95 North America Chemical, Rubber, & Plastic Market by Country, 2022 - 2028, USD Million
- TABLE 96 North America Other Industry Market by Country, 2018 - 2021, USD Million
- TABLE 97 North America Other Industry Market by Country, 2022 - 2028, USD Million
- TABLE 98 North America Robotic Vision Market by Type, 2018 - 2021, USD Million
- TABLE 99 North America Robotic Vision Market by Type, 2022 - 2028, USD Million
- TABLE 100 North America 2D Vision Systems Market by Country, 2018 - 2021, USD Million
- TABLE 101 North America 2D Vision Systems Market by Country, 2022 - 2028, USD Million
- TABLE 102 North America 3D Vision Systems Market by Country, 2018 - 2021, USD Million
- TABLE 103 North America 3D Vision Systems Market by Country, 2022 - 2028, USD Million
- TABLE 104 North America Robotic Vision Market by Deployment, 2018 - 2021, USD Million
- TABLE 105 North America Robotic Vision Market by Deployment, 2022 - 2028, USD Million
- TABLE 106 North America Robotic Guidance Systems Market by Country, 2018 - 2021, USD Million
- TABLE 107 North America Robotic Guidance Systems Market by Country, 2022 - 2028, USD Million
- TABLE 108 North America Robotic Cells Market by Country, 2018 - 2021, USD Million
- TABLE 109 North America Robotic Cells Market by Country, 2022 - 2028, USD Million
- TABLE 110 North America Robotic Vision Market by Country, 2018 - 2021, USD Million
- TABLE 111 North America Robotic Vision Market by Country, 2022 - 2028, USD Million
- TABLE 112 US Robotic Vision Market, 2018 - 2021, USD Million
- TABLE 113 US Robotic Vision Market, 2022 - 2028, USD Million
- TABLE 114 US Robotic Vision Market by Component, 2018 - 2021, USD Million
- TABLE 115 US Robotic Vision Market by Component, 2022 - 2028, USD Million
- TABLE 116 US Robotic Vision Market by Application, 2018 - 2021, USD Million
- TABLE 117 US Robotic Vision Market by Application, 2022 - 2028, USD Million
- TABLE 118 US Robotic Vision Market by Industry, 2018 - 2021, USD Million
- TABLE 119 US Robotic Vision Market by Industry, 2022 - 2028, USD Million
- TABLE 120 US Robotic Vision Market by Type, 2018 - 2021, USD Million
- TABLE 121 US Robotic Vision Market by Type, 2022 - 2028, USD Million
- TABLE 122 US Robotic Vision Market by Deployment, 2018 - 2021, USD Million
- TABLE 123 US Robotic Vision Market by Deployment, 2022 - 2028, USD Million
- TABLE 124 Canada Robotic Vision Market, 2018 - 2021, USD Million
- TABLE 125 Canada Robotic Vision Market, 2022 - 2028, USD Million
- TABLE 126 Canada Robotic Vision Market by Component, 2018 - 2021, USD Million
- TABLE 127 Canada Robotic Vision Market by Component, 2022 - 2028, USD Million
- TABLE 128 Canada Robotic Vision Market by Application, 2018 - 2021, USD Million
- TABLE 129 Canada Robotic Vision Market by Application, 2022 - 2028, USD Million
- TABLE 130 Canada Robotic Vision Market by Industry, 2018 - 2021, USD Million
- TABLE 131 Canada Robotic Vision Market by Industry, 2022 - 2028, USD Million
- TABLE 132 Canada Robotic Vision Market by Type, 2018 - 2021, USD Million
- TABLE 133 Canada Robotic Vision Market by Type, 2022 - 2028, USD Million
- TABLE 134 Canada Robotic Vision Market by Deployment, 2018 - 2021, USD Million
- TABLE 135 Canada Robotic Vision Market by Deployment, 2022 - 2028, USD Million
- TABLE 136 Mexico Robotic Vision Market, 2018 - 2021, USD Million
- TABLE 137 Mexico Robotic Vision Market, 2022 - 2028, USD Million
- TABLE 138 Mexico Robotic Vision Market by Component, 2018 - 2021, USD Million
- TABLE 139 Mexico Robotic Vision Market by Component, 2022 - 2028, USD Million
- TABLE 140 Mexico Robotic Vision Market by Application, 2018 - 2021, USD Million
- TABLE 141 Mexico Robotic Vision Market by Application, 2022 - 2028, USD Million
- TABLE 142 Mexico Robotic Vision Market by Industry, 2018 - 2021, USD Million
- TABLE 143 Mexico Robotic Vision Market by Industry, 2022 - 2028, USD Million
- TABLE 144 Mexico Robotic Vision Market by Type, 2018 - 2021, USD Million
- TABLE 145 Mexico Robotic Vision Market by Type, 2022 - 2028, USD Million
- TABLE 146 Mexico Robotic Vision Market by Deployment, 2018 - 2021, USD Million
- TABLE 147 Mexico Robotic Vision Market by Deployment, 2022 - 2028, USD Million
- TABLE 148 Rest of North America Robotic Vision Market, 2018 - 2021, USD Million
- TABLE 149 Rest of North America Robotic Vision Market, 2022 - 2028, USD Million
- TABLE 150 Rest of North America Robotic Vision Market by Component, 2018 - 2021, USD Million
- TABLE 151 Rest of North America Robotic Vision Market by Component, 2022 - 2028, USD Million
- TABLE 152 Rest of North America Robotic Vision Market by Application, 2018 - 2021, USD Million
- TABLE 153 Rest of North America Robotic Vision Market by Application, 2022 - 2028, USD Million
- TABLE 154 Rest of North America Robotic Vision Market by Industry, 2018 - 2021, USD Million
- TABLE 155 Rest of North America Robotic Vision Market by Industry, 2022 - 2028, USD Million
- TABLE 156 Rest of North America Robotic Vision Market by Type, 2018 - 2021, USD Million
- TABLE 157 Rest of North America Robotic Vision Market by Type, 2022 - 2028, USD Million
- TABLE 158 Rest of North America Robotic Vision Market by Deployment, 2018 - 2021, USD Million
- TABLE 159 Rest of North America Robotic Vision Market by Deployment, 2022 - 2028, USD Million
- TABLE 160 Europe Robotic Vision Market, 2018 - 2021, USD Million
- TABLE 161 Europe Robotic Vision Market, 2022 - 2028, USD Million
- TABLE 162 Europe Robotic Vision Market by Component, 2018 - 2021, USD Million
- TABLE 163 Europe Robotic Vision Market by Component, 2022 - 2028, USD Million
- TABLE 164 Europe Hardware Market by Country, 2018 - 2021, USD Million
- TABLE 165 Europe Hardware Market by Country, 2022 - 2028, USD Million
- TABLE 166 Europe Software Market by Country, 2018 - 2021, USD Million
- TABLE 167 Europe Software Market by Country, 2022 - 2028, USD Million
- TABLE 168 Europe Robotic Vision Market by Application, 2018 - 2021, USD Million
- TABLE 169 Europe Robotic Vision Market by Application, 2022 - 2028, USD Million
- TABLE 170 Europe Material Handling Market by Country, 2018 - 2021, USD Million
- TABLE 171 Europe Material Handling Market by Country, 2022 - 2028, USD Million
- TABLE 172 Europe Packaging & Palletizing Market by Country, 2018 - 2021, USD Million
- TABLE 173 Europe Packaging & Palletizing Market by Country, 2022 - 2028, USD Million
- TABLE 174 Europe Assembling & Disassembling Market by Country, 2018 - 2021, USD Million
- TABLE 175 Europe Assembling & Disassembling Market by Country, 2022 - 2028, USD Million
- TABLE 176 Europe Painting, Cutting, Pressing, Grinding, & Deburring Market by Country, 2018 - 2021, USD Million
- TABLE 177 Europe Painting, Cutting, Pressing, Grinding, & Deburring Market by Country, 2022 - 2028, USD Million
- TABLE 178 Europe Welding & Soldering Market by Country, 2018 - 2021, USD Million
- TABLE 179 Europe Welding & Soldering Market by Country, 2022 - 2028, USD Million
- TABLE 180 Europe Measurement, Inspection, & Testing Market by Country, 2018 - 2021, USD Million
- TABLE 181 Europe Measurement, Inspection, & Testing Market by Country, 2022 - 2028, USD Million
- TABLE 182 Europe Robotic Vision Market by Industry, 2018 - 2021, USD Million
- TABLE 183 Europe Robotic Vision Market by Industry, 2022 - 2028, USD Million
- TABLE 184 Europe Electrical & Electronics Market by Country, 2018 - 2021, USD Million
- TABLE 185 Europe Electrical & Electronics Market by Country, 2022 - 2028, USD Million
- TABLE 186 Europe Metals & Machinery Market by Country, 2018 - 2021, USD Million
- TABLE 187 Europe Metals & Machinery Market by Country, 2022 - 2028, USD Million
- TABLE 188 Europe Precision Engineering & Optics Market by Country, 2018 - 2021, USD Million
- TABLE 189 Europe Precision Engineering & Optics Market by Country, 2022 - 2028, USD Million
- TABLE 190 Europe Automotive Market by Country, 2018 - 2021, USD Million
- TABLE 191 Europe Automotive Market by Country, 2022 - 2028, USD Million
- TABLE 192 Europe Pharmaceuticals & Cosmetics Market by Country, 2018 - 2021, USD Million
- TABLE 193 Europe Pharmaceuticals & Cosmetics Market by Country, 2022 - 2028, USD Million
- TABLE 194 Europe Food & Beverages Market by Country, 2018 - 2021, USD Million
- TABLE 195 Europe Food & Beverages Market by Country, 2022 - 2028, USD Million
- TABLE 196 Europe Chemical, Rubber, & Plastic Market by Country, 2018 - 2021, USD Million
- TABLE 197 Europe Chemical, Rubber, & Plastic Market by Country, 2022 - 2028, USD Million
- TABLE 198 Europe Other Industry Market by Country, 2018 - 2021, USD Million
- TABLE 199 Europe Other Industry Market by Country, 2022 - 2028, USD Million
- TABLE 200 Europe Robotic Vision Market by Type, 2018 - 2021, USD Million
- TABLE 201 Europe Robotic Vision Market by Type, 2022 - 2028, USD Million
- TABLE 202 Europe 2D Vision Systems Market by Country, 2018 - 2021, USD Million
- TABLE 203 Europe 2D Vision Systems Market by Country, 2022 - 2028, USD Million
- TABLE 204 Europe 3D Vision Systems Market by Country, 2018 - 2021, USD Million
- TABLE 205 Europe 3D Vision Systems Market by Country, 2022 - 2028, USD Million
- TABLE 206 Europe Robotic Vision Market by Deployment, 2018 - 2021, USD Million
- TABLE 207 Europe Robotic Vision Market by Deployment, 2022 - 2028, USD Million
- TABLE 208 Europe Robotic Guidance Systems Market by Country, 2018 - 2021, USD Million
- TABLE 209 Europe Robotic Guidance Systems Market by Country, 2022 - 2028, USD Million
- TABLE 210 Europe Robotic Cells Market by Country, 2018 - 2021, USD Million
- TABLE 211 Europe Robotic Cells Market by Country, 2022 - 2028, USD Million
- TABLE 212 Europe Robotic Vision Market by Country, 2018 - 2021, USD Million
- TABLE 213 Europe Robotic Vision Market by Country, 2022 - 2028, USD Million
- TABLE 214 Germany Robotic Vision Market, 2018 - 2021, USD Million
- TABLE 215 Germany Robotic Vision Market, 2022 - 2028, USD Million
- TABLE 216 Germany Robotic Vision Market by Component, 2018 - 2021, USD Million
- TABLE 217 Germany Robotic Vision Market by Component, 2022 - 2028, USD Million
- TABLE 218 Germany Robotic Vision Market by Application, 2018 - 2021, USD Million
- TABLE 219 Germany Robotic Vision Market by Application, 2022 - 2028, USD Million
- TABLE 220 Germany Robotic Vision Market by Industry, 2018 - 2021, USD Million
- TABLE 221 Germany Robotic Vision Market by Industry, 2022 - 2028, USD Million
- TABLE 222 Germany Robotic Vision Market by Type, 2018 - 2021, USD Million
- TABLE 223 Germany Robotic Vision Market by Type, 2022 - 2028, USD Million
- TABLE 224 Germany Robotic Vision Market by Deployment, 2018 - 2021, USD Million
- TABLE 225 Germany Robotic Vision Market by Deployment, 2022 - 2028, USD Million
- TABLE 226 UK Robotic Vision Market, 2018 - 2021, USD Million
- TABLE 227 UK Robotic Vision Market, 2022 - 2028, USD Million
- TABLE 228 UK Robotic Vision Market by Component, 2018 - 2021, USD Million
- TABLE 229 UK Robotic Vision Market by Component, 2022 - 2028, USD Million
- TABLE 230 UK Robotic Vision Market by Application, 2018 - 2021, USD Million
- TABLE 231 UK Robotic Vision Market by Application, 2022 - 2028, USD Million
- TABLE 232 UK Robotic Vision Market by Industry, 2018 - 2021, USD Million
- TABLE 233 UK Robotic Vision Market by Industry, 2022 - 2028, USD Million
- TABLE 234 UK Robotic Vision Market by Type, 2018 - 2021, USD Million
- TABLE 235 UK Robotic Vision Market by Type, 2022 - 2028, USD Million
- TABLE 236 UK Robotic Vision Market by Deployment, 2018 - 2021, USD Million
- TABLE 237 UK Robotic Vision Market by Deployment, 2022 - 2028, USD Million
- TABLE 238 France Robotic Vision Market, 2018 - 2021, USD Million
- TABLE 239 France Robotic Vision Market, 2022 - 2028, USD Million
- TABLE 240 France Robotic Vision Market by Component, 2018 - 2021, USD Million
- TABLE 241 France Robotic Vision Market by Component, 2022 - 2028, USD Million
- TABLE 242 France Robotic Vision Market by Application, 2018 - 2021, USD Million
- TABLE 243 France Robotic Vision Market by Application, 2022 - 2028, USD Million
- TABLE 244 France Robotic Vision Market by Industry, 2018 - 2021, USD Million
- TABLE 245 France Robotic Vision Market by Industry, 2022 - 2028, USD Million
- TABLE 246 France Robotic Vision Market by Type, 2018 - 2021, USD Million
- TABLE 247 France Robotic Vision Market by Type, 2022 - 2028, USD Million
- TABLE 248 France Robotic Vision Market by Deployment, 2018 - 2021, USD Million
- TABLE 249 France Robotic Vision Market by Deployment, 2022 - 2028, USD Million
- TABLE 250 Russia Robotic Vision Market, 2018 - 2021, USD Million
- TABLE 251 Russia Robotic Vision Market, 2022 - 2028, USD Million
- TABLE 252 Russia Robotic Vision Market by Component, 2018 - 2021, USD Million
- TABLE 253 Russia Robotic Vision Market by Component, 2022 - 2028, USD Million
- TABLE 254 Russia Robotic Vision Market by Application, 2018 - 2021, USD Million
- TABLE 255 Russia Robotic Vision Market by Application, 2022 - 2028, USD Million
- TABLE 256 Russia Robotic Vision Market by Industry, 2018 - 2021, USD Million
- TABLE 257 Russia Robotic Vision Market by Industry, 2022 - 2028, USD Million
- TABLE 258 Russia Robotic Vision Market by Type, 2018 - 2021, USD Million
- TABLE 259 Russia Robotic Vision Market by Type, 2022 - 2028, USD Million
- TABLE 260 Russia Robotic Vision Market by Deployment, 2018 - 2021, USD Million
- TABLE 261 Russia Robotic Vision Market by Deployment, 2022 - 2028, USD Million
- TABLE 262 Spain Robotic Vision Market, 2018 - 2021, USD Million
- TABLE 263 Spain Robotic Vision Market, 2022 - 2028, USD Million
- TABLE 264 Spain Robotic Vision Market by Component, 2018 - 2021, USD Million
- TABLE 265 Spain Robotic Vision Market by Component, 2022 - 2028, USD Million
- TABLE 266 Spain Robotic Vision Market by Application, 2018 - 2021, USD Million
- TABLE 267 Spain Robotic Vision Market by Application, 2022 - 2028, USD Million
- TABLE 268 Spain Robotic Vision Market by Industry, 2018 - 2021, USD Million
- TABLE 269 Spain Robotic Vision Market by Industry, 2022 - 2028, USD Million
- TABLE 270 Spain Robotic Vision Market by Type, 2018 - 2021, USD Million
- TABLE 271 Spain Robotic Vision Market by Type, 2022 - 2028, USD Million
- TABLE 272 Spain Robotic Vision Market by Deployment, 2018 - 2021, USD Million
- TABLE 273 Spain Robotic Vision Market by Deployment, 2022 - 2028, USD Million
- TABLE 274 Italy Robotic Vision Market, 2018 - 2021, USD Million
- TABLE 275 Italy Robotic Vision Market, 2022 - 2028, USD Million
- TABLE 276 Italy Robotic Vision Market by Component, 2018 - 2021, USD Million
- TABLE 277 Italy Robotic Vision Market by Component, 2022 - 2028, USD Million
- TABLE 278 Italy Robotic Vision Market by Application, 2018 - 2021, USD Million
- TABLE 279 Italy Robotic Vision Market by Application, 2022 - 2028, USD Million
- TABLE 280 Italy Robotic Vision Market by Industry, 2018 - 2021, USD Million
- TABLE 281 Italy Robotic Vision Market by Industry, 2022 - 2028, USD Million
- TABLE 282 Italy Robotic Vision Market by Type, 2018 - 2021, USD Million
- TABLE 283 Italy Robotic Vision Market by Type, 2022 - 2028, USD Million
- TABLE 284 Italy Robotic Vision Market by Deployment, 2018 - 2021, USD Million
- TABLE 285 Italy Robotic Vision Market by Deployment, 2022 - 2028, USD Million
- TABLE 286 Rest of Europe Robotic Vision Market, 2018 - 2021, USD Million
- TABLE 287 Rest of Europe Robotic Vision Market, 2022 - 2028, USD Million
- TABLE 288 Rest of Europe Robotic Vision Market by Component, 2018 - 2021, USD Million
- TABLE 289 Rest of Europe Robotic Vision Market by Component, 2022 - 2028, USD Million
- TABLE 290 Rest of Europe Robotic Vision Market by Application, 2018 - 2021, USD Million
- TABLE 291 Rest of Europe Robotic Vision Market by Application, 2022 - 2028, USD Million
- TABLE 292 Rest of Europe Robotic Vision Market by Industry, 2018 - 2021, USD Million
- TABLE 293 Rest of Europe Robotic Vision Market by Industry, 2022 - 2028, USD Million
- TABLE 294 Rest of Europe Robotic Vision Market by Type, 2018 - 2021, USD Million
- TABLE 295 Rest of Europe Robotic Vision Market by Type, 2022 - 2028, USD Million
- TABLE 296 Rest of Europe Robotic Vision Market by Deployment, 2018 - 2021, USD Million
- TABLE 297 Rest of Europe Robotic Vision Market by Deployment, 2022 - 2028, USD Million
- TABLE 298 Asia Pacific Robotic Vision Market, 2018 - 2021, USD Million
- TABLE 299 Asia Pacific Robotic Vision Market, 2022 - 2028, USD Million
- TABLE 300 Asia Pacific Robotic Vision Market by Component, 2018 - 2021, USD Million
- TABLE 301 Asia Pacific Robotic Vision Market by Component, 2022 - 2028, USD Million
- TABLE 302 Asia Pacific Hardware Market by Country, 2018 - 2021, USD Million
- TABLE 303 Asia Pacific Hardware Market by Country, 2022 - 2028, USD Million
- TABLE 304 Asia Pacific Software Market by Country, 2018 - 2021, USD Million
- TABLE 305 Asia Pacific Software Market by Country, 2022 - 2028, USD Million
- TABLE 306 Asia Pacific Robotic Vision Market by Application, 2018 - 2021, USD Million
- TABLE 307 Asia Pacific Robotic Vision Market by Application, 2022 - 2028, USD Million
- TABLE 308 Asia Pacific Material Handling Market by Country, 2018 - 2021, USD Million
- TABLE 309 Asia Pacific Material Handling Market by Country, 2022 - 2028, USD Million
- TABLE 310 Asia Pacific Packaging & Palletizing Market by Country, 2018 - 2021, USD Million
- TABLE 311 Asia Pacific Packaging & Palletizing Market by Country, 2022 - 2028, USD Million
- TABLE 312 Asia Pacific Assembling & Disassembling Market by Country, 2018 - 2021, USD Million
- TABLE 313 Asia Pacific Assembling & Disassembling Market by Country, 2022 - 2028, USD Million
- TABLE 314 Asia Pacific Painting, Cutting, Pressing, Grinding, & Deburring Market by Country, 2018 - 2021, USD Million
- TABLE 315 Asia Pacific Painting, Cutting, Pressing, Grinding, & Deburring Market by Country, 2022 - 2028, USD Million
- TABLE 316 Asia Pacific Welding & Soldering Market by Country, 2018 - 2021, USD Million
- TABLE 317 Asia Pacific Welding & Soldering Market by Country, 2022 - 2028, USD Million
- TABLE 318 Asia Pacific Measurement, Inspection, & Testing Market by Country, 2018 - 2021, USD Million
- TABLE 319 Asia Pacific Measurement, Inspection, & Testing Market by Country, 2022 - 2028, USD Million
- TABLE 320 Asia Pacific Robotic Vision Market by Industry, 2018 - 2021, USD Million
- TABLE 321 Asia Pacific Robotic Vision Market by Industry, 2022 - 2028, USD Million
- TABLE 322 Asia Pacific Electrical & Electronics Market by Country, 2018 - 2021, USD Million
- TABLE 323 Asia Pacific Electrical & Electronics Market by Country, 2022 - 2028, USD Million
- TABLE 324 Asia Pacific Metals & Machinery Market by Country, 2018 - 2021, USD Million
- TABLE 325 Asia Pacific Metals & Machinery Market by Country, 2022 - 2028, USD Million
- TABLE 326 Asia Pacific Precision Engineering & Optics Market by Country, 2018 - 2021, USD Million
- TABLE 327 Asia Pacific Precision Engineering & Optics Market by Country, 2022 - 2028, USD Million
- TABLE 328 Asia Pacific Automotive Market by Country, 2018 - 2021, USD Million
- TABLE 329 Asia Pacific Automotive Market by Country, 2022 - 2028, USD Million
- TABLE 330 Asia Pacific Pharmaceuticals & Cosmetics Market by Country, 2018 - 2021, USD Million
- TABLE 331 Asia Pacific Pharmaceuticals & Cosmetics Market by Country, 2022 - 2028, USD Million
- TABLE 332 Asia Pacific Food & Beverages Market by Country, 2018 - 2021, USD Million
- TABLE 333 Asia Pacific Food & Beverages Market by Country, 2022 - 2028, USD Million
- TABLE 334 Asia Pacific Chemical, Rubber, & Plastic Market by Country, 2018 - 2021, USD Million
- TABLE 335 Asia Pacific Chemical, Rubber, & Plastic Market by Country, 2022 - 2028, USD Million
- TABLE 336 Asia Pacific Other Industry Market by Country, 2018 - 2021, USD Million
- TABLE 337 Asia Pacific Other Industry Market by Country, 2022 - 2028, USD Million
- TABLE 338 Asia Pacific Robotic Vision Market by Type, 2018 - 2021, USD Million
- TABLE 339 Asia Pacific Robotic Vision Market by Type, 2022 - 2028, USD Million
- TABLE 340 Asia Pacific 2D Vision Systems Market by Country, 2018 - 2021, USD Million
- TABLE 341 Asia Pacific 2D Vision Systems Market by Country, 2022 - 2028, USD Million
- TABLE 342 Asia Pacific 3D Vision Systems Market by Country, 2018 - 2021, USD Million
- TABLE 343 Asia Pacific 3D Vision Systems Market by Country, 2022 - 2028, USD Million
- TABLE 344 Asia Pacific Robotic Vision Market by Deployment, 2018 - 2021, USD Million
- TABLE 345 Asia Pacific Robotic Vision Market by Deployment, 2022 - 2028, USD Million
- TABLE 346 Asia Pacific Robotic Guidance Systems Market by Country, 2018 - 2021, USD Million
- TABLE 347 Asia Pacific Robotic Guidance Systems Market by Country, 2022 - 2028, USD Million
- TABLE 348 Asia Pacific Robotic Cells Market by Country, 2018 - 2021, USD Million
- TABLE 349 Asia Pacific Robotic Cells Market by Country, 2022 - 2028, USD Million
- TABLE 350 Asia Pacific Robotic Vision Market by Country, 2018 - 2021, USD Million
- TABLE 351 Asia Pacific Robotic Vision Market by Country, 2022 - 2028, USD Million
- TABLE 352 China Robotic Vision Market, 2018 - 2021, USD Million
- TABLE 353 China Robotic Vision Market, 2022 - 2028, USD Million
- TABLE 354 China Robotic Vision Market by Component, 2018 - 2021, USD Million
- TABLE 355 China Robotic Vision Market by Component, 2022 - 2028, USD Million
- TABLE 356 China Robotic Vision Market by Application, 2018 - 2021, USD Million
- TABLE 357 China Robotic Vision Market by Application, 2022 - 2028, USD Million
- TABLE 358 China Robotic Vision Market by Industry, 2018 - 2021, USD Million
- TABLE 359 China Robotic Vision Market by Industry, 2022 - 2028, USD Million
- TABLE 360 China Robotic Vision Market by Type, 2018 - 2021, USD Million
- TABLE 361 China Robotic Vision Market by Type, 2022 - 2028, USD Million
- TABLE 362 China Robotic Vision Market by Deployment, 2018 - 2021, USD Million
- TABLE 363 China Robotic Vision Market by Deployment, 2022 - 2028, USD Million
- TABLE 364 Japan Robotic Vision Market, 2018 - 2021, USD Million
- TABLE 365 Japan Robotic Vision Market, 2022 - 2028, USD Million
- TABLE 366 Japan Robotic Vision Market by Component, 2018 - 2021, USD Million
- TABLE 367 Japan Robotic Vision Market by Component, 2022 - 2028, USD Million
- TABLE 368 Japan Robotic Vision Market by Application, 2018 - 2021, USD Million
- TABLE 369 Japan Robotic Vision Market by Application, 2022 - 2028, USD Million
- TABLE 370 Japan Robotic Vision Market by Industry, 2018 - 2021, USD Million
- TABLE 371 Japan Robotic Vision Market by Industry, 2022 - 2028, USD Million
- TABLE 372 Japan Robotic Vision Market by Type, 2018 - 2021, USD Million
- TABLE 373 Japan Robotic Vision Market by Type, 2022 - 2028, USD Million
- TABLE 374 Japan Robotic Vision Market by Deployment, 2018 - 2021, USD Million
- TABLE 375 Japan Robotic Vision Market by Deployment, 2022 - 2028, USD Million
- TABLE 376 India Robotic Vision Market, 2018 - 2021, USD Million
- TABLE 377 India Robotic Vision Market, 2022 - 2028, USD Million
- TABLE 378 India Robotic Vision Market by Component, 2018 - 2021, USD Million
- TABLE 379 India Robotic Vision Market by Component, 2022 - 2028, USD Million
- TABLE 380 India Robotic Vision Market by Application, 2018 - 2021, USD Million
- TABLE 381 India Robotic Vision Market by Application, 2022 - 2028, USD Million
- TABLE 382 India Robotic Vision Market by Industry, 2018 - 2021, USD Million
- TABLE 383 India Robotic Vision Market by Industry, 2022 - 2028, USD Million
- TABLE 384 India Robotic Vision Market by Type, 2018 - 2021, USD Million
- TABLE 385 India Robotic Vision Market by Type, 2022 - 2028, USD Million
- TABLE 386 India Robotic Vision Market by Deployment, 2018 - 2021, USD Million
- TABLE 387 India Robotic Vision Market by Deployment, 2022 - 2028, USD Million
- TABLE 388 South Korea Robotic Vision Market, 2018 - 2021, USD Million
- TABLE 389 South Korea Robotic Vision Market, 2022 - 2028, USD Million
- TABLE 390 South Korea Robotic Vision Market by Component, 2018 - 2021, USD Million
- TABLE 391 South Korea Robotic Vision Market by Component, 2022 - 2028, USD Million
- TABLE 392 South Korea Robotic Vision Market by Application, 2018 - 2021, USD Million
- TABLE 393 South Korea Robotic Vision Market by Application, 2022 - 2028, USD Million
- TABLE 394 South Korea Robotic Vision Market by Industry, 2018 - 2021, USD Million
- TABLE 395 South Korea Robotic Vision Market by Industry, 2022 - 2028, USD Million
- TABLE 396 South Korea Robotic Vision Market by Type, 2018 - 2021, USD Million
- TABLE 397 South Korea Robotic Vision Market by Type, 2022 - 2028, USD Million
- TABLE 398 South Korea Robotic Vision Market by Deployment, 2018 - 2021, USD Million
- TABLE 399 South Korea Robotic Vision Market by Deployment, 2022 - 2028, USD Million
- TABLE 400 Singapore Robotic Vision Market, 2018 - 2021, USD Million
- TABLE 401 Singapore Robotic Vision Market, 2022 - 2028, USD Million
- TABLE 402 Singapore Robotic Vision Market by Component, 2018 - 2021, USD Million
- TABLE 403 Singapore Robotic Vision Market by Component, 2022 - 2028, USD Million
- TABLE 404 Singapore Robotic Vision Market by Application, 2018 - 2021, USD Million
- TABLE 405 Singapore Robotic Vision Market by Application, 2022 - 2028, USD Million
- TABLE 406 Singapore Robotic Vision Market by Industry, 2018 - 2021, USD Million
- TABLE 407 Singapore Robotic Vision Market by Industry, 2022 - 2028, USD Million
- TABLE 408 Singapore Robotic Vision Market by Type, 2018 - 2021, USD Million
- TABLE 409 Singapore Robotic Vision Market by Type, 2022 - 2028, USD Million
- TABLE 410 Singapore Robotic Vision Market by Deployment, 2018 - 2021, USD Million
- TABLE 411 Singapore Robotic Vision Market by Deployment, 2022 - 2028, USD Million
- TABLE 412 Malaysia Robotic Vision Market, 2018 - 2021, USD Million
- TABLE 413 Malaysia Robotic Vision Market, 2022 - 2028, USD Million
- TABLE 414 Malaysia Robotic Vision Market by Component, 2018 - 2021, USD Million
- TABLE 415 Malaysia Robotic Vision Market by Component, 2022 - 2028, USD Million
- TABLE 416 Malaysia Robotic Vision Market by Application, 2018 - 2021, USD Million
- TABLE 417 Malaysia Robotic Vision Market by Application, 2022 - 2028, USD Million
- TABLE 418 Malaysia Robotic Vision Market by Industry, 2018 - 2021, USD Million
- TABLE 419 Malaysia Robotic Vision Market by Industry, 2022 - 2028, USD Million
- TABLE 420 Malaysia Robotic Vision Market by Type, 2018 - 2021, USD Million
- TABLE 421 Malaysia Robotic Vision Market by Type, 2022 - 2028, USD Million
- TABLE 422 Malaysia Robotic Vision Market by Deployment, 2018 - 2021, USD Million
- TABLE 423 Malaysia Robotic Vision Market by Deployment, 2022 - 2028, USD Million
- TABLE 424 Rest of Asia Pacific Robotic Vision Market, 2018 - 2021, USD Million
- TABLE 425 Rest of Asia Pacific Robotic Vision Market, 2022 - 2028, USD Million
- TABLE 426 Rest of Asia Pacific Robotic Vision Market by Component, 2018 - 2021, USD Million
- TABLE 427 Rest of Asia Pacific Robotic Vision Market by Component, 2022 - 2028, USD Million
- TABLE 428 Rest of Asia Pacific Robotic Vision Market by Application, 2018 - 2021, USD Million
- TABLE 429 Rest of Asia Pacific Robotic Vision Market by Application, 2022 - 2028, USD Million
- TABLE 430 Rest of Asia Pacific Robotic Vision Market by Industry, 2018 - 2021, USD Million
- TABLE 431 Rest of Asia Pacific Robotic Vision Market by Industry, 2022 - 2028, USD Million
- TABLE 432 Rest of Asia Pacific Robotic Vision Market by Type, 2018 - 2021, USD Million
- TABLE 433 Rest of Asia Pacific Robotic Vision Market by Type, 2022 - 2028, USD Million
- TABLE 434 Rest of Asia Pacific Robotic Vision Market by Deployment, 2018 - 2021, USD Million
- TABLE 435 Rest of Asia Pacific Robotic Vision Market by Deployment, 2022 - 2028, USD Million
- TABLE 436 LAMEA Robotic Vision Market, 2018 - 2021, USD Million
- TABLE 437 LAMEA Robotic Vision Market, 2022 - 2028, USD Million
- TABLE 438 LAMEA Robotic Vision Market by Component, 2018 - 2021, USD Million
- TABLE 439 LAMEA Robotic Vision Market by Component, 2022 - 2028, USD Million
- TABLE 440 LAMEA Hardware Market by Country, 2018 - 2021, USD Million
- TABLE 441 LAMEA Hardware Market by Country, 2022 - 2028, USD Million
- TABLE 442 LAMEA Software Market by Country, 2018 - 2021, USD Million
- TABLE 443 LAMEA Software Market by Country, 2022 - 2028, USD Million
- TABLE 444 LAMEA Robotic Vision Market by Application, 2018 - 2021, USD Million
- TABLE 445 LAMEA Robotic Vision Market by Application, 2022 - 2028, USD Million
- TABLE 446 LAMEA Material Handling Market by Country, 2018 - 2021, USD Million
- TABLE 447 LAMEA Material Handling Market by Country, 2022 - 2028, USD Million
- TABLE 448 LAMEA Packaging & Palletizing Market by Country, 2018 - 2021, USD Million
- TABLE 449 LAMEA Packaging & Palletizing Market by Country, 2022 - 2028, USD Million
- TABLE 450 LAMEA Assembling & Disassembling Market by Country, 2018 - 2021, USD Million
- TABLE 451 LAMEA Assembling & Disassembling Market by Country, 2022 - 2028, USD Million
- TABLE 452 LAMEA Painting, Cutting, Pressing, Grinding, & Deburring Market by Country, 2018 - 2021, USD Million
- TABLE 453 LAMEA Painting, Cutting, Pressing, Grinding, & Deburring Market by Country, 2022 - 2028, USD Million
- TABLE 454 LAMEA Welding & Soldering Market by Country, 2018 - 2021, USD Million
- TABLE 455 LAMEA Welding & Soldering Market by Country, 2022 - 2028, USD Million
- TABLE 456 LAMEA Measurement, Inspection, & Testing Market by Country, 2018 - 2021, USD Million
- TABLE 457 LAMEA Measurement, Inspection, & Testing Market by Country, 2022 - 2028, USD Million
- TABLE 458 LAMEA Robotic Vision Market by Industry, 2018 - 2021, USD Million
- TABLE 459 LAMEA Robotic Vision Market by Industry, 2022 - 2028, USD Million
- TABLE 460 LAMEA Electrical & Electronics Market by Country, 2018 - 2021, USD Million
- TABLE 461 LAMEA Electrical & Electronics Market by Country, 2022 - 2028, USD Million
- TABLE 462 LAMEA Metals & Machinery Market by Country, 2018 - 2021, USD Million
- TABLE 463 LAMEA Metals & Machinery Market by Country, 2022 - 2028, USD Million
- TABLE 464 LAMEA Precision Engineering & Optics Market by Country, 2018 - 2021, USD Million
- TABLE 465 LAMEA Precision Engineering & Optics Market by Country, 2022 - 2028, USD Million
- TABLE 466 LAMEA Automotive Market by Country, 2018 - 2021, USD Million
- TABLE 467 LAMEA Automotive Market by Country, 2022 - 2028, USD Million
- TABLE 468 LAMEA Pharmaceuticals & Cosmetics Market by Country, 2018 - 2021, USD Million
- TABLE 469 LAMEA Pharmaceuticals & Cosmetics Market by Country, 2022 - 2028, USD Million
- TABLE 470 LAMEA Food & Beverages Market by Country, 2018 - 2021, USD Million
- TABLE 471 LAMEA Food & Beverages Market by Country, 2022 - 2028, USD Million
- TABLE 472 LAMEA Chemical, Rubber, & Plastic Market by Country, 2018 - 2021, USD Million
- TABLE 473 LAMEA Chemical, Rubber, & Plastic Market by Country, 2022 - 2028, USD Million
- TABLE 474 LAMEA Other Industry Market by Country, 2018 - 2021, USD Million
- TABLE 475 LAMEA Other Industry Market by Country, 2022 - 2028, USD Million
- TABLE 476 LAMEA Robotic Vision Market by Type, 2018 - 2021, USD Million
- TABLE 477 LAMEA Robotic Vision Market by Type, 2022 - 2028, USD Million
- TABLE 478 LAMEA 2D Vision Systems Market by Country, 2018 - 2021, USD Million
- TABLE 479 LAMEA 2D Vision Systems Market by Country, 2022 - 2028, USD Million
- TABLE 480 LAMEA 3D Vision Systems Market by Country, 2018 - 2021, USD Million
- TABLE 481 LAMEA 3D Vision Systems Market by Country, 2022 - 2028, USD Million
- TABLE 482 LAMEA Robotic Vision Market by Deployment, 2018 - 2021, USD Million
- TABLE 483 LAMEA Robotic Vision Market by Deployment, 2022 - 2028, USD Million
- TABLE 484 LAMEA Robotic Guidance Systems Market by Country, 2018 - 2021, USD Million
- TABLE 485 LAMEA Robotic Guidance Systems Market by Country, 2022 - 2028, USD Million
- TABLE 486 LAMEA Robotic Cells Market by Country, 2018 - 2021, USD Million
- TABLE 487 LAMEA Robotic Cells Market by Country, 2022 - 2028, USD Million
- TABLE 488 LAMEA Robotic Vision Market by Country, 2018 - 2021, USD Million
- TABLE 489 LAMEA Robotic Vision Market by Country, 2022 - 2028, USD Million
- TABLE 490 Brazil Robotic Vision Market, 2018 - 2021, USD Million
- TABLE 491 Brazil Robotic Vision Market, 2022 - 2028, USD Million
- TABLE 492 Brazil Robotic Vision Market by Component, 2018 - 2021, USD Million
- TABLE 493 Brazil Robotic Vision Market by Component, 2022 - 2028, USD Million
- TABLE 494 Brazil Robotic Vision Market by Application, 2018 - 2021, USD Million
- TABLE 495 Brazil Robotic Vision Market by Application, 2022 - 2028, USD Million
- TABLE 496 Brazil Robotic Vision Market by Industry, 2018 - 2021, USD Million
- TABLE 497 Brazil Robotic Vision Market by Industry, 2022 - 2028, USD Million
- TABLE 498 Brazil Robotic Vision Market by Type, 2018 - 2021, USD Million
- TABLE 499 Brazil Robotic Vision Market by Type, 2022 - 2028, USD Million
- TABLE 500 Brazil Robotic Vision Market by Deployment, 2018 - 2021, USD Million
- TABLE 501 Brazil Robotic Vision Market by Deployment, 2022 - 2028, USD Million
- TABLE 502 Argentina Robotic Vision Market, 2018 - 2021, USD Million
- TABLE 503 Argentina Robotic Vision Market, 2022 - 2028, USD Million
- TABLE 504 Argentina Robotic Vision Market by Component, 2018 - 2021, USD Million
- TABLE 505 Argentina Robotic Vision Market by Component, 2022 - 2028, USD Million
- TABLE 506 Argentina Robotic Vision Market by Application, 2018 - 2021, USD Million
- TABLE 507 Argentina Robotic Vision Market by Application, 2022 - 2028, USD Million
- TABLE 508 Argentina Robotic Vision Market by Industry, 2018 - 2021, USD Million
- TABLE 509 Argentina Robotic Vision Market by Industry, 2022 - 2028, USD Million
- TABLE 510 Argentina Robotic Vision Market by Type, 2018 - 2021, USD Million
- TABLE 511 Argentina Robotic Vision Market by Type, 2022 - 2028, USD Million
- TABLE 512 Argentina Robotic Vision Market by Deployment, 2018 - 2021, USD Million
- TABLE 513 Argentina Robotic Vision Market by Deployment, 2022 - 2028, USD Million
- TABLE 514 UAE Robotic Vision Market, 2018 - 2021, USD Million
- TABLE 515 UAE Robotic Vision Market, 2022 - 2028, USD Million
- TABLE 516 UAE Robotic Vision Market by Component, 2018 - 2021, USD Million
- TABLE 517 UAE Robotic Vision Market by Component, 2022 - 2028, USD Million
- TABLE 518 UAE Robotic Vision Market by Application, 2018 - 2021, USD Million
- TABLE 519 UAE Robotic Vision Market by Application, 2022 - 2028, USD Million
- TABLE 520 UAE Robotic Vision Market by Industry, 2018 - 2021, USD Million
- TABLE 521 UAE Robotic Vision Market by Industry, 2022 - 2028, USD Million
- TABLE 522 UAE Robotic Vision Market by Type, 2018 - 2021, USD Million
- TABLE 523 UAE Robotic Vision Market by Type, 2022 - 2028, USD Million
- TABLE 524 UAE Robotic Vision Market by Deployment, 2018 - 2021, USD Million
- TABLE 525 UAE Robotic Vision Market by Deployment, 2022 - 2028, USD Million
- TABLE 526 Saudi Arabia Robotic Vision Market, 2018 - 2021, USD Million
- TABLE 527 Saudi Arabia Robotic Vision Market, 2022 - 2028, USD Million
- TABLE 528 Saudi Arabia Robotic Vision Market by Component, 2018 - 2021, USD Million
- TABLE 529 Saudi Arabia Robotic Vision Market by Component, 2022 - 2028, USD Million
- TABLE 530 Saudi Arabia Robotic Vision Market by Application, 2018 - 2021, USD Million
- TABLE 531 Saudi Arabia Robotic Vision Market by Application, 2022 - 2028, USD Million
- TABLE 532 Saudi Arabia Robotic Vision Market by Industry, 2018 - 2021, USD Million
- TABLE 533 Saudi Arabia Robotic Vision Market by Industry, 2022 - 2028, USD Million
- TABLE 534 Saudi Arabia Robotic Vision Market by Type, 2018 - 2021, USD Million
- TABLE 535 Saudi Arabia Robotic Vision Market by Type, 2022 - 2028, USD Million
- TABLE 536 Saudi Arabia Robotic Vision Market by Deployment, 2018 - 2021, USD Million
- TABLE 537 Saudi Arabia Robotic Vision Market by Deployment, 2022 - 2028, USD Million
- TABLE 538 South Africa Robotic Vision Market, 2018 - 2021, USD Million
- TABLE 539 South Africa Robotic Vision Market, 2022 - 2028, USD Million
- TABLE 540 South Africa Robotic Vision Market by Component, 2018 - 2021, USD Million
- TABLE 541 South Africa Robotic Vision Market by Component, 2022 - 2028, USD Million
- TABLE 542 South Africa Robotic Vision Market by Application, 2018 - 2021, USD Million
- TABLE 543 South Africa Robotic Vision Market by Application, 2022 - 2028, USD Million
- TABLE 544 South Africa Robotic Vision Market by Industry, 2018 - 2021, USD Million
- TABLE 545 South Africa Robotic Vision Market by Industry, 2022 - 2028, USD Million
- TABLE 546 South Africa Robotic Vision Market by Type, 2018 - 2021, USD Million
- TABLE 547 South Africa Robotic Vision Market by Type, 2022 - 2028, USD Million
- TABLE 548 South Africa Robotic Vision Market by Deployment, 2018 - 2021, USD Million
- TABLE 549 South Africa Robotic Vision Market by Deployment, 2022 - 2028, USD Million
- TABLE 550 Nigeria Robotic Vision Market, 2018 - 2021, USD Million
- TABLE 551 Nigeria Robotic Vision Market, 2022 - 2028, USD Million
- TABLE 552 Nigeria Robotic Vision Market by Component, 2018 - 2021, USD Million
- TABLE 553 Nigeria Robotic Vision Market by Component, 2022 - 2028, USD Million
- TABLE 554 Nigeria Robotic Vision Market by Application, 2018 - 2021, USD Million
- TABLE 555 Nigeria Robotic Vision Market by Application, 2022 - 2028, USD Million
- TABLE 556 Nigeria Robotic Vision Market by Industry, 2018 - 2021, USD Million
- TABLE 557 Nigeria Robotic Vision Market by Industry, 2022 - 2028, USD Million
- TABLE 558 Nigeria Robotic Vision Market by Type, 2018 - 2021, USD Million
- TABLE 559 Nigeria Robotic Vision Market by Type, 2022 - 2028, USD Million
- TABLE 560 Nigeria Robotic Vision Market by Deployment, 2018 - 2021, USD Million
- TABLE 561 Nigeria Robotic Vision Market by Deployment, 2022 - 2028, USD Million
- TABLE 562 Rest of LAMEA Robotic Vision Market, 2018 - 2021, USD Million
- TABLE 563 Rest of LAMEA Robotic Vision Market, 2022 - 2028, USD Million
- TABLE 564 Rest of LAMEA Robotic Vision Market by Component, 2018 - 2021, USD Million
- TABLE 565 Rest of LAMEA Robotic Vision Market by Component, 2022 - 2028, USD Million
- TABLE 566 Rest of LAMEA Robotic Vision Market by Application, 2018 - 2021, USD Million
- TABLE 567 Rest of LAMEA Robotic Vision Market by Application, 2022 - 2028, USD Million
- TABLE 568 Rest of LAMEA Robotic Vision Market by Industry, 2018 - 2021, USD Million
- TABLE 569 Rest of LAMEA Robotic Vision Market by Industry, 2022 - 2028, USD Million
- TABLE 570 Rest of LAMEA Robotic Vision Market by Type, 2018 - 2021, USD Million
- TABLE 571 Rest of LAMEA Robotic Vision Market by Type, 2022 - 2028, USD Million
- TABLE 572 Rest of LAMEA Robotic Vision Market by Deployment, 2018 - 2021, USD Million
- TABLE 573 Rest of LAMEA Robotic Vision Market by Deployment, 2022 - 2028, USD Million
- TABLE 574 Key information - Cognex Corporation
- TABLE 575 Key Information - ISRA Vision AG
- TABLE 576 Key Information - Basler AG
- TABLE 577 Key Information - Omron Corporation
- TABLE 578 Key Information - National Instruments Corporation
- TABLE 579 Key Information - Teledyne Technologies, Inc.
- TABLE 580 key information - Keyence Corporation
- TABLE 581 key information - FANUC Corporation
- TABLE 582 Key information - Hexagon AB
- TABLE 583 Key Information - Sick AG
List of Figures
- FIG 1 Methodology for the research
- FIG 2 KBV Cardinal Matrix
- FIG 3 Key Leading Strategies: Percentage Distribution (2018-2022)
- FIG 4 Key Strategic Move: (Product Launches and Product Expansions : 2018, Nov - 2022, May) Leading Players
- FIG 5 Global Robotic Vision Market Share by Component, 2021
- FIG 6 Global Robotic Vision Market Share by Component, 2028
- FIG 7 Global Robotic Vision Market by Component, 2018 - 2028, USD Million
- FIG 8 Global Robotic Vision Market Share by Application, 2021
- FIG 9 Global Robotic Vision Market Share by Application, 2028
- FIG 10 Global Robotic Vision Market by Application, 2018 - 2028, USD Million
- FIG 11 Global Robotic Vision Market Share by Industry, 2021
- FIG 12 Global Robotic Vision Market Share by Industry, 2028
- FIG 13 Global Robotic Vision Market by Industry, 2018 - 2028, USD Million
- FIG 14 Global Robotic Vision Market Share by Type, 2021
- FIG 15 Global Robotic Vision Market Share by Type, 2028
- FIG 16 Global Robotic Vision Market by Type, 2018 - 2028, USD Million
- FIG 17 Global Robotic Vision Market Share by Deployment, 2021
- FIG 18 Global Robotic Vision Market Share by Deployment, 2028
- FIG 19 Global Robotic Vision Market by Deployment, 2018 - 2028, USD Million
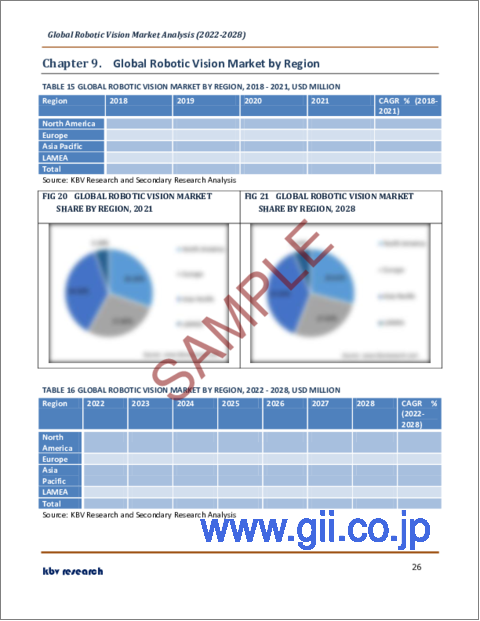
- FIG 20 Global Robotic Vision Market Share by Region, 2021
- FIG 21 Global Robotic Vision Market Share by Region, 2028
- FIG 22 Global Robotic Vision Market by Region, 2018 - 2028, USD Million
- FIG 23 Recent strategies and developments: Cognex Corporation
- FIG 24 Recent strategies and developments: Basler AG
- FIG 25 Recent strategies and developments: Omron Corporation
- FIG 26 Recent strategies and developments: Teledyne Technologies, Inc.
- FIG 27 SWOT Analysis: Keyence Corporation
- FIG 28 Recent strategies and developments: FANUC Corporation
- FIG 29 Recent strategies and developments: Hexagon AB
- FIG 30 Recent strategies and developments: Sick AG
- FIG 31 SWOT Analysis: Sick AG
The Global Robotic Vision Market size is expected to reach $3.8 billion by 2028, rising at a market growth of 9.3% CAGR during the forecast period.
Robot vision refers to a robot's ability to visually detect its surroundings and use that knowledge to perform various tasks. For robot navigation and obstacle avoidance, visual input has been widely used. In recent years, there have also been examples of communicating with humans and item manipulation. Specialists examine some of the work that has gone beyond using artificial landmarks and calibration markers to create vision-based control in robots in this study. It goes over many application areas from a systems perspective as well as specific difficulties like object tracking and recognition.
For scholars and professionals working in the domains of machine vision, image processing, and pattern recognition, Vision in Robotics is an ideal and up-to-date resource. Its comprehensive bibliography is a significant resource for the current study.
Robots are blind technologies that operate as per their programming without robotic vision. They strictly adhere to the coding that defines their functions, making them suitable for repetitive activities that are physically demanding and difficult for humans. Now that Industry 4.0 has here, robots are evolving as well. It would allow companies to stay up with the fourth industrial revolution's demands and tendencies. The development of a robot vision system for collaborative robots is important to the advancement of robotics. Machine or robot vision is a major component of this progress, allowing clever automated operations to achieve new levels of precision and accuracy.
COVID-19 Impact
COVID-19 has had a significant impact on all industries and the global economy. Lockdowns have been ordered around the world to stop its spread. In the early stages of the pandemic, the complete lockdown severely disrupted the livelihoods and quality of life of many people around the world. Therefore, supply chains have been disrupted throughout the world. A significant drop in product demand has negatively affected the world's economies. A lack of basic materials has resulted from the pandemic, mainly due to a drop-in exports and supply chain disruptions.
Market Growth Factors
Robotics Vision Enhances Automation and Quality Management
Industrial quality control is an important procedure, and increasing it may usually help a company minimize waste and increase efficiency. Extending quality control is frequently a labor-intensive and difficult-to-automate operation. While adding additional quality checks to a manufacturing process is normally desired, allocating labor to these checks is not always feasible. Human workers make mistakes as well, particularly when the labor is monotonous or repetitive. Some sorts of visual inspection, such as ensuring that each bottle in the manufacturing line is filled to a given point, might be extremely difficult for a human operator to repeat with accuracy over and over again.
Accessibility and versatility of the robotics visions
Some vision systems are built right into robot arms, while others require direct attachment to a robot wrist or arm to function properly. The systems that can be put outside, apart from robot are the perfect choices, to increase the number of possible deployment scenarios. A well-placed externally mounted camera, for example, might be used to check on the state of the equipment affecting food goods, allowing to time cleaning procedures more precisely. External mounting not only avoids the problem of wires running alongside the robot, but also enhances cycle time. The robot can work on something else while the vision system captures and processes images.
Market Restraining Factors
Robot Vision Connectivity Difficulties and Initial Cost
Considering the current industrial progress, integrating robot arms with robotic vision is a difficult task. If the end client does not have sufficient engineering expertise, professional system integrator assistance would be required. Precision and cycle time would be given top priority while evaluating the viability of automation needs. The predicted production cycle can be used to evaluate production capacity and compute the return on investment, and sufficient precision can ensure the correctness of each step (ROI). Whenever a target is positioned using vision, many factors influence accuracy rate, including picture quality, placement algorithm, hand-eye relationship correction errors, camera lens correction errors, arm repeating precision, absolute accuracy, and so on, which can only be effectively evaluated by experienced robot vision technicians.
Component Outlook
Based on Component, the market is segmented into Hardware and Software. The Hardware segment acquired the largest revenue share in the robotics vision market in 2021. It is due to the number of components in a robotics vision system, including lighting, lenses, image sensors, vision processing, and communication. Using lighting, the camera is able to see clearly the features of the part being examined. A robotics vision camera's sensor converts light into a digital photo, which is then sent to a processor. The sensor captures light from the lens and delivers it to the sensor.
Application Outlook
Based on Application, the market is segmented into Material Handling, Packaging & Palletizing, Assembling & Disassembling, Painting, Cutting, Pressing, Grinding, & Deburring, Welding & Soldering, and Measurement, Inspection, & Testing. The Packaging & Palletizing segment recorded a substantial revenue share in the robotics vision market in 2021. It is due to the process of loading an object, such as a corrugated box, in a predetermined arrangement onto a pallet or similar equipment. Depalletizing is the process of unloading a loaded object in the opposite direction. Many industries and businesses now use some sort of palletizing robot technology to automate their operations. Robotic palletizing technology boosts productivity and profits while allowing for greater product flexibility and longer run times.
Industry Outlook
Based on Industry, the market is segmented into Electrical & Electronics, Metals & Machinery, Precision Engineering & Optics, Automotive, Pharmaceuticals & Cosmetics, Food & Beverages, Chemical, Rubber, & Plastic, and Others. The Electrical & Electronics system procured the highest segment revenue share in the robotics vision market in 2021. Through non-tactile sensing, vision is utilized to find electronic components and perform testing and inspection. Electronic gadgets are tracked by robot controllers as they go through the production line." In electronics and semiconductor work cells, tool changers help robots multitask better.
Type Outlook
Based on Type, the market is segmented into 2D Vision Systems and 3D Vision Systems. The 3D vision system segment registered a substantial revenue share in the robotics vision market in 2021. It is due to the pick and place applications utilization of 3D robotic vision. Even though the position and location of the parts vary, 3D vision allows a robot to determine the direction of a part that has to be handled more effectively. Part assembly and inspection are another prominent use of 3D vision in robotics. A 3D vision system can precisely direct a robotic arm during assembly, and a robotic arm can provide a 3D camera with numerous viewing angles for important assembly inspection.
Deployment Outlook
Based on Deployment, the market is segmented into Robotic Guidance Systems and Robotic Cells. The Robotic Guidance Systems segment acquired the highest revenue share in the robotics vision market in 2021. It is due to the employing 3D vision systems developed for object detection and recognition is a critical component of industrial production process optimization. SICK's robot guiding systems make it simple and affordable for users to make use of this advanced technology. The systems are distinguished by their dependable and user-friendly design. They can easily be integrated into current surroundings, give high-precision measurement findings, and so play an important role in making part management more adaptable than ever before.
Regional Outlook
Based on Regions, the market is segmented into North America, Europe, Asia Pacific, and Latin America, Middle East & Africa. The Asia pacific region dominates the largest revenue share in the robotics vision market in 2021. China will have the highest share of the APAC smart robotics market by 2020. The production value of service robots in Shenzhen climbed by 21.79 percent year on year to almost USD 5.06 billion in 2018, according to the 2018 white paper on Shenzhen's Robot Industrial Development. For the first time, China's government designated service robots as a significant area for development in its 12th Five-Year Plan, which was released in 2011. A robot named Youxiaomei served attendees with water and tea during the 7th China Information Technology Expo in 2019. China is the world's largest automobile manufacturer, according to the International Organization of Motor Vehicle Manufacturers (OICA), with Japan importing the most vehicles. As a result, industrial robots are in high demand.
The major strategies followed by the market participants are Product Launches. Based on the Analysis presented in the Cardinal matrix; FANUC Corporation and Keyence Corporation are the forerunners in the Robotic Vision Market. Companies such as Cognex Corporation, Omron Corporation and Hexagon AB are some of the key innovators in the Market.
The market research report covers the analysis of key stake holders of the market. Key companies profiled in the report include Cognex Corporation, ISRA Vision AG, Basler AG, Omron Corporation, National Instruments Corporation, Teledyne Technologies, Inc. (Teledyne DALSA), Keyence Corporation, FANUC Corporation, Hexagon AB, and Sick AG.
Recent Strategies Deployed in Robotic Vision Market
Partnerships, Collaborations and Agreements:
Jun-2021: Sick AG formed a partnership with Vention, a next-generation manufacturing automation platform. Under this partnership, the companies aimed to integrate SICK's PLB and PLOC2D systems within Vention's production automation medium to boost the design and deployment of applications customized for robot advice systems. Additionally, the partnership would provide benefits to consumers searching for modular robotic solutions along with Vention's AI-enabled and cloud-based medium, consumers would be capable to design, order, and create custom tools to enhance manufacturing procedures.
May-2021: Hexagon AB came into a partnership with Plex Systems, the superior in cloud-delivered smart manufacturing solutions. This partnership would allow Hexagon's Manufacturing Intelligence unit and Plex to co-sell Plex MES to Hexagon production consumers, allowing them to take management of the plant floor through full clarity and connectivity and discover the promise of Industry 4.0.
Mar-2021: Teledyne e2v, a subsidiary of Teledyne Technologies company joined hands with Yumain, a dominant AI vision solution supplier providing a wide range of industrial applications. Through this collaboration, the companies aimed to integrate Teledyne image sensor abilities associated with custom AI expertise would enable Teledyne to create AI-based concept solutions which would be easily available to industrial consumers and convey advantages to their applications.
Dec-2020: FANUC came into a partnership with Plus One Robotics, a team with advanced robotics and software engineering at its core. Through this partnerships, Plus One joined the certified System Integrator network as a System Solution Consultant, and Plus One technology is a great addition to reinforce robotics. Additionally, the companies aimed to integrate strengths with other enterprises in the logistics, warehouse segments, and e-commerce.
Oct-2020: SICK came into a partnership with Microsoft, the largest vendor of computer software in the world. Through this partnership, the companies aimed to improve the Visionary-T camera product line from SICK with Azure Intelligent Cloud and Intelligent Edge abilities. Additionally, a partnership with Microsoft would boost execution and more cost-effective for consumers.
Sep-2020: Basler came into a partnership with Axiomtek, one of the world's leading designers and manufacturers of industrial computer products. Together the companies aimed to provide combined, all-in-one machine sight solutions for industry and machine automation. Additionally, Axiomtek and Basler assist producers and system integrators in rapidly establishing quality examination applications to make industrial procedures more productive and competitive.
Product Launches and Product Expansions:
May-2022: Teledyne introduced a Sapera Vision Software Edition 2022-05 to its prevailing Astrocyte and Sapera Processing packages. The new Sapera Vision Software Edition 2022-05 allows the consumer to notice the smallest flaws in big pictures at indigenous resolution. Moreover, the recent update has added enhanced abnormality detection algorithms, live video purchase from frame grabbers, and new features that offer improved performance and an adequate consumer experience.
May-2022: FANUC launched DR-3iB/6 STAINLESS Delta Robot, the first stainless steel food-grade delta robot for gathering and wrapping primary food products. The DR-3iB/6 STAINLESS Delta Robot meets USDA and FDA food safety standards and establishes a new standard for robotic food operation such as cargo, reach, pace, and sanitation. Additionally, the robot features a completely encompassed stainless steel body that is immune to the chemicals and high pressure & temperatures needed in tough wash-down circumstances.
Mar-2022: Cognex Corporation unveiled DataMan 280 series, permanent-mount barcode readers. The DataMan 280 presents a high-resolution sensor integrated with a powerful image creation system to enhance code coverage and administration. Additionally, DataMan 280 together with connectivity feature Industry 4.0 production requirements, enables the consumer to interpret tough barcodes accurately while enhancing entire equipment effectiveness and bandwidth.
Mar-2022: Keyence expanded its portfolio of precision measurement technologies with the launch of LM Series, a new, high-accuracy image dimension measurement system. This series can be programmed with on-screen assistance available, and it would be managed with just one button.
Oct-2021: Omron unveiled the VT-S10 series, the first PCB inspection system that uses innovative, multi-dire, and advanced AI. The VT-S10 series 3D AOI system as well as dominating quick speed 3D CT AXI abilities, assist enhance the entire capacity of the production process, accomplishing zero-fault products, and realizing considerable labor conservations. Additionally, imaging techniques and AI to best automatize the high-accuracy review method for electronic groups, maximize implementation and undervalue skill-level needs.
Sep-2021: SICK introduced Ruler3000, the latest expansion of 3D streaming cameras. The Ruler3000 evoke the real 3D form of an object, despite its distinction or color, as well as simultaneously grasping greyscale and spread light proportions, so image processing and measurement accuracy can be advance. Additionally, the Ruler3000 can process up to 15.4Gp/s to allow up to 7,000 full-frame 3D shapes per second.
Apr-2021: SICK unveiled its first vision camera with a pre-installed Deep Learning app onboard. This camera aimed to make it easy to develop custom quality inspections of complicated or irregular-shaped goods, packaging and assemblies. With the implementation of the Intelligent Inspection App onto SICK's Inspector P621 deep learning camera, SICK would enable users to buy ready-made package, which utilizes artificial intelligence to operate complex vision inspections with ease.
Mar-2021: Omron Corporation launched the FH-SMD Series 3D Vision Sensor, tiny and light sufficiently to be installed on a robot arm. The FH-SMD Series 3D Vision Sensor can be moved to change perspectives and efficiently identify parts, lowering blind areas and providing trustworthy identification. Moreover, the sensor permits part detection in roughly 0.4 seconds irrespective of the condition and area.
Jan-2021: Cognex Corporation launched In-Sight 3D-L4000, an embedded vision system. The new In-Sight 3D-L4000 enables consumers to position vision tools immediately on a 3D image of the part, it provides better precision contrast to authentic systems, amplifying the range of analysis that can be executed. Additionally, In-Sight 3D-L4000 appear in three factories graded area of view and is dominant for applications around a variety of companies such as consumer products, food and beverage, wrapping, medical equipment, automotive, and electronics.
Jan-2021: Omron Corporation introduced the i4 series SCARA robot. The robot allows consumers to construct positively effective tools by combining and managing the end effector and peripheral machines at a high pace and with increased accuracy with a "Robotic Integrated Controller. Additionally, The i4 series SCARA robot features high precision, ease of integration, flexibility and high uptime.
Nov-2020: Hexagon introduced OPTIV Lite 3.2.2, entry-level multisensor coordinate measuring machine. The OPTIV Lite 3.2.2 delivers high precision, pace, and smart technology ability to entry-level optical CMMs. Additionally, CMM permits producers to keep up with the rapid growing smart factory and make potentially cost-saving procedure advancements, all while guaranteeing dependable and convenient examination results.
Oct-2020: Omron Automation Americas, a subsidiary of Omron Corporation introduced Robotic Integrated Controller, which first completely synchronizes automation technology. Robotic Integrated Controller allows developing automation technology by eliminating manual work and easing the production ecosystem. In addition, the solution would streamline developed and complicated manual work that would require to be achieved by human employees
Jun-2020: FANUC Corporation introduced 3DV/1600 vision sensor, a new vision sensor for robotic warehousing applications. The new sensor offers fast click 3D images over a Z field of 2 meters, with a max area of view of 2700mm square, which is perfect for container picking or line following large parts. Additionally, The 3DV/1600 is part of Fanuc's iRVision portfolio of completely combined and wide machine vision products for robot advice and examination.
Acquisitions and Mergers:
Aug-2021: The Hexagon AB came into an agreement to acquire Wuhan Zhongguan Automation Technology. This acquisition aimed to enhance Hexagon's capabilities in the field of 3D data acquisition and further expand Hexagon's solution portfolio in the field of intelligent manufacturing. Through this acquisition, Zhongguan would combine with Hexagon Manufacturing Intelligence Unit.
Scope of the Study
Market Segments covered in the Report:
By Component
- Hardware
- Software
By Application
- Material Handling
- Packaging & Palletizing
- Assembling & Disassembling
- Painting, Cutting, Pressing, Grinding, & Deburring
- Welding & Soldering
- Measurement, Inspection, & Testing
By Industry
- Electrical & Electronics
- Metals & Machinery
- Precision Engineering & Optics
- Automotive
- Pharmaceuticals & Cosmetics
- Food & Beverages
- Chemical, Rubber, & Plastic
- Others
By Type
- 2D Vision Systems
- 3D Vision Systems
By Deployment
- Robotic Guidance Systems
- Robotic Cells
By Geography
- North America
- US
- Canada
- Mexico
- Rest of North America
- Europe
- Germany
- UK
- France
- Russia
- Spain
- Italy
- Rest of Europe
- Asia Pacific
- China
- Japan
- India
- South Korea
- Singapore
- Malaysia
- Rest of Asia Pacific
- LAMEA
- Brazil
- Argentina
- UAE
- Saudi Arabia
- South Africa
- Nigeria
- Rest of LAMEA
Companies Profiled
- Cognex Corporation
- ISRA Vision AG
- Basler AG
- Omron Corporation
- National Instruments Corporation
- Teledyne Technologies, Inc. (Teledyne DALSA)
- Keyence Corporation
- FANUC Corporation
- Hexagon AB
- Sick AG
Unique Offerings from KBV Research
- Exhaustive coverage
- Highest number of market tables and figures
- Subscription based model available
- Guaranteed best price
- Assured post sales research support with 10% customization free
Table of Contents
Chapter 1. Market Scope & Methodology
- 1.1 Market Definition
- 1.2 Objectives
- 1.3 Market Scope
- 1.4 Segmentation
- 1.4.1 Global Robotic Vision Market, by Component
- 1.4.2 Global Robotic Vision Market, by Application
- 1.4.3 Global Robotic Vision Market, by Industry
- 1.4.4 Global Robotic Vision Market, by Type
- 1.4.5 Global Robotic Vision Market, by Deployment
- 1.4.6 Global Robotic Vision Market, by Geography
- 1.5 Methodology for the research
Chapter 2. Market Overview
- 2.1 Introduction
- 2.1.1 Overview
- 2.1.1.1 Market Composition and Scenario
- 2.1.1 Overview
- 2.2 Key Factors Impacting the Market
- 2.2.1 Market Drivers
- 2.2.2 Market Restraints
Chapter 3. Competition Analysis - Global
- 3.1 KBV Cardinal Matrix
- 3.2 Recent Industry Wide Strategic Developments
- 3.2.1 Partnerships, Collaborations and Agreements
- 3.2.2 Product Launches and Product Expansions
- 3.2.3 Acquisition and Mergers
- 3.3 Top Winning Strategies
- 3.3.1 Key Leading Strategies: Percentage Distribution (2018-2022)
- 3.3.2 Key Strategic Move: (Product Launches and Product Expansions : 2018, Nov - 2022, May) Leading Players
Chapter 4. Global Robotic Vision Market by Component
- 4.1 Global Hardware Market by Region
- 4.2 Global Software Market by Region
Chapter 5. Global Robotic Vision Market by Application
- 5.1 Global Material Handling Market by Region
- 5.2 Global Packaging & Palletizing Market by Region
- 5.3 Global Assembling & Disassembling Market by Region
- 5.4 Global Painting, Cutting, Pressing, Grinding, & Deburring Market by Region
- 5.5 Global Welding & Soldering Market by Region
- 5.6 Global Measurement, Inspection, & Testing Market by Region
Chapter 6. Global Robotic Vision Market by Industry
- 6.1 Global Electrical & Electronics Market by Region
- 6.2 Global Metals & Machinery Market by Region
- 6.3 Global Precision Engineering & Optics Market by Region
- 6.4 Global Automotive Market by Region
- 6.5 Global Pharmaceuticals & Cosmetics Market by Region
- 6.6 Global Food & Beverages Market by Region
- 6.7 Global Chemical, Rubber, & Plastic Market by Region
- 6.8 Global Other Industry Market by Region
Chapter 7. Global Robotic Vision Market by Type
- 7.1 Global 2D Vision Systems Market by Region
- 7.2 Global 3D Vision Systems Market by Region
Chapter 8. Global Robotic Vision Market by Deployment
- 8.1 Global Robotic Guidance Systems Market by Region
- 8.2 Global Robotic Cells Market by Region
Chapter 9. Global Robotic Vision Market by Region
- 9.1 North America Robotic Vision Market
- 9.1.1 North America Robotic Vision Market by Component
- 9.1.1.1 North America Hardware Market by Country
- 9.1.1.2 North America Software Market by Country
- 9.1.2 North America Robotic Vision Market by Application
- 9.1.2.1 North America Material Handling Market by Country
- 9.1.2.2 North America Packaging & Palletizing Market by Country
- 9.1.2.3 North America Assembling & Disassembling Market by Country
- 9.1.2.4 North America Painting, Cutting, Pressing, Grinding, & Deburring Market by Country
- 9.1.2.5 North America Welding & Soldering Market by Country
- 9.1.2.6 North America Measurement, Inspection, & Testing Market by Country
- 9.1.3 North America Robotic Vision Market by Industry
- 9.1.3.1 North America Electrical & Electronics Market by Country
- 9.1.3.2 North America Metals & Machinery Market by Country
- 9.1.3.3 North America Precision Engineering & Optics Market by Country
- 9.1.3.4 North America Automotive Market by Country
- 9.1.3.5 North America Pharmaceuticals & Cosmetics Market by Country
- 9.1.3.6 North America Food & Beverages Market by Country
- 9.1.3.7 North America Chemical, Rubber, & Plastic Market by Country
- 9.1.3.8 North America Other Industry Market by Country
- 9.1.4 North America Robotic Vision Market by Type
- 9.1.4.1 North America 2D Vision Systems Market by Country
- 9.1.4.2 North America 3D Vision Systems Market by Country
- 9.1.5 North America Robotic Vision Market by Deployment
- 9.1.5.1 North America Robotic Guidance Systems Market by Country
- 9.1.5.2 North America Robotic Cells Market by Country
- 9.1.6 North America Robotic Vision Market by Country
- 9.1.6.1 US Robotic Vision Market
- 9.1.6.1.1 US Robotic Vision Market by Component
- 9.1.6.1.2 US Robotic Vision Market by Application
- 9.1.6.1.3 US Robotic Vision Market by Industry
- 9.1.6.1.4 US Robotic Vision Market by Type
- 9.1.6.1.5 US Robotic Vision Market by Deployment
- 9.1.6.2 Canada Robotic Vision Market
- 9.1.6.2.1 Canada Robotic Vision Market by Component
- 9.1.6.2.2 Canada Robotic Vision Market by Application
- 9.1.6.2.3 Canada Robotic Vision Market by Industry
- 9.1.6.2.4 Canada Robotic Vision Market by Type
- 9.1.6.2.5 Canada Robotic Vision Market by Deployment
- 9.1.6.3 Mexico Robotic Vision Market
- 9.1.6.3.1 Mexico Robotic Vision Market by Component
- 9.1.6.3.2 Mexico Robotic Vision Market by Application
- 9.1.6.3.3 Mexico Robotic Vision Market by Industry
- 9.1.6.3.4 Mexico Robotic Vision Market by Type
- 9.1.6.3.5 Mexico Robotic Vision Market by Deployment
- 9.1.6.4 Rest of North America Robotic Vision Market
- 9.1.6.4.1 Rest of North America Robotic Vision Market by Component
- 9.1.6.4.2 Rest of North America Robotic Vision Market by Application
- 9.1.6.4.3 Rest of North America Robotic Vision Market by Industry
- 9.1.6.4.4 Rest of North America Robotic Vision Market by Type
- 9.1.6.4.5 Rest of North America Robotic Vision Market by Deployment
- 9.1.6.1 US Robotic Vision Market
- 9.1.1 North America Robotic Vision Market by Component
- 9.2 Europe Robotic Vision Market
- 9.2.1 Europe Robotic Vision Market by Component
- 9.2.1.1 Europe Hardware Market by Country
- 9.2.1.2 Europe Software Market by Country
- 9.2.2 Europe Robotic Vision Market by Application
- 9.2.2.1 Europe Material Handling Market by Country
- 9.2.2.2 Europe Packaging & Palletizing Market by Country
- 9.2.2.3 Europe Assembling & Disassembling Market by Country
- 9.2.2.4 Europe Painting, Cutting, Pressing, Grinding, & Deburring Market by Country
- 9.2.2.5 Europe Welding & Soldering Market by Country
- 9.2.2.6 Europe Measurement, Inspection, & Testing Market by Country
- 9.2.3 Europe Robotic Vision Market by Industry
- 9.2.3.1 Europe Electrical & Electronics Market by Country
- 9.2.3.2 Europe Metals & Machinery Market by Country
- 9.2.3.3 Europe Precision Engineering & Optics Market by Country
- 9.2.3.4 Europe Automotive Market by Country
- 9.2.3.5 Europe Pharmaceuticals & Cosmetics Market by Country
- 9.2.3.6 Europe Food & Beverages Market by Country
- 9.2.3.7 Europe Chemical, Rubber, & Plastic Market by Country
- 9.2.3.8 Europe Other Industry Market by Country
- 9.2.4 Europe Robotic Vision Market by Type
- 9.2.4.1 Europe 2D Vision Systems Market by Country
- 9.2.4.2 Europe 3D Vision Systems Market by Country
- 9.2.5 Europe Robotic Vision Market by Deployment
- 9.2.5.1 Europe Robotic Guidance Systems Market by Country
- 9.2.5.2 Europe Robotic Cells Market by Country
- 9.2.6 Europe Robotic Vision Market by Country
- 9.2.6.1 Germany Robotic Vision Market
- 9.2.6.1.1 Germany Robotic Vision Market by Component
- 9.2.6.1.2 Germany Robotic Vision Market by Application
- 9.2.6.1.3 Germany Robotic Vision Market by Industry
- 9.2.6.1.4 Germany Robotic Vision Market by Type
- 9.2.6.1.5 Germany Robotic Vision Market by Deployment
- 9.2.6.2 UK Robotic Vision Market
- 9.2.6.2.1 UK Robotic Vision Market by Component
- 9.2.6.2.2 UK Robotic Vision Market by Application
- 9.2.6.2.3 UK Robotic Vision Market by Industry
- 9.2.6.2.4 UK Robotic Vision Market by Type
- 9.2.6.2.5 UK Robotic Vision Market by Deployment
- 9.2.6.3 France Robotic Vision Market
- 9.2.6.3.1 France Robotic Vision Market by Component
- 9.2.6.3.2 France Robotic Vision Market by Application
- 9.2.6.3.3 France Robotic Vision Market by Industry
- 9.2.6.3.4 France Robotic Vision Market by Type
- 9.2.6.3.5 France Robotic Vision Market by Deployment
- 9.2.6.4 Russia Robotic Vision Market
- 9.2.6.4.1 Russia Robotic Vision Market by Component
- 9.2.6.4.2 Russia Robotic Vision Market by Application
- 9.2.6.4.3 Russia Robotic Vision Market by Industry
- 9.2.6.4.4 Russia Robotic Vision Market by Type
- 9.2.6.4.5 Russia Robotic Vision Market by Deployment
- 9.2.6.5 Spain Robotic Vision Market
- 9.2.6.5.1 Spain Robotic Vision Market by Component
- 9.2.6.5.2 Spain Robotic Vision Market by Application
- 9.2.6.5.3 Spain Robotic Vision Market by Industry
- 9.2.6.5.4 Spain Robotic Vision Market by Type
- 9.2.6.5.5 Spain Robotic Vision Market by Deployment
- 9.2.6.6 Italy Robotic Vision Market
- 9.2.6.6.1 Italy Robotic Vision Market by Component
- 9.2.6.6.2 Italy Robotic Vision Market by Application
- 9.2.6.6.3 Italy Robotic Vision Market by Industry
- 9.2.6.6.4 Italy Robotic Vision Market by Type
- 9.2.6.6.5 Italy Robotic Vision Market by Deployment
- 9.2.6.7 Rest of Europe Robotic Vision Market
- 9.2.6.7.1 Rest of Europe Robotic Vision Market by Component
- 9.2.6.7.2 Rest of Europe Robotic Vision Market by Application
- 9.2.6.7.3 Rest of Europe Robotic Vision Market by Industry
- 9.2.6.7.4 Rest of Europe Robotic Vision Market by Type
- 9.2.6.7.5 Rest of Europe Robotic Vision Market by Deployment
- 9.2.6.1 Germany Robotic Vision Market
- 9.2.1 Europe Robotic Vision Market by Component
- 9.3 Asia Pacific Robotic Vision Market
- 9.3.1 Asia Pacific Robotic Vision Market by Component
- 9.3.1.1 Asia Pacific Hardware Market by Country
- 9.3.1.2 Asia Pacific Software Market by Country
- 9.3.2 Asia Pacific Robotic Vision Market by Application
- 9.3.2.1 Asia Pacific Material Handling Market by Country
- 9.3.2.2 Asia Pacific Packaging & Palletizing Market by Country
- 9.3.2.3 Asia Pacific Assembling & Disassembling Market by Country
- 9.3.2.4 Asia Pacific Painting, Cutting, Pressing, Grinding, & Deburring Market by Country
- 9.3.2.5 Asia Pacific Welding & Soldering Market by Country
- 9.3.2.6 Asia Pacific Measurement, Inspection, & Testing Market by Country
- 9.3.3 Asia Pacific Robotic Vision Market by Industry
- 9.3.3.1 Asia Pacific Electrical & Electronics Market by Country
- 9.3.3.2 Asia Pacific Metals & Machinery Market by Country
- 9.3.3.3 Asia Pacific Precision Engineering & Optics Market by Country
- 9.3.3.4 Asia Pacific Automotive Market by Country
- 9.3.3.5 Asia Pacific Pharmaceuticals & Cosmetics Market by Country
- 9.3.3.6 Asia Pacific Food & Beverages Market by Country
- 9.3.3.7 Asia Pacific Chemical, Rubber, & Plastic Market by Country
- 9.3.3.8 Asia Pacific Other Industry Market by Country
- 9.3.4 Asia Pacific Robotic Vision Market by Type
- 9.3.4.1 Asia Pacific 2D Vision Systems Market by Country
- 9.3.4.2 Asia Pacific 3D Vision Systems Market by Country
- 9.3.5 Asia Pacific Robotic Vision Market by Deployment
- 9.3.5.1 Asia Pacific Robotic Guidance Systems Market by Country
- 9.3.5.2 Asia Pacific Robotic Cells Market by Country
- 9.3.6 Asia Pacific Robotic Vision Market by Country
- 9.3.6.1 China Robotic Vision Market
- 9.3.6.1.1 China Robotic Vision Market by Component
- 9.3.6.1.2 China Robotic Vision Market by Application
- 9.3.6.1.3 China Robotic Vision Market by Industry
- 9.3.6.1.4 China Robotic Vision Market by Type
- 9.3.6.1.5 China Robotic Vision Market by Deployment
- 9.3.6.2 Japan Robotic Vision Market
- 9.3.6.2.1 Japan Robotic Vision Market by Component
- 9.3.6.2.2 Japan Robotic Vision Market by Application
- 9.3.6.2.3 Japan Robotic Vision Market by Industry
- 9.3.6.2.4 Japan Robotic Vision Market by Type
- 9.3.6.2.5 Japan Robotic Vision Market by Deployment
- 9.3.6.3 India Robotic Vision Market
- 9.3.6.3.1 India Robotic Vision Market by Component
- 9.3.6.3.2 India Robotic Vision Market by Application
- 9.3.6.3.3 India Robotic Vision Market by Industry
- 9.3.6.3.4 India Robotic Vision Market by Type
- 9.3.6.3.5 India Robotic Vision Market by Deployment
- 9.3.6.4 South Korea Robotic Vision Market
- 9.3.6.4.1 South Korea Robotic Vision Market by Component
- 9.3.6.4.2 South Korea Robotic Vision Market by Application
- 9.3.6.4.3 South Korea Robotic Vision Market by Industry
- 9.3.6.4.4 South Korea Robotic Vision Market by Type
- 9.3.6.4.5 South Korea Robotic Vision Market by Deployment
- 9.3.6.5 Singapore Robotic Vision Market
- 9.3.6.5.1 Singapore Robotic Vision Market by Component
- 9.3.6.5.2 Singapore Robotic Vision Market by Application
- 9.3.6.5.3 Singapore Robotic Vision Market by Industry
- 9.3.6.5.4 Singapore Robotic Vision Market by Type
- 9.3.6.5.5 Singapore Robotic Vision Market by Deployment
- 9.3.6.6 Malaysia Robotic Vision Market
- 9.3.6.6.1 Malaysia Robotic Vision Market by Component
- 9.3.6.6.2 Malaysia Robotic Vision Market by Application
- 9.3.6.6.3 Malaysia Robotic Vision Market by Industry
- 9.3.6.6.4 Malaysia Robotic Vision Market by Type
- 9.3.6.6.5 Malaysia Robotic Vision Market by Deployment
- 9.3.6.7 Rest of Asia Pacific Robotic Vision Market
- 9.3.6.7.1 Rest of Asia Pacific Robotic Vision Market by Component
- 9.3.6.7.2 Rest of Asia Pacific Robotic Vision Market by Application
- 9.3.6.7.3 Rest of Asia Pacific Robotic Vision Market by Industry
- 9.3.6.7.4 Rest of Asia Pacific Robotic Vision Market by Type
- 9.3.6.7.5 Rest of Asia Pacific Robotic Vision Market by Deployment
- 9.3.6.1 China Robotic Vision Market
- 9.3.1 Asia Pacific Robotic Vision Market by Component
- 9.4 LAMEA Robotic Vision Market
- 9.4.1 LAMEA Robotic Vision Market by Component
- 9.4.1.1 LAMEA Hardware Market by Country
- 9.4.1.2 LAMEA Software Market by Country
- 9.4.2 LAMEA Robotic Vision Market by Application
- 9.4.2.1 LAMEA Material Handling Market by Country
- 9.4.2.2 LAMEA Packaging & Palletizing Market by Country
- 9.4.2.3 LAMEA Assembling & Disassembling Market by Country
- 9.4.2.4 LAMEA Painting, Cutting, Pressing, Grinding, & Deburring Market by Country
- 9.4.2.5 LAMEA Welding & Soldering Market by Country
- 9.4.2.6 LAMEA Measurement, Inspection, & Testing Market by Country
- 9.4.3 LAMEA Robotic Vision Market by Industry
- 9.4.3.1 LAMEA Electrical & Electronics Market by Country
- 9.4.3.2 LAMEA Metals & Machinery Market by Country
- 9.4.3.3 LAMEA Precision Engineering & Optics Market by Country
- 9.4.3.4 LAMEA Automotive Market by Country
- 9.4.3.5 LAMEA Pharmaceuticals & Cosmetics Market by Country
- 9.4.3.6 LAMEA Food & Beverages Market by Country
- 9.4.3.7 LAMEA Chemical, Rubber, & Plastic Market by Country
- 9.4.3.8 LAMEA Other Industry Market by Country
- 9.4.4 LAMEA Robotic Vision Market by Type
- 9.4.4.1 LAMEA 2D Vision Systems Market by Country
- 9.4.4.2 LAMEA 3D Vision Systems Market by Country
- 9.4.5 LAMEA Robotic Vision Market by Deployment
- 9.4.5.1 LAMEA Robotic Guidance Systems Market by Country
- 9.4.5.2 LAMEA Robotic Cells Market by Country
- 9.4.6 LAMEA Robotic Vision Market by Country
- 9.4.6.1 Brazil Robotic Vision Market
- 9.4.6.1.1 Brazil Robotic Vision Market by Component
- 9.4.6.1.2 Brazil Robotic Vision Market by Application
- 9.4.6.1.3 Brazil Robotic Vision Market by Industry
- 9.4.6.1.4 Brazil Robotic Vision Market by Type
- 9.4.6.1.5 Brazil Robotic Vision Market by Deployment
- 9.4.6.2 Argentina Robotic Vision Market
- 9.4.6.2.1 Argentina Robotic Vision Market by Component
- 9.4.6.2.2 Argentina Robotic Vision Market by Application
- 9.4.6.2.3 Argentina Robotic Vision Market by Industry
- 9.4.6.2.4 Argentina Robotic Vision Market by Type
- 9.4.6.2.5 Argentina Robotic Vision Market by Deployment
- 9.4.6.3 UAE Robotic Vision Market
- 9.4.6.3.1 UAE Robotic Vision Market by Component
- 9.4.6.3.2 UAE Robotic Vision Market by Application
- 9.4.6.3.3 UAE Robotic Vision Market by Industry
- 9.4.6.3.4 UAE Robotic Vision Market by Type
- 9.4.6.3.5 UAE Robotic Vision Market by Deployment
- 9.4.6.4 Saudi Arabia Robotic Vision Market
- 9.4.6.4.1 Saudi Arabia Robotic Vision Market by Component
- 9.4.6.4.2 Saudi Arabia Robotic Vision Market by Application
- 9.4.6.4.3 Saudi Arabia Robotic Vision Market by Industry
- 9.4.6.4.4 Saudi Arabia Robotic Vision Market by Type
- 9.4.6.4.5 Saudi Arabia Robotic Vision Market by Deployment
- 9.4.6.5 South Africa Robotic Vision Market
- 9.4.6.5.1 South Africa Robotic Vision Market by Component
- 9.4.6.5.2 South Africa Robotic Vision Market by Application
- 9.4.6.5.3 South Africa Robotic Vision Market by Industry
- 9.4.6.5.4 South Africa Robotic Vision Market by Type
- 9.4.6.5.5 South Africa Robotic Vision Market by Deployment
- 9.4.6.6 Nigeria Robotic Vision Market
- 9.4.6.6.1 Nigeria Robotic Vision Market by Component
- 9.4.6.6.2 Nigeria Robotic Vision Market by Application
- 9.4.6.6.3 Nigeria Robotic Vision Market by Industry
- 9.4.6.6.4 Nigeria Robotic Vision Market by Type
- 9.4.6.6.5 Nigeria Robotic Vision Market by Deployment
- 9.4.6.7 Rest of LAMEA Robotic Vision Market
- 9.4.6.7.1 Rest of LAMEA Robotic Vision Market by Component
- 9.4.6.7.2 Rest of LAMEA Robotic Vision Market by Application
- 9.4.6.7.3 Rest of LAMEA Robotic Vision Market by Industry
- 9.4.6.7.4 Rest of LAMEA Robotic Vision Market by Type
- 9.4.6.7.5 Rest of LAMEA Robotic Vision Market by Deployment
- 9.4.6.1 Brazil Robotic Vision Market
- 9.4.1 LAMEA Robotic Vision Market by Component
Chapter 10. Company Profiles
- 10.1 Cognex Corporation
- 10.1.1 Company Overview
- 10.1.2 Financial Analysis
- 10.1.3 Regional Analysis
- 10.1.4 Research & Development Expense
- 10.1.5 Recent strategies and developments:
- 10.1.5.1 Product Launches and Product Expansions:
- 10.1.5.2 Acquisition and Mergers:
- 10.2 ISRA Vision AG (Atlas Copco)
- 10.2.1 Company Overview
- 10.2.2 Financial Analysis
- 10.2.3 Segmental and Regional Analysis
- 10.2.4 Research & Development Expense
- 10.3 Basler AG
- 10.3.1 Company Overview
- 10.3.2 Financial Analysis
- 10.3.3 Regional Analysis
- 10.3.4 Research & Development Expense
- 10.3.5 Recent strategies and developments:
- 10.3.5.1 Partnerships, Collaborations, and Agreements:
- 10.3.5.2 Product Launches and Product Expansions:
- 10.4 Omron Corporation
- 10.4.1 Company Overview
- 10.4.2 Financial Analysis
- 10.4.3 Segmental and Regional Analysis
- 10.4.4 Research & Development Expenses
- 10.4.5 Recent strategies and developments:
- 10.4.5.1 Partnerships, Collaborations, and Agreements:
- 10.4.5.2 Product Launches and Product Expansions:
- 10.5 National Instruments Corporation
- 10.5.1 Company Overview
- 10.5.2 Financial Analysis
- 10.5.3 Regional Analysis
- 10.5.4 Research & Development Expense
- 10.6 Teledyne Technologies, Inc. (Teledyne DALSA)
- 10.6.1 Company Overview
- 10.6.2 Financial Analysis
- 10.6.3 Segmental and Regional Analysis
- 10.6.4 Research & Development Expenses
- 10.6.5 Recent strategies and developments:
- 10.6.5.1 Partnerships, Collaborations, and Agreements:
- 10.6.5.2 Product Launches and Product Expansions:
- 10.7 Keyence Corporation
- 10.7.1 Company Overview
- 10.7.2 Financial Analysis
- 10.7.3 Regional Analysis
- 10.7.4 Research & Development Expenses
- 10.7.5 Recent strategies and developments:
- 10.7.5.1 Product Launches and Product Expansions:
- 10.7.6 SWOT Analysis
- 10.8 FANUC Corporation
- 10.8.1 Company Overview
- 10.8.2 Financial Analysis
- 10.8.3 Regional Analysis
- 10.8.4 Research & Development Expense
- 10.8.5 Recent strategies and developments:
- 10.8.5.1 Partnerships, Collaborations, and Agreements:
- 10.8.5.2 Product Launches and Product Expansions:
- 10.9 Hexagon AB
- 10.9.1 Company Overview
- 10.9.2 Financial Analysis
- 10.9.3 Regional & Segmental Analysis
- 10.9.4 Research & Development Expenses
- 10.9.5 Recent strategies and developments:
- 10.9.5.1 Partnerships, Collaborations, and Agreements:
- 10.9.5.2 Product Launches and Product Expansions:
- 10.9.5.3 Acquisition and Mergers:
- 10.10. Sick AG
- 10.10.1 Company Overview
- 10.10.2 Financial Analysis
- 10.10.3 Segmental and Regional Analysis
- 10.10.4 Research & Development Expense
- 10.10.5 Recent strategies and developments:
- 10.10.5.1 Partnerships, Collaborations, and Agreements:
- 10.10.5.2 Product Launches and Product Expansions:
- 10.10.6 SWOT Analysis