|
|
市場調査レポート
商品コード
1092386
世界のユーティリティビークル市場の規模・シェア・産業動向 (2022年~2028年):推進区分 (ICエンジン・電気)・車種・用途・地域別Global Utility Vehicle Market Size, Share & Industry Trends Analysis Report By Propulsion (IC Engine Powered, Electric Powered), By Vehicle Type, By Application, By Regional Outlook and Forecast, 2022 - 2028 |
||||||
|
|
|||||||


| 世界のユーティリティビークル市場の規模・シェア・産業動向 (2022年~2028年):推進区分 (ICエンジン・電気)・車種・用途・地域別 |
|
出版日: 2022年04月29日
発行: KBV Research
ページ情報: 英文 244 Pages
納期: 即納可能
|
- 全表示
- 概要
- 図表
- 目次
世界のユーティリティビークルの市場規模は予測期間中9.0%のCAGRで推移し、2028年には461億米ドルの規模に成長すると予測されています。
AWDや4WD車の普及や、UTVなどのユーティリティビークルの使用を奨励する政府の政策などの要因が同市場の成長を推進すると予測されています。また、電気ユーティリティビークルの開発や、ディーラー網の拡大による製品範囲の拡大も参入事業者に有益な成長の見通しをもたらすと期待されています。一方で、自動車の製造・販売台数の減少や、ユーティリティビークルの高いメンテナンスコストが市場成長の妨げとなっています。
当レポートでは、世界のユーティリティビークルの市場を調査し、市場概要、市場成長への各種影響因子の分析、市場規模の推移・予測、各種区分・地域/主要国別の内訳、主要企業のプロファイルなどをまとめています。
目次
第1章 市場範囲・調査手法
第2章 市場概要
- 市場に影響を与える主な要因
第3章 競合分析:世界
- KBVカーディナルマトリックス
- 近年の業界全体での戦略的展開
- 主要成功戦略
第4章 世界のユーティリティビークル市場:推進区分別
- ICエンジン
- 電気
- その他
第5章 世界のユーティリティビークル市場:車種別
- SUV (スポーツユーティリティビークル)
- MUV (マルチユーティリティビークル)
- UTV (ユーティリティテレインビークル)
- その他
第6章 世界のユーティリティビークル市場:用途別
- 乗客輸送
- 産業
- 農業
- スポーツ
- その他
第7章 世界のユーティリティビークル市場:地域別
- 北米
- 欧州
- アジア太平洋
- ラテンアメリカ・中東・アフリカ
第8章 企業プロファイル
- Textron, Inc.
- Polaris, Inc.
- Deere & Company
- Honda Motor Co. Ltd.
- Yamaha Motor Co., Ltd.
- Kawasaki Heavy Industries, Ltd.
- KUBOTA Corporation
- Mahindra & Mahindra Limited(Mahindra Group)
- Zhejiang CFMoto Power Co., Ltd.
- Bombardier Recreational Products, Inc.
LIST OF TABLES
- TABLE 1 Global Utility Vehicle Market, 2018 - 2021, USD Million
- TABLE 2 Global Utility Vehicle Market, 2022 - 2028, USD Million
- TABLE 3 Partnerships, Collaborations and Agreements - Utility Vehicle Market
- TABLE 4 Product Launches And Product Expansions - Utility Vehicle Market
- TABLE 5 Acquisition and Mergers - Utility Vehicle Market
- TABLE 6 Geographcial Expansions - Utility Vehicle Market
- TABLE 7 Global Utility Vehicle Market by Propulsion, 2018 - 2021, USD Million
- TABLE 8 Global Utility Vehicle Market by Propulsion, 2022 - 2028, USD Million
- TABLE 9 Global IC Engine Powered Market by Region, 2018 - 2021, USD Million
- TABLE 10 Global IC Engine Powered Market by Region, 2022 - 2028, USD Million
- TABLE 11 Global Electric Powered Market by Region, 2018 - 2021, USD Million
- TABLE 12 Global Electric Powered Market by Region, 2022 - 2028, USD Million
- TABLE 13 Global Others Market by Region, 2018 - 2021, USD Million
- TABLE 14 Global Others Market by Region, 2022 - 2028, USD Million
- TABLE 15 Global Utility Vehicle Market by Vehicle Type, 2018 - 2021, USD Million
- TABLE 16 Global Utility Vehicle Market by Vehicle Type, 2022 - 2028, USD Million
- TABLE 17 Global Sport Utility Vehicle (SUV) Market by Region, 2018 - 2021, USD Million
- TABLE 18 Global Sport Utility Vehicle (SUV) Market by Region, 2022 - 2028, USD Million
- TABLE 19 Global Multi Utility Vehicle (MUV) Market by Region, 2018 - 2021, USD Million
- TABLE 20 Global Multi Utility Vehicle (MUV) Market by Region, 2022 - 2028, USD Million
- TABLE 21 Global Utility Terrain Vehicle Type (UTV) Market by Region, 2018 - 2021, USD Million
- TABLE 22 Global Utility Terrain Vehicle Type (UTV) Market by Region, 2022 - 2028, USD Million
- TABLE 23 Global Others Market by Region, 2018 - 2021, USD Million
- TABLE 24 Global Others Market by Region, 2022 - 2028, USD Million
- TABLE 25 Global Utility Vehicle Market by Application, 2018 - 2021, USD Million
- TABLE 26 Global Utility Vehicle Market by Application, 2022 - 2028, USD Million
- TABLE 27 Global Passenger Commute Market by Region, 2018 - 2021, USD Million
- TABLE 28 Global Passenger Commute Market by Region, 2022 - 2028, USD Million
- TABLE 29 Global Industrial Market by Region, 2018 - 2021, USD Million
- TABLE 30 Global Industrial Market by Region, 2022 - 2028, USD Million
- TABLE 31 Global Agricultural Market by Region, 2018 - 2021, USD Million
- TABLE 32 Global Agricultural Market by Region, 2022 - 2028, USD Million
- TABLE 33 Global Sports Market by Region, 2018 - 2021, USD Million
- TABLE 34 Global Sports Market by Region, 2022 - 2028, USD Million
- TABLE 35 Global Others Market by Region, 2018 - 2021, USD Million
- TABLE 36 Global Others Market by Region, 2022 - 2028, USD Million
- TABLE 37 Global Utility Vehicle Market by Region, 2018 - 2021, USD Million
- TABLE 38 Global Utility Vehicle Market by Region, 2022 - 2028, USD Million
- TABLE 39 North America Utility Vehicle Market, 2018 - 2021, USD Million
- TABLE 40 North America Utility Vehicle Market, 2022 - 2028, USD Million
- TABLE 41 North America Utility Vehicle Market by Propulsion, 2018 - 2021, USD Million
- TABLE 42 North America Utility Vehicle Market by Propulsion, 2022 - 2028, USD Million
- TABLE 43 North America IC Engine Powered Market by Country, 2018 - 2021, USD Million
- TABLE 44 North America IC Engine Powered Market by Country, 2022 - 2028, USD Million
- TABLE 45 North America Electric Powered Market by Country, 2018 - 2021, USD Million
- TABLE 46 North America Electric Powered Market by Country, 2022 - 2028, USD Million
- TABLE 47 North America Others Market by Country, 2018 - 2021, USD Million
- TABLE 48 North America Others Market by Country, 2022 - 2028, USD Million
- TABLE 49 North America Utility Vehicle Market by Vehicle Type, 2018 - 2021, USD Million
- TABLE 50 North America Utility Vehicle Market by Vehicle Type, 2022 - 2028, USD Million
- TABLE 51 North America Sport Utility Vehicle (SUV) Market by Country, 2018 - 2021, USD Million
- TABLE 52 North America Sport Utility Vehicle (SUV) Market by Country, 2022 - 2028, USD Million
- TABLE 53 North America Multi Utility Vehicle (MUV) Market by Country, 2018 - 2021, USD Million
- TABLE 54 North America Multi Utility Vehicle (MUV) Market by Country, 2022 - 2028, USD Million
- TABLE 55 North America Utility Terrain Vehicle Type (UTV) Market by Country, 2018 - 2021, USD Million
- TABLE 56 North America Utility Terrain Vehicle Type (UTV) Market by Country, 2022 - 2028, USD Million
- TABLE 57 North America Others Market by Country, 2018 - 2021, USD Million
- TABLE 58 North America Others Market by Country, 2022 - 2028, USD Million
- TABLE 59 North America Utility Vehicle Market by Application, 2018 - 2021, USD Million
- TABLE 60 North America Utility Vehicle Market by Application, 2022 - 2028, USD Million
- TABLE 61 North America Passenger Commute Market by Country, 2018 - 2021, USD Million
- TABLE 62 North America Passenger COMMUTE MARKET by Country, 2022 - 2028, USD Million
- TABLE 63 North America Industrial Market by Country, 2018 - 2021, USD Million
- TABLE 64 North America Industrial Market by Country, 2022 - 2028, USD Million
- TABLE 65 North America Agricultural Market by Country, 2018 - 2021, USD Million
- TABLE 66 North America Agricultural Market by Country, 2022 - 2028, USD Million
- TABLE 67 North America Sports Market by Country, 2018 - 2021, USD Million
- TABLE 68 North America Sports Market by Country, 2022 - 2028, USD Million
- TABLE 69 North America Others Market by Country, 2018 - 2021, USD Million
- TABLE 70 North America Others Market by Country, 2022 - 2028, USD Million
- TABLE 71 North America Utility Vehicle Market by Country, 2018 - 2021, USD Million
- TABLE 72 North America Utility Vehicle Market by Country, 2022 - 2028, USD Million
- TABLE 73 US Utility Vehicle Market, 2018 - 2021, USD Million
- TABLE 74 US Utility Vehicle Market, 2022 - 2028, USD Million
- TABLE 75 US Utility Vehicle Market by Propulsion, 2018 - 2021, USD Million
- TABLE 76 US Utility Vehicle Market by Propulsion, 2022 - 2028, USD Million
- TABLE 77 US Utility Vehicle Market by Vehicle Type, 2018 - 2021, USD Million
- TABLE 78 US Utility Vehicle Market by Vehicle Type, 2022 - 2028, USD Million
- TABLE 79 US Utility Vehicle Market by Application, 2018 - 2021, USD Million
- TABLE 80 US Utility Vehicle Market by Application, 2022 - 2028, USD Million
- TABLE 81 Canada Utility Vehicle Market, 2018 - 2021, USD Million
- TABLE 82 Canada Utility Vehicle Market, 2022 - 2028, USD Million
- TABLE 83 Canada Utility Vehicle Market by Propulsion, 2018 - 2021, USD Million
- TABLE 84 Canada Utility Vehicle Market by Propulsion, 2022 - 2028, USD Million
- TABLE 85 Canada Utility Vehicle Market by Vehicle Type, 2018 - 2021, USD Million
- TABLE 86 Canada Utility Vehicle Market by Vehicle Type, 2022 - 2028, USD Million
- TABLE 87 Canada Utility Vehicle Market by Application, 2018 - 2021, USD Million
- TABLE 88 Canada Utility Vehicle Market by Application, 2022 - 2028, USD Million
- TABLE 89 Mexico Utility Vehicle Market, 2018 - 2021, USD Million
- TABLE 90 Mexico Utility Vehicle Market, 2022 - 2028, USD Million
- TABLE 91 Mexico Utility Vehicle Market by Propulsion, 2018 - 2021, USD Million
- TABLE 92 Mexico Utility Vehicle Market by Propulsion, 2022 - 2028, USD Million
- TABLE 93 Mexico Utility Vehicle Market by Vehicle Type, 2018 - 2021, USD Million
- TABLE 94 Mexico Utility Vehicle Market by Vehicle Type, 2022 - 2028, USD Million
- TABLE 95 Mexico Utility Vehicle Market by Application, 2018 - 2021, USD Million
- TABLE 96 Mexico Utility Vehicle Market by Application, 2022 - 2028, USD Million
- TABLE 97 Rest of North America Utility Vehicle Market, 2018 - 2021, USD Million
- TABLE 98 Rest of North America Utility Vehicle Market, 2022 - 2028, USD Million
- TABLE 99 Rest of North America Utility Vehicle Market by Propulsion, 2018 - 2021, USD Million
- TABLE 100 Rest of North America Utility Vehicle Market by Propulsion, 2022 - 2028, USD Million
- TABLE 101 Rest of North America Utility Vehicle Market by Vehicle Type, 2018 - 2021, USD Million
- TABLE 102 Rest of North America Utility Vehicle Market by Vehicle Type, 2022 - 2028, USD Million
- TABLE 103 Rest of North America Utility Vehicle Market by Application, 2018 - 2021, USD Million
- TABLE 104 Rest of North America Utility Vehicle Market by Application, 2022 - 2028, USD Million
- TABLE 105 Europe Utility Vehicle Market, 2018 - 2021, USD Million
- TABLE 106 Europe Utility Vehicle Market, 2022 - 2028, USD Million
- TABLE 107 Europe Utility Vehicle Market by Propulsion, 2018 - 2021, USD Million
- TABLE 108 Europe Utility Vehicle Market by Propulsion, 2022 - 2028, USD Million
- TABLE 109 Europe IC Engine Powered Market by Country, 2018 - 2021, USD Million
- TABLE 110 Europe IC Engine Powered Market by Country, 2022 - 2028, USD Million
- TABLE 111 Europe Electric Powered Market by Country, 2018 - 2021, USD Million
- TABLE 112 Europe Electric Powered Market by Country, 2022 - 2028, USD Million
- TABLE 113 Europe Others Market by Country, 2018 - 2021, USD Million
- TABLE 114 Europe Others Market by Country, 2022 - 2028, USD Million
- TABLE 115 Europe Utility Vehicle Market by Vehicle Type, 2018 - 2021, USD Million
- TABLE 116 Europe Utility Vehicle Market by Vehicle Type, 2022 - 2028, USD Million
- TABLE 117 Europe Sport Utility Vehicle (SUV) Market by Country, 2018 - 2021, USD Million
- TABLE 118 Europe Sport Utility Vehicle (SUV) Market by Country, 2022 - 2028, USD Million
- TABLE 119 Europe Multi Utility Vehicle (MUV) Market by Country, 2018 - 2021, USD Million
- TABLE 120 Europe Multi Utility Vehicle (MUV) Market by Country, 2022 - 2028, USD Million
- TABLE 121 Europe Utility Terrain Vehicle Type (UTV) Market by Country, 2018 - 2021, USD Million
- TABLE 122 Europe Utility Terrain Vehicle Type (UTV) Market by Country, 2022 - 2028, USD Million
- TABLE 123 Europe Others Market by Country, 2018 - 2021, USD Million
- TABLE 124 Europe Others Market by Country, 2022 - 2028, USD Million
- TABLE 125 Europe Utility Vehicle Market by Application, 2018 - 2021, USD Million
- TABLE 126 Europe Utility Vehicle Market by Application, 2022 - 2028, USD Million
- TABLE 127 Europe Passenger Commute Market by Country, 2018 - 2021, USD Million
- TABLE 128 Europe Passenger Commute Market by Country, 2022 - 2028, USD Million
- TABLE 129 Europe Industrial Market by Country, 2018 - 2021, USD Million
- TABLE 130 Europe Industrial Market by Country, 2022 - 2028, USD Million
- TABLE 131 Europe Agricultural Market by Country, 2018 - 2021, USD Million
- TABLE 132 Europe Agricultural Market by Country, 2022 - 2028, USD Million
- TABLE 133 Europe Sports Market by Country, 2018 - 2021, USD Million
- TABLE 134 Europe Sports Market by Country, 2022 - 2028, USD Million
- TABLE 135 Europe Others Market by Country, 2018 - 2021, USD Million
- TABLE 136 Europe Others Market by Country, 2022 - 2028, USD Million
- TABLE 137 Europe Utility Vehicle Market by Country, 2018 - 2021, USD Million
- TABLE 138 Europe Utility Vehicle Market by Country, 2022 - 2028, USD Million
- TABLE 139 Germany Utility Vehicle Market, 2018 - 2021, USD Million
- TABLE 140 Germany Utility Vehicle Market, 2022 - 2028, USD Million
- TABLE 141 Germany Utility Vehicle Market by Propulsion, 2018 - 2021, USD Million
- TABLE 142 Germany Utility Vehicle Market by Propulsion, 2022 - 2028, USD Million
- TABLE 143 Germany Utility Vehicle Market by Vehicle Type, 2018 - 2021, USD Million
- TABLE 144 Germany Utility Vehicle Market by Vehicle Type, 2022 - 2028, USD Million
- TABLE 145 Germany Utility Vehicle Market by Application, 2018 - 2021, USD Million
- TABLE 146 Germany Utility Vehicle Market by Application, 2022 - 2028, USD Million
- TABLE 147 UK Utility Vehicle Market, 2018 - 2021, USD Million
- TABLE 148 UK Utility Vehicle Market, 2022 - 2028, USD Million
- TABLE 149 UK Utility Vehicle Market by Propulsion, 2018 - 2021, USD Million
- TABLE 150 UK Utility Vehicle Market by Propulsion, 2022 - 2028, USD Million
- TABLE 151 UK Utility Vehicle Market by Vehicle Type, 2018 - 2021, USD Million
- TABLE 152 UK Utility Vehicle Market by Vehicle Type, 2022 - 2028, USD Million
- TABLE 153 UK Utility Vehicle Market by Application, 2018 - 2021, USD Million
- TABLE 154 UK Utility Vehicle Market by Application, 2022 - 2028, USD Million
- TABLE 155 France Utility Vehicle Market, 2018 - 2021, USD Million
- TABLE 156 France Utility Vehicle Market, 2022 - 2028, USD Million
- TABLE 157 France Utility Vehicle Market by Propulsion, 2018 - 2021, USD Million
- TABLE 158 France Utility Vehicle Market by Propulsion, 2022 - 2028, USD Million
- TABLE 159 France Utility Vehicle Market by Vehicle Type, 2018 - 2021, USD Million
- TABLE 160 France Utility Vehicle Market by Vehicle Type, 2022 - 2028, USD Million
- TABLE 161 France Utility Vehicle Market by Application, 2018 - 2021, USD Million
- TABLE 162 France Utility Vehicle Market by Application, 2022 - 2028, USD Million
- TABLE 163 Russia Utility Vehicle Market, 2018 - 2021, USD Million
- TABLE 164 Russia Utility Vehicle Market, 2022 - 2028, USD Million
- TABLE 165 Russia Utility Vehicle Market by Propulsion, 2018 - 2021, USD Million
- TABLE 166 Russia Utility Vehicle Market by Propulsion, 2022 - 2028, USD Million
- TABLE 167 Russia Utility Vehicle Market by Vehicle Type, 2018 - 2021, USD Million
- TABLE 168 Russia Utility Vehicle Market by Vehicle Type, 2022 - 2028, USD Million
- TABLE 169 Russia Utility Vehicle Market by Application, 2018 - 2021, USD Million
- TABLE 170 Russia Utility Vehicle Market by Application, 2022 - 2028, USD Million
- TABLE 171 Spain Utility Vehicle Market, 2018 - 2021, USD Million
- TABLE 172 Spain Utility Vehicle Market, 2022 - 2028, USD Million
- TABLE 173 Spain Utility Vehicle Market by Propulsion, 2018 - 2021, USD Million
- TABLE 174 Spain Utility Vehicle Market by Propulsion, 2022 - 2028, USD Million
- TABLE 175 Spain Utility Vehicle Market by Vehicle Type, 2018 - 2021, USD Million
- TABLE 176 Spain Utility Vehicle Market by Vehicle Type, 2022 - 2028, USD Million
- TABLE 177 Spain Utility Vehicle Market by Application, 2018 - 2021, USD Million
- TABLE 178 Spain Utility Vehicle Market by Application, 2022 - 2028, USD Million
- TABLE 179 Italy Utility Vehicle Market, 2018 - 2021, USD Million
- TABLE 180 Italy Utility Vehicle Market, 2022 - 2028, USD Million
- TABLE 181 Italy Utility Vehicle Market by Propulsion, 2018 - 2021, USD Million
- TABLE 182 Italy Utility Vehicle Market by Propulsion, 2022 - 2028, USD Million
- TABLE 183 Italy Utility Vehicle Market by Vehicle Type, 2018 - 2021, USD Million
- TABLE 184 Italy Utility Vehicle Market by Vehicle Type, 2022 - 2028, USD Million
- TABLE 185 Italy Utility Vehicle Market by Application, 2018 - 2021, USD Million
- TABLE 186 Italy Utility Vehicle Market by Application, 2022 - 2028, USD Million
- TABLE 187 Rest of Europe Utility Vehicle Market, 2018 - 2021, USD Million
- TABLE 188 Rest of Europe Utility Vehicle Market, 2022 - 2028, USD Million
- TABLE 189 Rest of Europe Utility Vehicle Market by Propulsion, 2018 - 2021, USD Million
- TABLE 190 Rest of Europe Utility Vehicle Market by Propulsion, 2022 - 2028, USD Million
- TABLE 191 Rest of Europe Utility Vehicle Market by Vehicle Type, 2018 - 2021, USD Million
- TABLE 192 Rest of Europe Utility Vehicle Market by Vehicle Type, 2022 - 2028, USD Million
- TABLE 193 Rest of Europe Utility Vehicle Market by Application, 2018 - 2021, USD Million
- TABLE 194 Rest of Europe Utility Vehicle Market by Application, 2022 - 2028, USD Million
- TABLE 195 Asia Pacific Utility Vehicle Market, 2018 - 2021, USD Million
- TABLE 196 Asia Pacific Utility Vehicle Market, 2022 - 2028, USD Million
- TABLE 197 Asia Pacific Utility Vehicle Market by Propulsion, 2018 - 2021, USD Million
- TABLE 198 Asia Pacific Utility Vehicle Market by Propulsion, 2022 - 2028, USD Million
- TABLE 199 Asia Pacific IC Engine Powered Market by Country, 2018 - 2021, USD Million
- TABLE 200 Asia Pacific IC Engine Powered Market by Country, 2022 - 2028, USD Million
- TABLE 201 Asia Pacific Electric Powered Market by Country, 2018 - 2021, USD Million
- TABLE 202 Asia Pacific Electric Powered Market by Country, 2022 - 2028, USD Million
- TABLE 203 Asia Pacific Others Market by Country, 2018 - 2021, USD Million
- TABLE 204 Asia Pacific Others Market by Country, 2022 - 2028, USD Million
- TABLE 205 Asia Pacific Utility Vehicle Market by Vehicle Type, 2018 - 2021, USD Million
- TABLE 206 Asia Pacific Utility Vehicle Market by Vehicle Type, 2022 - 2028, USD Million
- TABLE 207 Asia Pacific Sport Utility Vehicle (SUV) Market by Country, 2018 - 2021, USD Million
- TABLE 208 Asia Pacific Sport Utility Vehicle (SUV) Market by Country, 2022 - 2028, USD Million
- TABLE 209 Asia Pacific Multi Utility Vehicle (MUV) Market by Country, 2018 - 2021, USD Million
- TABLE 210 Asia Pacific Multi Utility Vehicle (MUV) Market by Country, 2022 - 2028, USD Million
- TABLE 211 Asia Pacific Utility Terrain Vehicle Type (UTV) Market by Country, 2018 - 2021, USD Million
- TABLE 212 Asia Pacific Utility Terrain Vehicle Type (UTV) Market by Country, 2022 - 2028, USD Million
- TABLE 213 Asia Pacific Others Market by Country, 2018 - 2021, USD Million
- TABLE 214 Asia Pacific Others Market by Country, 2022 - 2028, USD Million
- TABLE 215 Asia Pacific Utility Vehicle Market by Application, 2018 - 2021, USD Million
- TABLE 216 Asia Pacific Utility Vehicle Market by Application, 2022 - 2028, USD Million
- TABLE 217 Asia Pacific Passenger Commute Market by Country, 2018 - 2021, USD Million
- TABLE 218 Asia Pacific Passenger Commute Market by Country, 2022 - 2028, USD Million
- TABLE 219 Asia Pacific Industrial Market by Country, 2018 - 2021, USD Million
- TABLE 220 Asia Pacific Industrial Market by Country, 2022 - 2028, USD Million
- TABLE 221 Asia Pacific Agricultural Market by Country, 2018 - 2021, USD Million
- TABLE 222 Asia Pacific Agricultural Market by Country, 2022 - 2028, USD Million
- TABLE 223 Asia Pacific Sports Market by Country, 2018 - 2021, USD Million
- TABLE 224 Asia Pacific Sports Market by Country, 2022 - 2028, USD Million
- TABLE 225 Asia Pacific Others Market by Country, 2018 - 2021, USD Million
- TABLE 226 Asia Pacific Others Market by Country, 2022 - 2028, USD Million
- TABLE 227 Asia Pacific Utility Vehicle Market by Country, 2018 - 2021, USD Million
- TABLE 228 Asia Pacific Utility Vehicle Market by Country, 2022 - 2028, USD Million
- TABLE 229 China Utility Vehicle Market, 2018 - 2021, USD Million
- TABLE 230 China Utility Vehicle Market, 2022 - 2028, USD Million
- TABLE 231 China Utility Vehicle Market by Propulsion, 2018 - 2021, USD Million
- TABLE 232 China Utility Vehicle Market by Propulsion, 2022 - 2028, USD Million
- TABLE 233 China Utility Vehicle Market by Vehicle Type, 2018 - 2021, USD Million
- TABLE 234 China Utility Vehicle Market by Vehicle Type, 2022 - 2028, USD Million
- TABLE 235 China Utility Vehicle Market by Application, 2018 - 2021, USD Million
- TABLE 236 China Utility Vehicle Market by Application, 2022 - 2028, USD Million
- TABLE 237 Japan Utility Vehicle Market, 2018 - 2021, USD Million
- TABLE 238 Japan Utility Vehicle Market, 2022 - 2028, USD Million
- TABLE 239 Japan Utility Vehicle Market by Propulsion, 2018 - 2021, USD Million
- TABLE 240 Japan Utility Vehicle Market by Propulsion, 2022 - 2028, USD Million
- TABLE 241 Japan Utility Vehicle Market by Vehicle Type, 2018 - 2021, USD Million
- TABLE 242 Japan Utility Vehicle Market by Vehicle Type, 2022 - 2028, USD Million
- TABLE 243 Japan Utility Vehicle Market by Application, 2018 - 2021, USD Million
- TABLE 244 Japan Utility Vehicle Market by Application, 2022 - 2028, USD Million
- TABLE 245 India Utility Vehicle Market, 2018 - 2021, USD Million
- TABLE 246 India Utility Vehicle Market, 2022 - 2028, USD Million
- TABLE 247 India Utility Vehicle Market by Propulsion, 2018 - 2021, USD Million
- TABLE 248 India Utility Vehicle Market by Propulsion, 2022 - 2028, USD Million
- TABLE 249 India Utility Vehicle Market by Vehicle Type, 2018 - 2021, USD Million
- TABLE 250 India Utility Vehicle Market by Vehicle Type, 2022 - 2028, USD Million
- TABLE 251 India Utility Vehicle Market by Application, 2018 - 2021, USD Million
- TABLE 252 India Utility Vehicle Market by Application, 2022 - 2028, USD Million
- TABLE 253 South Korea Utility Vehicle Market, 2018 - 2021, USD Million
- TABLE 254 South Korea Utility Vehicle Market, 2022 - 2028, USD Million
- TABLE 255 South Korea Utility Vehicle Market by Propulsion, 2018 - 2021, USD Million
- TABLE 256 South Korea Utility Vehicle Market by Propulsion, 2022 - 2028, USD Million
- TABLE 257 South Korea Utility Vehicle Market by Vehicle Type, 2018 - 2021, USD Million
- TABLE 258 South Korea Utility Vehicle Market by Vehicle Type, 2022 - 2028, USD Million
- TABLE 259 South Korea Utility Vehicle Market by Application, 2018 - 2021, USD Million
- TABLE 260 South Korea Utility Vehicle Market by Application, 2022 - 2028, USD Million
- TABLE 261 Singapore Utility Vehicle Market, 2018 - 2021, USD Million
- TABLE 262 Singapore Utility Vehicle Market, 2022 - 2028, USD Million
- TABLE 263 Singapore Utility Vehicle Market by Propulsion, 2018 - 2021, USD Million
- TABLE 264 Singapore Utility Vehicle Market by Propulsion, 2022 - 2028, USD Million
- TABLE 265 Singapore Utility Vehicle Market by Vehicle Type, 2018 - 2021, USD Million
- TABLE 266 Singapore Utility Vehicle Market by Vehicle Type, 2022 - 2028, USD Million
- TABLE 267 Singapore Utility Vehicle Market by Application, 2018 - 2021, USD Million
- TABLE 268 Singapore Utility Vehicle Market by Application, 2022 - 2028, USD Million
- TABLE 269 Malaysia Utility Vehicle Market, 2018 - 2021, USD Million
- TABLE 270 Malaysia Utility Vehicle Market, 2022 - 2028, USD Million
- TABLE 271 Malaysia Utility Vehicle Market by Propulsion, 2018 - 2021, USD Million
- TABLE 272 Malaysia Utility Vehicle Market by Propulsion, 2022 - 2028, USD Million
- TABLE 273 Malaysia Utility Vehicle Market by Vehicle Type, 2018 - 2021, USD Million
- TABLE 274 Malaysia Utility Vehicle Market by Vehicle Type, 2022 - 2028, USD Million
- TABLE 275 Malaysia Utility Vehicle Market by Application, 2018 - 2021, USD Million
- TABLE 276 Malaysia Utility Vehicle Market by Application, 2022 - 2028, USD Million
- TABLE 277 Rest of Asia Pacific Utility Vehicle Market, 2018 - 2021, USD Million
- TABLE 278 Rest of Asia Pacific Utility Vehicle Market, 2022 - 2028, USD Million
- TABLE 279 Rest of Asia Pacific Utility Vehicle Market by Propulsion, 2018 - 2021, USD Million
- TABLE 280 Rest of Asia Pacific Utility Vehicle Market by Propulsion, 2022 - 2028, USD Million
- TABLE 281 Rest of Asia Pacific Utility Vehicle Market by Vehicle Type, 2018 - 2021, USD Million
- TABLE 282 Rest of Asia Pacific Utility Vehicle Market by Vehicle Type, 2022 - 2028, USD Million
- TABLE 283 Rest of Asia Pacific Utility Vehicle Market by Application, 2018 - 2021, USD Million
- TABLE 284 Rest of Asia Pacific Utility Vehicle Market by Application, 2022 - 2028, USD Million
- TABLE 285 LAMEA Utility Vehicle Market, 2018 - 2021, USD Million
- TABLE 286 LAMEA Utility Vehicle Market, 2022 - 2028, USD Million
- TABLE 287 LAMEA Utility Vehicle Market by Propulsion, 2018 - 2021, USD Million
- TABLE 288 LAMEA Utility Vehicle Market by Propulsion, 2022 - 2028, USD Million
- TABLE 289 LAMEA IC Engine Powered Market by Country, 2018 - 2021, USD Million
- TABLE 290 LAMEA IC Engine Powered Market by Country, 2022 - 2028, USD Million
- TABLE 291 LAMEA Electric Powered Market by Country, 2018 - 2021, USD Million
- TABLE 292 LAMEA Electric Powered Market by Country, 2022 - 2028, USD Million
- TABLE 293 LAMEA Others Market by Country, 2018 - 2021, USD Million
- TABLE 294 LAMEA Others Market by Country, 2022 - 2028, USD Million
- TABLE 295 LAMEA Utility Vehicle Market by Vehicle Type, 2018 - 2021, USD Million
- TABLE 296 LAMEA Utility Vehicle Market by Vehicle Type, 2022 - 2028, USD Million
- TABLE 297 LAMEA Sport Utility Vehicle (SUV) Market by Country, 2018 - 2021, USD Million
- TABLE 298 LAMEA Sport Utility Vehicle (SUV) Market by Country, 2022 - 2028, USD Million
- TABLE 299 LAMEA Multi Utility Vehicle (MUV) Market by Country, 2018 - 2021, USD Million
- TABLE 300 LAMEA Multi Utility Vehicle (MUV) Market by Country, 2022 - 2028, USD Million
- TABLE 301 LAMEA Utility Terrain Vehicle Type (UTV) Market by Country, 2018 - 2021, USD Million
- TABLE 302 LAMEA Utility Terrain Vehicle Type (UTV) Market by Country, 2022 - 2028, USD Million
- TABLE 303 LAMEA Others Market by Country, 2018 - 2021, USD Million
- TABLE 304 LAMEA Others Market by Country, 2022 - 2028, USD Million
- TABLE 305 LAMEA Utility Vehicle Market by Application, 2018 - 2021, USD Million
- TABLE 306 LAMEA Utility Vehicle Market by Application, 2022 - 2028, USD Million
- TABLE 307 LAMEA Passenger Commute Market by Country, 2018 - 2021, USD Million
- TABLE 308 LAMEA Passenger Commute Market by Country, 2022 - 2028, USD Million
- TABLE 309 LAMEA Industrial Market by Country, 2018 - 2021, USD Million
- TABLE 310 LAMEA Industrial Market by Country, 2022 - 2028, USD Million
- TABLE 311 LAMEA Agricultural Market by Country, 2018 - 2021, USD Million
- TABLE 312 LAMEA Agricultural Market by Country, 2022 - 2028, USD Million
- TABLE 313 LAMEA Sports Market by Country, 2018 - 2021, USD Million
- TABLE 314 LAMEA Sports Market by Country, 2022 - 2028, USD Million
- TABLE 315 LAMEA Others Market by Country, 2018 - 2021, USD Million
- TABLE 316 LAMEA Others Market by Country, 2022 - 2028, USD Million
- TABLE 317 LAMEA Utility Vehicle Market by Country, 2018 - 2021, USD Million
- TABLE 318 LAMEA Utility Vehicle Market by Country, 2022 - 2028, USD Million
- TABLE 319 Brazil Utility Vehicle Market, 2018 - 2021, USD Million
- TABLE 320 Brazil Utility Vehicle Market, 2022 - 2028, USD Million
- TABLE 321 Brazil Utility Vehicle Market by Propulsion, 2018 - 2021, USD Million
- TABLE 322 Brazil Utility Vehicle Market by Propulsion, 2022 - 2028, USD Million
- TABLE 323 Brazil Utility Vehicle Market by Vehicle Type, 2018 - 2021, USD Million
- TABLE 324 Brazil Utility Vehicle Market by Vehicle Type, 2022 - 2028, USD Million
- TABLE 325 Brazil Utility Vehicle Market by Application, 2018 - 2021, USD Million
- TABLE 326 Brazil Utility Vehicle Market by Application, 2022 - 2028, USD Million
- TABLE 327 Argentina Utility Vehicle Market, 2018 - 2021, USD Million
- TABLE 328 Argentina Utility Vehicle Market, 2022 - 2028, USD Million
- TABLE 329 Argentina Utility Vehicle Market by Propulsion, 2018 - 2021, USD Million
- TABLE 330 Argentina Utility Vehicle Market by Propulsion, 2022 - 2028, USD Million
- TABLE 331 Argentina Utility Vehicle Market by Vehicle Type, 2018 - 2021, USD Million
- TABLE 332 Argentina Utility Vehicle Market by Vehicle Type, 2022 - 2028, USD Million
- TABLE 333 Argentina Utility Vehicle Market by Application, 2018 - 2021, USD Million
- TABLE 334 Argentina Utility Vehicle Market by Application, 2022 - 2028, USD Million
- TABLE 335 UAE Utility Vehicle Market, 2018 - 2021, USD Million
- TABLE 336 UAE Utility Vehicle Market, 2022 - 2028, USD Million
- TABLE 337 UAE Utility Vehicle Market by Propulsion, 2018 - 2021, USD Million
- TABLE 338 UAE Utility Vehicle Market by Propulsion, 2022 - 2028, USD Million
- TABLE 339 UAE Utility Vehicle Market by Vehicle Type, 2018 - 2021, USD Million
- TABLE 340 UAE Utility Vehicle Market by Vehicle Type, 2022 - 2028, USD Million
- TABLE 341 UAE Utility Vehicle Market by Application, 2018 - 2021, USD Million
- TABLE 342 UAE Utility Vehicle Market by Application, 2022 - 2028, USD Million
- TABLE 343 Saudi Arabia Utility Vehicle Market, 2018 - 2021, USD Million
- TABLE 344 Saudi Arabia Utility Vehicle Market, 2022 - 2028, USD Million
- TABLE 345 Saudi Arabia Utility Vehicle Market by Propulsion, 2018 - 2021, USD Million
- TABLE 346 Saudi Arabia Utility Vehicle Market by Propulsion, 2022 - 2028, USD Million
- TABLE 347 Saudi Arabia Utility Vehicle Market by Vehicle Type, 2018 - 2021, USD Million
- TABLE 348 Saudi Arabia Utility Vehicle Market by Vehicle Type, 2022 - 2028, USD Million
- TABLE 349 Saudi Arabia Utility Vehicle Market by Application, 2018 - 2021, USD Million
- TABLE 350 Saudi Arabia Utility Vehicle Market by Application, 2022 - 2028, USD Million
- TABLE 351 South Africa Utility Vehicle Market, 2018 - 2021, USD Million
- TABLE 352 South Africa Utility Vehicle Market, 2022 - 2028, USD Million
- TABLE 353 South Africa Utility Vehicle Market by Propulsion, 2018 - 2021, USD Million
- TABLE 354 South Africa Utility Vehicle Market by Propulsion, 2022 - 2028, USD Million
- TABLE 355 South Africa Utility Vehicle Market by Vehicle Type, 2018 - 2021, USD Million
- TABLE 356 South Africa Utility Vehicle Market by Vehicle Type, 2022 - 2028, USD Million
- TABLE 357 South Africa Utility Vehicle Market by Application, 2018 - 2021, USD Million
- TABLE 358 South Africa Utility Vehicle Market by Application, 2022 - 2028, USD Million
- TABLE 359 Nigeria Utility Vehicle Market, 2018 - 2021, USD Million
- TABLE 360 Nigeria Utility Vehicle Market, 2022 - 2028, USD Million
- TABLE 361 Nigeria Utility Vehicle Market by Propulsion, 2018 - 2021, USD Million
- TABLE 362 Nigeria Utility Vehicle Market by Propulsion, 2022 - 2028, USD Million
- TABLE 363 Nigeria Utility Vehicle Market by Vehicle Type, 2018 - 2021, USD Million
- TABLE 364 Nigeria Utility Vehicle Market by Vehicle Type, 2022 - 2028, USD Million
- TABLE 365 Nigeria Utility Vehicle Market by Application, 2018 - 2021, USD Million
- TABLE 366 Nigeria Utility Vehicle Market by Application, 2022 - 2028, USD Million
- TABLE 367 Rest of LAMEA Utility Vehicle Market, 2018 - 2021, USD Million
- TABLE 368 Rest of LAMEA Utility Vehicle Market, 2022 - 2028, USD Million
- TABLE 369 Rest of LAMEA Utility Vehicle Market by Propulsion, 2018 - 2021, USD Million
- TABLE 370 Rest of LAMEA Utility Vehicle Market by Propulsion, 2022 - 2028, USD Million
- TABLE 371 Rest of LAMEA Utility Vehicle Market by Vehicle Type, 2018 - 2021, USD Million
- TABLE 372 Rest of LAMEA Utility Vehicle Market by Vehicle Type, 2022 - 2028, USD Million
- TABLE 373 Rest of LAMEA Utility Vehicle Market by Application, 2018 - 2021, USD Million
- TABLE 374 Rest of LAMEA Utility Vehicle Market by Application, 2022 - 2028, USD Million
- TABLE 375 Key information - Textron, Inc.
- TABLE 376 Key information - Polaris, Inc.
- TABLE 377 Key information - Deere & Company
- TABLE 378 key Information - Honda Motor Co. Ltd.
- TABLE 379 Key Information - Yamaha Motor Co., Ltd.
- TABLE 380 Key Information - Kawasaki Heavy Industries, Ltd.
- TABLE 381 Key Information - KUBOTA Corporation
- TABLE 382 key Information - Mahindra & Mahindra Limited
- TABLE 383 Key information - Zhejiang CFMoto Power Co., Ltd.
- TABLE 384 Key information - Bombardier Recreational Products, Inc.
List of Figures
- FIG 1 Methodology for the research
- FIG 2 KBV Cardinal Matrix
- FIG 3 Key Leading Strategies: Percentage Distribution (2018-2022)
- FIG 4 Key Strategic Move: (Partnerships, Collaborations and Agreements: 2018, Jan - 2022, Apr) Leading Players
- FIG 5 Global Utility Vehicle Market Share by Propulsion, 2021
- FIG 6 Global Utility Vehicle Market Share by Propulsion, 2028
- FIG 7 Global Utility Vehicle Market by Propulsion, 2018 - 2028, USD Million
- FIG 8 Global Utility Vehicle Market Share by Vehicle Type, 2021
- FIG 9 Global Utility Vehicle Market Share by Vehicle Type, 2028
- FIG 10 Global Utility Vehicle Market by Vehicle Type, 2018 - 2028, USD Million
- FIG 11 Global Utility Vehicle Market Share by Application, 2021
- FIG 12 Global Utility Vehicle Market Share by Application, 2028
- FIG 13 Global Utility Vehicle Market by Application, 2018 - 2028, USD Million
- FIG 14 Global Utility Vehicle Market Share by Region, 2021
- FIG 15 Global Utility Vehicle Market Share by Region, 2028
- FIG 16 Global Utility Vehicle Market by Region, 2018 - 2028, USD Million
- FIG 17 Recent strategies and developments: Polaris, Inc.
- FIG 18 Recent strategies and developments: Deere & Company
- FIG 19 SWOT ANALYSIS: HONDA MOTORS CO. LTD.
- FIG 20 Recent strategies and developments: KUBOTA Corporation
- FIG 21 Recent strategies and developments: Zhejiang CFMoto Power Co., Ltd.
The Global Utility Vehicle Market size is expected to reach $46.1 billion by 2028, rising at a market growth of 9.0% CAGR during the forecast period.
A utility vehicle is a vehicle that is built to fulfill a certain duty while also being able to operate on tough terrain. Utility vehicles are used for both passenger & utility commutes and offer several advantages over passenger vehicles, comprising increased passenger capacity, increased cargo-carrying capacity, greater safety and comfort, and so on. To meet operational needs, the majority of utility vehicles are equipped with an all-wheel-drive (AWD) or four-wheel drive (4WD). Utility vehicles are used in a broad array of industries, including transportation of commodities, agricultural uses, passenger commuting solutions, and more. Electric-powered utility vehicles have gained popularity in recent years due to their fuel-efficient operations and great noise reduction.
A utility terrain vehicle is a motorized vehicle that is specially built to perform a specific task more efficiently than a general-purpose vehicle or a passenger vehicle. Side by side (S-X-S), recreational off-highway vehicle (ROV), & multipurpose off-highway utility vehicle are all terms used to describe utility terrain vehicles (MOHUV). A utility terrain vehicle (UTV) is an off-road vehicle with seating for two to six people. It's made for harder terrain, towing, and other work that requires a workhorse. In the forest services, utility terrain vehicles are becoming popular for leisure activities such as trail maintenance, planned burning operations, & pesticide applications. A roll-over safety system, along with windshields, hardtops, and cab enclosures, are standard on the majority of utility vehicles. UTVs are becoming more popular in sports as trailing adventures & racing events become more prominent.
The utility vehicle market is predicted to rise as a result of factors such as increased penetration of AWD & 4WD cars, as well as government policies to encourage the use of utility vehicles like as UTVs on the road. The market's growth is hampered by a drop in car production and sales, as well as the high maintenance costs of utility vehicles. On the other hand, the development of electric utility vehicles & the expansion of dealer networks to increase product reach is expected to provide profitable growth prospects for market players.
COVID-19 Impact
Due to commuting limits & predicted dismal financial performance of market players in 2021, the outbreak of the COVID-19 pandemic has had a detrimental impact on the utility vehicle industry. It has had an impact on the economy as a whole, as well as contributors, like market players who are developing smart cost-cutting initiatives. Supply chain execution, regulatory and policy changes, labor dependency, working capital management, liquidity, and solvency management are the primary risk considerations for utility vehicle industry participants. Due to commuting limits, personnel unavailability, and a shortage of raw materials caused by supply chain disruption, most utility vehicle manufacturing facilities were shut down during the pandemic.
Market Growth Factors
Increased adoption of Sports Utility Vehicle (SUVs)
SUVs (Sports Utility Vehicles) are vehicles that are meant to be taller and more upright. Taller windows and a higher seating position improve sight from the driver's (and passengers') seat in this style. Drivers have a greater vision of the road ahead as well as the vehicle's sides and back. Typical sightline impediments, such as the automobile next to a person that drew up too close at the stop signal, are often easily seen by drivers. This allows the driver to double-check that there isn't a car approaching before turning right. Clear sight also provides confidence when changing lanes on the interstate, finding open parking spaces, and spotting potholes in time to avoid them. Some SUVs have much more features to help drivers see better.
Increasing demand for electric utility vehicles
In nowadays, with the increasing inflation all over the world, the prices of fuels, like petrol and diesel, is on a rise. Due to this, preference of people is being shifted toward electric vehicles. It is a more affordable alternate of gasoline and diesel-based utility vehicles. In terms of technological evolution, all mobility options have undergone significant changes in recent years. Due to their output efficiency and lightweight, market players are depending on electrical components to meet changing consumer needs, resulting in the development of electric-driven utility vehicle solutions. Additionally, car emissions are a critical aspect since hazardous greenhouse gases are released due to it, raising environmental & health concerns.
Market Restraining Factors
High accident rates & consequent legislation
Customers & OEMs are primarily concerned about passenger and vehicle safety. Vehicle safety is a priority for regulatory authorities around the world. Drivers of all-terrain vehicles are frequently required to monitor speed, navigation, and other data. Any operator distraction or ignorance could result in a major mishap. When an all-terrain vehicle flips or rolls over, the most common reasons of it are either ignorance or distraction. Accidents involving UTVs are becoming common across the world. They're not allowed to be used on public roads and highways in most cases. A UTV may reach speeds of up to 75 mph depending on the weather and where it is driven.
Propulsion Outlook
Based on Propulsion, the market is segmented into IC Engine Powered, Electric Powered, and Others. The IC engine powered segment acquired the highest revenue share in the utility vehicle market in 2021. The constantly rising growth of this segment is due to the availability of a fleet around the globe as well as its cost-effective solution. Moreover, the IC engine powered utility vehicles are observing higher demand due to the fact that these vehicles have robust power and can transport a significant amount of load in one go.
Vehicle Type Outlook
Based on Vehicle Type, the market is segmented into Sport Utility Vehicle (SUV), Multi Utility Vehicle (MUV), Utility Terrain Vehicle Type (UTV), and Others. The Multi-Utility Vehicle segment garnered a significant revenue share in the utility vehicle market in 2021. Multi-utility vehicles refer to vehicles that can be used for a variety of purposes. This vehicle is primarily intended to transport a large number of people. These utility vehicles are gaining popularity all across the world. It's primarily due to the convenience they provide in terms of carrying capacity, whether it's for people or freight. A Multi Utility Vehicle often features two or three rows of seats that may accommodate 6 to 8 passengers. This is the vehicle's most significant benefit. Moreover, they offer a flexible internal space that can be altered to meet the needs of the customer. A user can fold some of the seats if there is a need to transport more cargo. As a result, the passenger will have ample room to store all of their belongings. Additionally, the upright design style makes the inside feel wider and more open.
Application Outlook
Based on Application, the market is segmented into Passenger Commute, Industrial, Agricultural, Sports, and Others. Passenger Commute segment acquired the highest revenue share in the utility vehicle market in 2021. The rising growth of this segment is owing to the rapidly rising prices of fuels across the world. Passenger Commute is when a person travels from their home to their workplace or school on a regular basis, leaving the confines of the place they live in. It can also refer to any regular or frequently recurring travel between areas, even if it is not tied to employment. Due to increased fuel prices, more people are preferring public commutes instead of private vehicles.
Regional Outlook
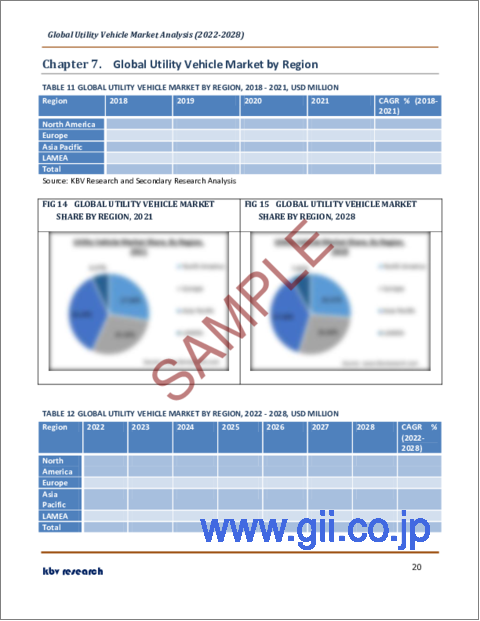
Based on Regions, the market is segmented into North America, Europe, Asia Pacific, and Latin America, Middle East & Africa. Asia-Pacific emerged as the leading region in the utility vehicle market with the largest revenue share in 2021. Because of their changing transportation preferences, China and India are showcasing increased requirement for utility vehicles. The regional utility vehicle market is highly consolidated, with several companies controlling the majority of the market. The majority of market players are strategically active in activities such as product introduction, expansion, cooperation, and development.
The major strategies followed by the market participants are Partnerships. Based on the Analysis presented in the Cardinal matrix; Deere & Company and Honda Motor Co. Ltd. are the forerunners in the Utility Vehicle Market. Companies such as Zhejiang CFMoto Power Co., Ltd., KUBOTA Corporation and Polaris, Inc. are some of the key innovators in the Market.
The market research report covers the analysis of key stake holders of the market. Key companies profiled in the report include Textron, Inc., Polaris, Inc., Deere & Company, Honda Motor Co. Ltd., Yamaha Motor Co., Ltd., Kawasaki Heavy Industries, Ltd., KUBOTA Corporation, Mahindra & Mahindra Limited, Zhejiang CFMoto Power Co., Ltd., and Bombardier Recreational Products, Inc.
Recent Strategies deployed in Utility Vehicle Market
Partnerships, Collaborations and Agreements:
Apr-2022: Honda Motor formed a partnership with General Motors, an American multinational automotive manufacturing corporation. Under this partnership, the companies aimed to create a series of affordable electric vehicles based on a new global platform. The partnership would strengthen the ties between the automakers regarding all-electric & autonomous vehicles.
Mar-2022: Honda Motor came into an agreement with Sony Group. Under this agreement, the companies aimed to build a new era of mobility & mobility services. In addition, the companies signed a memorandum of understanding that highlights their aim to incorporate a joint venture by which they plan to engage in the joint development & sales of high value-added battery electric vehicles (EVs) & commercialize them in conjunction with providing mobility services.
Jun-2021: CFMOTO came into partnership with Total Specialities, based in the USA. Under this partnership, HI-PERF would be a commended lubricants partner for CFMOTO in the USA.
Apr-2021: Polaris came into partnership with Optimus Ride, an autonomous mobility service provider. Under this partnership, Polaris aimed to bring a fully autonomous GEM vehicle to market. With this partnership, an exclusive line of Polaris GEM electric low-speed vehicles (LSVs) would be manufactured to fully integrate Optimus Ride's autonomous software & hardware suite directly from the factory for deployment nationwide on US streets in corporate campuses, residential communities, academic campuses, & other localized environments.
Sep-2020: Polaris came into a 10-year partnership with Zero Motorcycles, a global leader in electric motorcycle powertrains & technology for 10 years period. The partnership in off-road vehicles (ORV) & snowmobiles is a cornerstone component of rEV'd up, Polaris' long-term strategy to deploy the Company as the leader in Powersports electrification.
Product Launches and Product Expansions:
Jan-2022: Deere & Company unveiled the XUV865R Signature Edition Gator Utility Vehicle & the XUV835R Signature Edition Gator Utility Vehicle. These products are made with premium, automotive-inspired features that bring John Deere's line of utility vehicles to the next level for customers.
Dec-2021: Kawasaki Heavy Industries unveiled the launch of MY22L KLX450R, which is available in "LIME GREEN" colour. KLX450R is a purpose-built off-road race machine armed with a class-leading 4-stroke engine, it has been tweaked for more low-end torque and is combined to a special wide-ratio 5-speed transmission. With a pedigree of persistent evolution, the organization never took a pause in researching and as an outcome, the beautiful KLX450R came into pervalance & holds the title of flagship motorcycle in the KLX family.
Oct-2021: Polaris unveiled its new mid-size model of the Pro XD UTV. Bulit for lighter payloads, tighter spaces & remarkable comfort, this vehicle comes in two & four-seat versions with a capable 500-lb capacity cargo bed. Uses for the mid-size model comprise all-terrain & all-weather utility or people movement for applications like events set-up, construction, landscaping and facilities & grounds maintenance.
Aug-2021: Deere & Company launched the Gator XUV835M Honor Edition Utility Vehicle, created to give tribute to military veterans. Showing military-inspired graphics & desert sand exterior panels, along with many model upgrades, the Honor Edition is available in an open-station configuration & an HVAC cab configuration.
Jan-2020: KUBOTA Corporations launched prototypes of electric compact machinery (mini excavators) & electric tractors. These prototypes are presently under development at a new product exhibition located in Kyoto City. Kubota would begin with continuous development by conducting demonstration experiments & analyzing the requirements of local users.
Acquisitions and Mergers:
Feb-2022: Deere & Company took over majority ownership of Kreisel Electric, a top pioneer in the advancement of immersion-cooled battery technology. The Austrian company manufactures, high-durability electric battery modules, high density, & packs for high-performance & off-highway applications & has built a battery-buffered, high-powered charging infrastructure platform (CHIMERO).
Aug-2020: CFMOTO formed a joint venture with KTM, under the name CFMOTO-KTMR2R. Under this joint venture, CKM aimed to achieve their mission of improving the globalization and technology of the powered two-wheelers industry.
Geographical Expansions:
Mar-2022: Polaris expanded its geographical footprint with a distribution facility in Wilmington, Ohio. The geographical expansion aimed to provide additional distribution capacity, expand product assortment, better delivery, customer service, & optimizing operations. With this expansion, Polaris would grow its eastern presence & in turn serve its dealers & customers in a better way.
Aug-2021: Kawasaki Heavy Industries expanded its geographical footprints with new production facilities at its Mexican subsidiary Kawasaki Motores de Mexico. Under this geographical expansion, these new production facilities would be added to the existing Kawasaki Motors Manufacturing facilities which would also create new, improved production capabilities in Lincoln, Nebraska.
Jul-2020: BRP expanded its geographical footprint by expanding the manufacturing capacity with the construction of a new facility in Mexico location. This geographical expansion aimed to match demand for its off-road vehicles (ORVs) business as well as intended to assist in matching up the speed with the grown demand for Can-Am side-by-side vehicle (SSVs) experienced in latest years.
Scope of the Study
Market Segments covered in the Report:
By Propulsion
- IC Engine Powered
- Electric Powered
- Others
By Vehicle Type
- Sport Utility Vehicle (SUV)
- Multi Utility Vehicle (MUV)
- Utility Terrain Vehicle Type (UTV)
- Others
By Application
- Passenger Commute
- Industrial
- Agricultural
- Sports
- Others
By Geography
- North America
- US
- Canada
- Mexico
- Rest of North America
- Europe
- Germany
- UK
- France
- Russia
- Spain
- Italy
- Rest of Europe
- Asia Pacific
- China
- Japan
- India
- South Korea
- Singapore
- Malaysia
- Rest of Asia Pacific
- LAMEA
- Brazil
- Argentina
- UAE
- Saudi Arabia
- South Africa
- Nigeria
- Rest of LAMEA
Companies Profiled
- Textron, Inc.
- Polaris, Inc.
- Deere & Company
- Honda Motor Co. Ltd.
- Yamaha Motor Co., Ltd.
- Kawasaki Heavy Industries, Ltd.
- KUBOTA Corporation
- Mahindra & Mahindra Limited
- Zhejiang CFMoto Power Co., Ltd.
- Bombardier Recreational Products, Inc.
Unique Offerings from KBV Research
- Exhaustive coverage
- Highest number of market tables and figures
- Subscription based model available
- Guaranteed best price
- Assured post sales research support with 10% customization free
Table of Contents
Chapter 1. Market Scope & Methodology
- 1.1 Market Definition
- 1.2 Objectives
- 1.3 Market Scope
- 1.4 Segmentation
- 1.4.1 Global Utility Vehicle Market, by Propulsion
- 1.4.2 Global Utility Vehicle Market, by Vehicle Type
- 1.4.3 Global Utility Vehicle Market, by Application
- 1.4.4 Global Utility Vehicle Market, by Geography
- 1.5 Methodology for the research
Chapter 2. Market Overview
- 2.1 Introduction
- 2.1.1 Overview
- 2.1.1.1 Market Composition and Scenario
- 2.1.1 Overview
- 2.2 Key Factors Impacting the Market
- 2.2.1 Market Drivers
- 2.2.2 Market Restraints
Chapter 3. Competition Analysis - Global
- 3.1 KBV Cardinal Matrix
- 3.2 Recent Industry Wide Strategic Developments
- 3.2.1 Partnerships, Collaborations and Agreements
- 3.2.2 Product Launches and Product Expansions
- 3.2.3 Acquisition and Mergers
- 3.2.4 Geographical Expansions
- 3.3 Top Winning Strategies
- 3.3.1 Key Leading Strategies: Percentage Distribution (2018-2022)
- 3.3.2 Key Strategic Move: (Partnerships, Collaborations and Agreements: 2018, Jan - 2022, Apr) Leading Players
Chapter 4. Global Utility Vehicle Market by Propulsion
- 4.1 Global IC Engine Powered Market by Region
- 4.2 Global Electric Powered Market by Region
- 4.3 Global Others Market by Region
Chapter 5. Global Utility Vehicle Market by Vehicle Type
- 5.1 Global Sport Utility Vehicle (SUV) Market by Region
- 5.2 Global Multi Utility Vehicle (MUV) Market by Region
- 5.3 Global Utility Terrain Vehicle Type (UTV) Market by Region
- 5.4 Global Others Market by Region
Chapter 6. Global Utility Vehicle Market by Application
- 6.1 Global Passenger Commute Market by Region
- 6.2 Global Industrial Market by Region
- 6.3 Global Agricultural Market by Region
- 6.4 Global Sports Market by Region
- 6.5 Global Others Market by Region
Chapter 7. Global Utility Vehicle Market by Region
- 7.1 North America Utility Vehicle Market
- 7.1.1 North America Utility Vehicle Market by Propulsion
- 7.1.1.1 North America IC Engine Powered Market by Country
- 7.1.1.2 North America Electric Powered Market by Country
- 7.1.1.3 North America Others Market by Country
- 7.1.2 North America Utility Vehicle Market by Vehicle Type
- 7.1.2.1 North America Sport Utility Vehicle (SUV) Market by Country
- 7.1.2.2 North America Multi Utility Vehicle (MUV) Market by Country
- 7.1.2.3 North America Utility Terrain Vehicle Type (UTV) Market by Country
- 7.1.2.4 North America Others Market by Country
- 7.1.3 North America Utility Vehicle Market by Application
- 7.1.3.1 North America Passenger Commute Market by Country
- 7.1.3.2 North America Industrial Market by Country
- 7.1.3.3 North America Agricultural Market by Country
- 7.1.3.4 North America Sports Market by Country
- 7.1.3.5 North America Others Market by Country
- 7.1.4 North America Utility Vehicle Market by Country
- 7.1.4.1 US Utility Vehicle Market
- 7.1.4.1.1 US Utility Vehicle Market by Propulsion
- 7.1.4.1.2 US Utility Vehicle Market by Vehicle Type
- 7.1.4.1.3 US Utility Vehicle Market by Application
- 7.1.4.2 Canada Utility Vehicle Market
- 7.1.4.2.1 Canada Utility Vehicle Market by Propulsion
- 7.1.4.2.2 Canada Utility Vehicle Market by Vehicle Type
- 7.1.4.2.3 Canada Utility Vehicle Market by Application
- 7.1.4.3 Mexico Utility Vehicle Market
- 7.1.4.3.1 Mexico Utility Vehicle Market by Propulsion
- 7.1.4.3.2 Mexico Utility Vehicle Market by Vehicle Type
- 7.1.4.3.3 Mexico Utility Vehicle Market by Application
- 7.1.4.4 Rest of North America Utility Vehicle Market
- 7.1.4.4.1 Rest of North America Utility Vehicle Market by Propulsion
- 7.1.4.4.2 Rest of North America Utility Vehicle Market by Vehicle Type
- 7.1.4.4.3 Rest of North America Utility Vehicle Market by Application
- 7.1.4.1 US Utility Vehicle Market
- 7.1.1 North America Utility Vehicle Market by Propulsion
- 7.2 Europe Utility Vehicle Market
- 7.2.1 Europe Utility Vehicle Market by Propulsion
- 7.2.1.1 Europe IC Engine Powered Market by Country
- 7.2.1.2 Europe Electric Powered Market by Country
- 7.2.1.3 Europe Others Market by Country
- 7.2.2 Europe Utility Vehicle Market by Vehicle Type
- 7.2.2.1 Europe Sport Utility Vehicle (SUV) Market by Country
- 7.2.2.2 Europe Multi Utility Vehicle (MUV) Market by Country
- 7.2.2.3 Europe Utility Terrain Vehicle Type (UTV) Market by Country
- 7.2.2.4 Europe Others Market by Country
- 7.2.3 Europe Utility Vehicle Market by Application
- 7.2.3.1 Europe Passenger Commute Market by Country
- 7.2.3.2 Europe Industrial Market by Country
- 7.2.3.3 Europe Agricultural Market by Country
- 7.2.3.4 Europe Sports Market by Country
- 7.2.3.5 Europe Others Market by Country
- 7.2.4 Europe Utility Vehicle Market by Country
- 7.2.4.1 Germany Utility Vehicle Market
- 7.2.4.1.1 Germany Utility Vehicle Market by Propulsion
- 7.2.4.1.2 Germany Utility Vehicle Market by Vehicle Type
- 7.2.4.1.3 Germany Utility Vehicle Market by Application
- 7.2.4.2 UK Utility Vehicle Market
- 7.2.4.2.1 UK Utility Vehicle Market by Propulsion
- 7.2.4.2.2 UK Utility Vehicle Market by Vehicle Type
- 7.2.4.2.3 UK Utility Vehicle Market by Application
- 7.2.4.3 France Utility Vehicle Market
- 7.2.4.3.1 France Utility Vehicle Market by Propulsion
- 7.2.4.3.2 France Utility Vehicle Market by Vehicle Type
- 7.2.4.3.3 France Utility Vehicle Market by Application
- 7.2.4.4 Russia Utility Vehicle Market
- 7.2.4.4.1 Russia Utility Vehicle Market by Propulsion
- 7.2.4.4.2 Russia Utility Vehicle Market by Vehicle Type
- 7.2.4.4.3 Russia Utility Vehicle Market by Application
- 7.2.4.5 Spain Utility Vehicle Market
- 7.2.4.5.1 Spain Utility Vehicle Market by Propulsion
- 7.2.4.5.2 Spain Utility Vehicle Market by Vehicle Type
- 7.2.4.5.3 Spain Utility Vehicle Market by Application
- 7.2.4.6 Italy Utility Vehicle Market
- 7.2.4.6.1 Italy Utility Vehicle Market by Propulsion
- 7.2.4.6.2 Italy Utility Vehicle Market by Vehicle Type
- 7.2.4.6.3 Italy Utility Vehicle Market by Application
- 7.2.4.7 Rest of Europe Utility Vehicle Market
- 7.2.4.7.1 Rest of Europe Utility Vehicle Market by Propulsion
- 7.2.4.7.2 Rest of Europe Utility Vehicle Market by Vehicle Type
- 7.2.4.7.3 Rest of Europe Utility Vehicle Market by Application
- 7.2.4.1 Germany Utility Vehicle Market
- 7.2.1 Europe Utility Vehicle Market by Propulsion
- 7.3 Asia Pacific Utility Vehicle Market
- 7.3.1 Asia Pacific Utility Vehicle Market by Propulsion
- 7.3.1.1 Asia Pacific IC Engine Powered Market by Country
- 7.3.1.2 Asia Pacific Electric Powered Market by Country
- 7.3.1.3 Asia Pacific Others Market by Country
- 7.3.2 Asia Pacific Utility Vehicle Market by Vehicle Type
- 7.3.2.1 Asia Pacific Sport Utility Vehicle (SUV) Market by Country
- 7.3.2.2 Asia Pacific Multi Utility Vehicle (MUV) Market by Country
- 7.3.2.3 Asia Pacific Utility Terrain Vehicle Type (UTV) Lumens Utility Vehicle Market by Country
- 7.3.2.4 Asia Pacific Others Market by Country
- 7.3.3 Asia Pacific Utility Vehicle Market by Application
- 7.3.3.1 Asia Pacific Passenger Commute Market by Country
- 7.3.3.2 Asia Pacific Industrial Market by Country
- 7.3.3.3 Asia Pacific Agricultural Market by Country
- 7.3.3.4 Asia Pacific Sports Market by Country
- 7.3.3.5 Asia Pacific Others Market by Country
- 7.3.4 Asia Pacific Utility Vehicle Market by Country
- 7.3.4.1 China Utility Vehicle Market
- 7.3.4.1.1 China Utility Vehicle Market by Propulsion
- 7.3.4.1.2 China Utility Vehicle Market by Vehicle Type
- 7.3.4.1.3 China Utility Vehicle Market by Application
- 7.3.4.2 Japan Utility Vehicle Market
- 7.3.4.2.1 Japan Utility Vehicle Market by Propulsion
- 7.3.4.2.2 Japan Utility Vehicle Market by Vehicle Type
- 7.3.4.2.3 Japan Utility Vehicle Market by Application
- 7.3.4.3 India Utility Vehicle Market
- 7.3.4.3.1 India Utility Vehicle Market by Propulsion
- 7.3.4.3.2 India Utility Vehicle Market by Vehicle Type
- 7.3.4.3.3 India Utility Vehicle Market by Application
- 7.3.4.4 South Korea Utility Vehicle Market
- 7.3.4.4.1 South Korea Utility Vehicle Market by Propulsion
- 7.3.4.4.2 South Korea Utility Vehicle Market by Vehicle Type
- 7.3.4.4.3 South Korea Utility Vehicle Market by Application
- 7.3.4.5 Singapore Utility Vehicle Market
- 7.3.4.5.1 Singapore Utility Vehicle Market by Propulsion
- 7.3.4.5.2 Singapore Utility Vehicle Market by Vehicle Type
- 7.3.4.5.3 Singapore Utility Vehicle Market by Application
- 7.3.4.6 Malaysia Utility Vehicle Market
- 7.3.4.6.1 Malaysia Utility Vehicle Market by Propulsion
- 7.3.4.6.2 Malaysia Utility Vehicle Market by Vehicle Type
- 7.3.4.6.3 Malaysia Utility Vehicle Market by Application
- 7.3.4.7 Rest of Asia Pacific Utility Vehicle Market
- 7.3.4.7.1 Rest of Asia Pacific Utility Vehicle Market by Propulsion
- 7.3.4.7.2 Rest of Asia Pacific Utility Vehicle Market by Vehicle Type
- 7.3.4.7.3 Rest of Asia Pacific Utility Vehicle Market by Application
- 7.3.4.1 China Utility Vehicle Market
- 7.3.1 Asia Pacific Utility Vehicle Market by Propulsion
- 7.4 LAMEA Utility Vehicle Market
- 7.4.1 LAMEA Utility Vehicle Market by Propulsion
- 7.4.1.1 LAMEA IC Engine Powered Market by Country
- 7.4.1.2 LAMEA Electric Powered Market by Country
- 7.4.1.3 LAMEA Others Market by Country
- 7.4.2 LAMEA Utility Vehicle Market by Vehicle Type
- 7.4.2.1 LAMEA Sport Utility Vehicle (SUV) Market by Country
- 7.4.2.2 LAMEA Multi Utility Vehicle (MUV) Market by Country
- 7.4.2.3 LAMEA Utility Terrain Vehicle Type (UTV) Market by Country
- 7.4.2.4 LAMEA Others Market by Country
- 7.4.3 LAMEA Utility Vehicle Market by Application
- 7.4.3.1 LAMEA Passenger Commute Market by Country
- 7.4.3.2 LAMEA Industrial Market by Country
- 7.4.3.3 LAMEA Agricultural Market by Country
- 7.4.3.4 LAMEA Sports Market by Country
- 7.4.3.5 LAMEA Others Market by Country
- 7.4.4 LAMEA Utility Vehicle Market by Country
- 7.4.4.1 Brazil Utility Vehicle Market
- 7.4.4.1.1 Brazil Utility Vehicle Market by Propulsion
- 7.4.4.1.2 Brazil Utility Vehicle Market by Vehicle Type
- 7.4.4.1.3 Brazil Utility Vehicle Market by Application
- 7.4.4.2 Argentina Utility Vehicle Market
- 7.4.4.2.1 Argentina Utility Vehicle Market by Propulsion
- 7.4.4.2.2 Argentina Utility Vehicle Market by Vehicle Type
- 7.4.4.2.3 Argentina Utility Vehicle Market by Application
- 7.4.4.3 UAE Utility Vehicle Market
- 7.4.4.3.1 UAE Utility Vehicle Market by Propulsion
- 7.4.4.3.2 UAE Utility Vehicle Market by Vehicle Type
- 7.4.4.3.3 UAE Utility Vehicle Market by Application
- 7.4.4.4 Saudi Arabia Utility Vehicle Market
- 7.4.4.4.1 Saudi Arabia Utility Vehicle Market by Propulsion
- 7.4.4.4.2 Saudi Arabia Utility Vehicle Market by Vehicle Type
- 7.4.4.4.3 Saudi Arabia Utility Vehicle Market by Application
- 7.4.4.5 South Africa Utility Vehicle Market
- 7.4.4.5.1 South Africa Utility Vehicle Market by Propulsion
- 7.4.4.5.2 South Africa Utility Vehicle Market by Vehicle Type
- 7.4.4.5.3 South Africa Utility Vehicle Market by Application
- 7.4.4.6 Nigeria Utility Vehicle Market
- 7.4.4.6.1 Nigeria Utility Vehicle Market by Propulsion
- 7.4.4.6.2 Nigeria Utility Vehicle Market by Vehicle Type
- 7.4.4.6.3 Nigeria Utility Vehicle Market by Application
- 7.4.4.7 Rest of LAMEA Utility Vehicle Market
- 7.4.4.7.1 Rest of LAMEA Utility Vehicle Market by Propulsion
- 7.4.4.7.2 Rest of LAMEA Utility Vehicle Market by Vehicle Type
- 7.4.4.7.3 Rest of LAMEA Utility Vehicle Market by Application
- 7.4.4.1 Brazil Utility Vehicle Market
- 7.4.1 LAMEA Utility Vehicle Market by Propulsion
Chapter 8. Company Profiles
- 8.1 Textron, Inc.
- 8.1.1 Company Overview
- 8.1.2 Financial Analysis
- 8.1.3 Regional & Segmental Analysis
- 8.1.4 Research & Development Expenses
- 8.1.5 Recent strategies and developments:
- 8.1.5.1 Partnerships, Collaborations, and Agreements:
- 8.1.5.2 Product Launches and Product Expansions:
- 8.2 Polaris, Inc.
- 8.2.1 Company Overview
- 8.2.2 Financial Analysis
- 8.2.3 Regional & Segmental Analysis
- 8.2.4 Research & Development Expenses
- 8.2.5 Recent strategies and developments:
- 8.2.5.1 Partnerships, Collaborations, and Agreements:
- 8.2.5.2 Product Launches and Product Expansions:
- 8.2.5.3 Geographical Expansions:
- 8.3 Deere & Company
- 8.3.1 Company Overview
- 8.3.2 Financial Analysis
- 8.3.3 Regional & Segmental Analysis
- 8.3.4 Research & Development Expenses
- 8.3.5 Recent strategies and developments:
- 8.3.5.1 Partnerships, Collaborations, and Agreements:
- 8.3.5.2 Product Launches and Product Expansions:
- 8.3.5.3 Acquisition and Mergers:
- 8.4 Honda Motor Co. Ltd.
- 8.4.1 Company Overview
- 8.4.2 Financial Analysis
- 8.4.3 Segmental and Regional Analysis
- 8.4.4 Research & Development Expense
- 8.4.5 Recent strategies and developments:
- 8.4.5.1 Partnerships, Collaborations, and Agreements:
- 8.4.6 SWOT Analysis
- 8.5 Yamaha Motor Co., Ltd.
- 8.5.1 Company Overview
- 8.5.2 Financial Analysis
- 8.5.3 Segmental and Regional Analysis
- 8.5.4 Research & Development Expense
- 8.5.5 Recent strategies and developments:
- 8.5.5.1 Product Launches and Product Expansions:
- 8.6 Kawasaki Heavy Industries, Ltd.
- 8.6.1 Company Overview
- 8.6.2 Financial Analysis
- 8.6.3 Segmental and Regional Analysis
- 8.6.4 Research & Development Expense
- 8.6.5 Recent strategies and developments:
- 8.6.5.1 Product Launches and Product Expansions:
- 8.6.5.2 Geographical Expansions:
- 8.7 KUBOTA Corporation
- 8.7.1 Company Overview
- 8.7.2 Financial Analysis
- 8.7.3 Segmental and Regional Analysis
- 8.7.4 Research & Development Expenses
- 8.7.5 Recent strategies and developments:
- 8.7.5.1 Partnerships, Collaborations, and Agreements:
- 8.7.5.2 Product Launches and Product Expansions:
- 8.8 Mahindra & Mahindra Limited (Mahindra Group)
- 8.8.1 Company Overview
- 8.8.2 Financial Analysis
- 8.8.3 Segmental and Regional Analysis
- 8.8.4 Research & Development Expense
- 8.8.5 Recent strategies and developments:
- 8.8.5.1 Collaborations, Partnerships and Agreements:
- 8.9 Zhejiang CFMoto Power Co., Ltd.
- 8.9.1 Company Overview
- 8.9.2 Recent strategies and developments:
- 8.9.2.1 Partnerships, Collaborations, and Agreements:
- 8.9.2.2 Acquisition and Mergers:
- 8.9.2.3 Geographical Expansions:
- 8.10. Bombardier Recreational Products, Inc.
- 8.10.1 Company Overview
- 8.10.2 Recent strategies and developments:
- 8.10.2.1 Geographical Expansions: