|
|
市場調査レポート
商品コード
1680889
国際ローミングコリドー市場:2020-2029年International Roaming Corridors Market: 2020-2029 |
||||||
|
|||||||
| 国際ローミングコリドー市場:2020-2029年 |
|
出版日: 2025年03月24日
発行: Juniper Research Ltd
ページ情報: 英文
納期: 即日から翌営業日
|
全表示
- 概要
- 目次
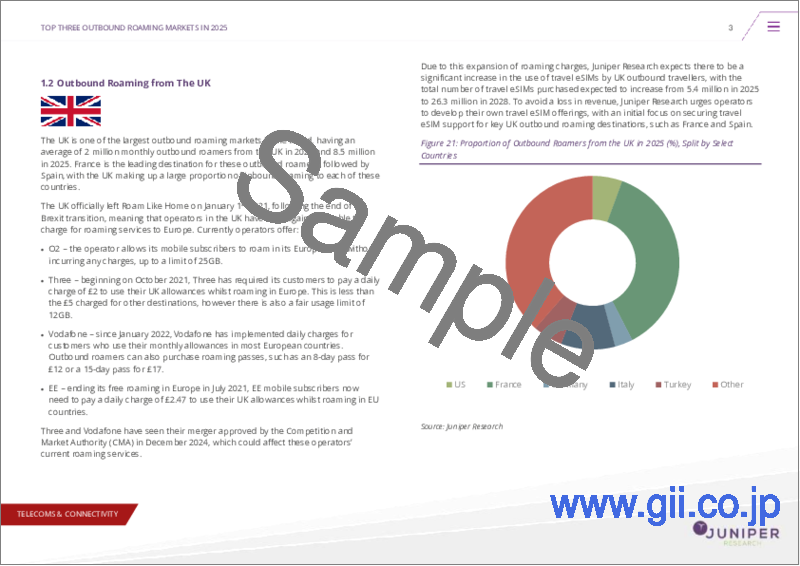
Juniper Research、2025年のアウトバウンドローマーの上位5カ国を調査
| 主要統計 | |
|---|---|
| 調査対象ローミングコリドー | 312 |
| データポイント | 80,000以上 |
| 調査期間 | 2020-2024年 |
| 予測期間 | 2025-2029年 |
概要
当調査スイートは、通信事業者およびローミングベンダーに、世界最大規模の12カ国のアウトバウンド&インバウンドローミング市場に関する比類ない洞察を提供します。2020年1月から2029年12月までの300以上のローミングコリドーに関する月別内訳を掲載しており、事業戦略や意思決定の改善に役立ちます。
本レポートおよびデータセットに含まれる国は以下の通り:
|
|
|
本レポートには、12カ国のインバウンドおよびアウトバウンドローマーの月別データが含まれており、各国全体と12カ国のそれぞれから別の国への特定の移動についても提供されています。例えば、メキシコから米国へのインバウンドローマーに対しては、各月のインバウンドローマー総数に加え、月ごとの過去データと予測が提供されています。
また、データセットに記載されている12カ国それぞれについて、インバウンドおよびアウトバウンドのローミング市場に関する分析と提言を提供する市場動向分析資料も提供されています。これには渡航制限など、COVID-19からの回復に影響を与えた要因や、通貨高や経済成長などその他の社会経済的要因の分析が含まれています。また、ワールドカップのような主要イベントの開催など、将来的な要因の影響についての評価も含まれており、オペレーターがこれらの市場の変化をどのように活用できるかについての提言も行っています。
主な特徴
- インバウンドトラフィックへのアクセス機能:12カ国それぞれのインバウンドローミングの月別内訳が提供されており、主要なローミングコリドーを特定し、これらのインバウンドコリドーが今後どのように発展していくかを知ることができます。
- アウトバウンドトラフィックへのアクセス機能:12カ国それぞれからのアウトバウンドローミングの月別内訳が提供され、主要なローミングコリドーを特定し、これらのコリドーが今後どのように発展していくかを知ることができます。
- 月別データ:事業者およびローミングベンダーは、各市場におけるインバウンドおよびアウトバウンドローミングの過去および現在の変化を効果的に評価および分析することができます。
- 過去のデータと予測:豊富な過去のデータと予測データにより、過去の分析と予測的な意思決定が可能になり、事業者とローミングベンダーは今後最善の意思決定を行うことができます。
市場データ・予測
本調査スイートには、80,000を超えるデータポイントからなる履歴および予測データ一式へのアクセスが含まれています。各国に含まれる指標は以下の通りです:
- 12カ国の月間インバウンドローマーの割合
- 12カ国の月間インバウンドローマーの総数
- 12カ国の月間発信ローマー数の割合
- 12カ国の月間発信ローマー数の合計
サンプルビュー
市場動向 (PDFレポート)

現在の市場情勢を包括的に分析し、戦略的な提言や予測のウォークスルーを掲載
目次
第1章 ローミングコリドー分析
- 調査手法と前提
- 米国
- カナダ
- メキシコ
- フランス
- ドイツ
- イタリア
- スペイン
- 英国
- トルコ
- 中国
- 日本
- インド
- インバウンドローミング
- アウトバウンドローミング
'Juniper Research Reveals Top 5 Countries for Outbound Roamers in 2025'
| KEY STATISTICS | |
|---|---|
| Roaming corridors assessed: | 312 |
| Datapoints: | Over 80,000 |
| Historical data period: | 2020-2024 |
| Forecast period: | 2025-2029 |
Overview
Our "Roaming Corridors 2020-2029" research suite provides operators and roaming vendors with unequalled insight into 12 of the largest outbound and inbound roaming markets in the world. The data included allows for improved business strategies and decision-making, with month-by-month breakdowns for more than 300 roaming corridors from January 2020 to December 2029.
The countries included in the report and dataset are:
|
|
|
The report includes month-by-month data for both inbound and outbound roamers for each of the 12 countries; with this data provided for each country as a whole, as well as for specific travel from one of the 12 countries to another. For example, month-by-month historical data and forecasts are provided for inbound roamers to the US from Mexico, in addition to the total number of inbound roamers to the US each month.
Also provided is a market trend and analysis document, which provides analysis and recommendations for inbound and outbound roaming markets for each of the 12 countries listed in the dataset. This includes analysis of the factors which have affected each market's recovery from the COVID-19 pandemic, such as travel restrictions, as well as other socio-economic factors, such as currency strengths and economic growth. Assessments of the impact of future factors, such as the hosting of major events such as the World Cup, are also included, as well as recommendations for how operators can capitalise on the changes to these markets.
Key Features
- Ability to Access Inbound Traffic - Month-by-month breakdowns are provided for inbound roaming for each of the 12 countries; allowing for the identification of key roaming corridors and how these inbound corridors will evolve in the future.
- Ability to Assess Outbound Traffic - Month-by-month breakdowns are provided for outbound roaming from each of the 12 countries; allowing for the identification of key roaming corridors and how these corridors will evolve in the future.
- Monthly Data - Month-by-month data enables operators and roaming vendors to effectively evaluate and analyse past and present changes to inbound and outbound roaming for each market.
- Historical Data and Forecast - The extensive historical and forecasted data allows for historical analysis and predictive decision making; enabling operators and roaming vendors to make the best possible decisions, moving forward.
Market Data & Forecasts
The market-leading Roaming Corridors research suite includes access to a full set of historical and forecast data; comprising over 80,0000 data points. The metrics included for each country are:
- Proportion of Monthly Inbound Roamers, with Splits for 12 Countries
- Total Number of Monthly Inbound Roamers, with Splits for 12 Countries
- Proportion of Monthly Outbound Roamers, with Splits for 12 Countries
- Total Number of Monthly Outbound Roamers, with Splits for 12 Countries
SAMPLE VIEW
Market Trends & Forecasts PDF Report

A comprehensive analysis of the current market landscape, alongside strategic recommendations and a walk-through of the forecasts.
Table of Contents
1. Roaming Corridor Analysis
- 1.1. Introduction
- Figure 1.1: Total Number of Inbound Mobile Roamers Year End (m), Split by 8 Key Regions, 2020-2029
- 1.2. Methodology and Assumptions
- 1.3. The US
- 1.3.1. Inbound Roaming to the US
- Figure 1.2: Total Number of Inbound Roamers to the US in 2029 (m), Split by Month
- 1.3.2. Outbound Roaming from the US
- Figure 1.3: Total Number of Outbound Roamers from the US (m), 2020-2028
- 1.3.1. Inbound Roaming to the US
- 1.4. Canada
- 1.4.1. Inbound Roaming to Canada
- Figure 1.4: Total Number of Inbound Roamers to Canada in 2025 (m), Split by Month
- 1.4.2. Outbound Roaming from Canada
- Figure 1.5: Proportion of Monthly Outbound Roamers from Canada in 2025 (%), Split by Select Countries
- 1.4.1. Inbound Roaming to Canada
- 1.5. Mexico
- 1.5.1. Inbound Roaming to Mexico
- Figure 1.6: Proportion of Monthly Inbound Roamers to Mexico in 2025 (%), Split by Select Countries
- 1.5.2. Outbound Roaming from Mexico
- Figure 1.7: Total Number of Outbound Roamers from Mexico in 2025 (m), Split by Month
- 1.5.1. Inbound Roaming to Mexico
- 1.6. France
- 1.6.1. Inbound Roaming to France
- Figure 1.8: Total Number of Inbound Roamers to France in 2025 (m), Split by Month
- 1.6.2. Outbound Roaming from France
- Figure 1.9: Proportion of Outbound Roamers From France in 2029 (%), Split by Select Countries
- 1.6.1. Inbound Roaming to France
- 1.7. Germany
- 1.7.1. Inbound Roaming to Germany
- Figure 1.10: Total Number of Inbound Roamers to Germany in 2025 (m), Split by Month
- 1.7.2. Outbound Roaming from Germany
- Figure 1.11: Proportion of Outbound Roamers from Germany in 2029 (%), Split by Select Destinations
- 1.7.1. Inbound Roaming to Germany
- 1.8. Italy
- 1.8.1. Inbound Roaming to Italy
- Figure 1.12: Proportion of Monthly Inbound Roamers to Italy in 2025 (%), Split by Select Countries
- 1.8.2. Outbound Roaming from Italy
- Figure 1.13: Total Number of Outbound Roamers From Italy in 2025 (m), Split by Month
- 1.8.1. Inbound Roaming to Italy
- 1.9. Spain
- 1.9.1. Inbound Roaming to Spain
- Figure 1.14: Total Number of Inbound Roamers to Spain in 2029 (m), Split by Month
- 1.9.2. Outbound Roaming from Spain
- Figure 1.15: Total Number of Outbound Roamers from Spain in 2025 (m), Split by Month
- 1.9.1. Inbound Roaming to Spain
- 1.10. The UK
- 1.10.1. Inbound Roaming to the UK
- Figure 1.16: Total Number of Inbound Roamers to the UK in 2025 (m), Split by Month
- 1.10.2. Outbound Roaming from the UK
- Figure 1.17: Proportion of Outbound Roamers From the UK in 2025 (%), Split by Select Countries
- 1.10.1. Inbound Roaming to the UK
- 1.11. Turkey
- 1.11.1. Inbound Roaming to Turkey
- Figure 1.18: Total Number of Inbound Roamers to Turkey in 2029 (m), Split by Month
- 1.11.2. Outbound Roaming from Turkey
- Figure 1.19: Total Number of Outbound Roamers From Turkey in 2025 (m), Split by Month
- 1.11.1. Inbound Roaming to Turkey
- 1.12. China
- 1.12.1. Inbound Roaming to China
- Figure 1.20: Total Number of Inbound Roamers to China in 2025 (m), Split by Month
- 1.12.2. Outbound Roaming from China
- Figure 1.21: Total Number of Outbound Roamers from China in 2029 (m), Split by Month
- 1.12.1. Inbound Roaming to China
- 1.13. Japan
- 1.13.1. Inbound Roaming to Japan
- Figure 1.22: Total Number of Inbound Roamers to Japan in 2025 (m), Split by Month
- 1.13.2. Outbound Roaming from Japan
- Figure 1.23: Total Number of Outbound Roamers from Japan in 2025 (m), Split by Month
- 1.13.1. Inbound Roaming to Japan
- 1.14. India
- 1.14.1. Inbound Roaming to India
- Figure 1.24: Total Number of Inbound Roamers to India in 2025 (m), Split by Month
- 1.14.2. Outbound Roaming from India
- Figure 1.25: Proportion of Outbound Roamers from India in 2029 (%), Split by Select Countries
- 1.14.1. Inbound Roaming to India


