モバイル個人認証 (モバイルアイデンティティ) の世界市場:2025-2029年
Global Mobile Identity Market: 2025-2029- 発行日
- ページ情報
- 英文
- 納期
- 即日から翌営業日
- 商品コード
- 1674507
- 翻訳ツール提供対象 PDF対応AI翻訳ツールの無料貸し出しサービスのご利用が可能です
- 通信/IT関連専門 通信/IT関連専門を専門とする市場調査会社です。
概要
世界のモバイル個人認証 (モバイルアイデンティティ) 収益は、2029年には半分以上をAPIが占める見通し
| 主要統計 | |
|---|---|
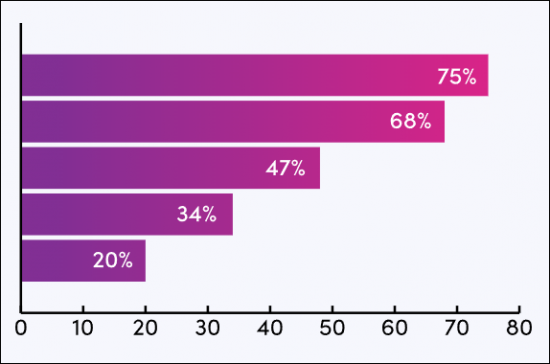
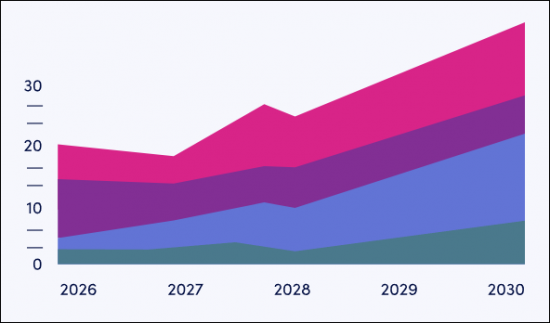
| 2025年のモバイル個人認証の総収益: | 255億米ドル |
| 2029年のモバイル個人認証の総収益: | 427億米ドル |
| モバイル個人認証収益の成長率 (2025~2029年): | 68% |
| 予測期間: | 2025-2029年 |
当調査パッケージは、今後5年間で大きく変化するモバイル個人認証市場の詳細で洞察に満ちた分析を提供します。本調査により、モバイル個人認証ベンダーやモバイルオペレーターなどのステークホルダーは、市場がどのように発展していくかをよりよく理解することができます。SMSビジネスメッセージングの減少と代替モバイル個人認証ソリューションへの移行が、既存のサービスにどの程度ディスラプションを起こすかを評価します。
当スイートには、モバイル個人認証のトラフィックと将来の収益可能性に関するデータ・予測を含む、個別に購入可能な複数のオプションが含まれています。さらに、市場の主要動向と将来の機会を明らかにする洞察に満ちた調査や、モバイル個人認証分野の主要ベンダー18社に関する広範な分析も含まれています。
主な特徴
- 市場力学:モバイル個人認証市場の変化から生じる主要動向と市場機会に関する洞察を提供します。本調査では、OTTメッセージングやリッチコミュニケーションサービス (RCS) を介したワンタイムパスワード (OTP)、番号検証APIなど、モバイル個人認証ベンダーやモバイルオペレーターの主な成長機会を取り上げています。また、モバイルオペレーターがマネタイズ可能な非オペレータープラットフォームへ移行する認証トラフィックと、新たなモバイル個人認証ソリューションのセキュリティによりもたらされる課題を評価し、これらの課題をどのように解決すべきかの提言も示しています。さらに、主要61カ国における現在の市場の発展状況と今後の成長に関する地域別の市場成長率分析も掲載し、主要な注目市場を特定しています。
- 主な要点・戦略的提言:主な発展機会や知見を詳細に分析し、ベンダーやモバイルオペレーターに対する主要な戦略的提言を掲載しています。
- ベンチマーク業界予測:5カ年の予測データベースを提供し、各分野のユーザー、トラフィック、収益と予測を示します。これらの分野には、SMS OTP、電話番号認証API、RCS OTP、音声OTP、OTT OTP、移動局国際加入者番号 (MSISDN)、生体認証が含まれます。
- Juniper Researchの競合リーダーボード:主要ベンダー18社の能力を評価し、市場実績、収益、将来の事業見通しなどの基準でベンダーを採点します。
サンプル
市場動向・戦略 (PDFレポート)
サンプルビュー
市場データ&予測レポート
当調査スイートには、57の表と25,900超のデータポイントで構成される包括的な5年間の予測データセットへのアクセスが含まれています。調査スイートには以下の指標が含まれます:
|
|
これらの指標は以下の主要市場別に提供されています:
|
|
Juniper Researchのインタラクティブ予測 (Excel) には以下の機能があります:
- 統計分析:データ期間中の全地域と国について表示される特定の指標を検索できます。グラフは簡単に変更でき、クリップボードにエクスポートできます。
- 国別データツール:予測期間中のすべての地域と国の指標を見ることができます。検索バーで表示される指標を絞り込むことができます。
- 国別比較ツール:特定の国を選択して比較することができます。このツールにはグラフをエクスポートする機能が含まれています。
- What-if分析:5つのインタラクティブなシナリオを通じて、ユーザーは予測の前提条件と比較することができます。
目次
市場動向・戦略
第1章 重要ポイント・戦略的推奨事項
第2章 モバイル個人認証:将来の市場展望
- モバイル個人認証:イントロダクション
- OTPベース認証
- SMS OTP
- RCSベース認証
- フラッシュコール
- 非構造化補足サービスデータ (USSD) ベース認証
- OTTベース認証
- SIMベース認証
- プライバシーと同意
- デバイスベースの生体認証
- パスキー
- プッシュ通知認証
- 認証におけるAIとブロックチェーン
- 多要素認証/2要素認証
第3章 国別準備指数
- 国別準備指数:イントロダクション
- 重点市場
- スマートフォンの普及
- 極東および中国
- フランス
- インド
- 成長市場
- 西欧
- 香港
- 飽和市場
- 新興国市場
競合リーダーボード
第1章 JuniperResearchの競合リーダーボード
第2章 ベンダープロファイル
- ベンダープロファイル
- BICS
- Clickatell
- CM.com
- Comviva
- GMS Worldwide
- Infobip
- LINK Mobility
- Methics
- Mitto
- Monty Mobile
- Prelude
- Route Mobile
- Sinch
- Syniverse
- Tata Communications
- Telesign
- Twilio
- Vonage
- 調査手法
- 制限と解釈
- 関連調査
データ・予測
第1章 市場予測・重要ポイント
- オペレーター請求モバイル個人認証の総収益
- モバイル個人認証の総収益
第2章 SMS OTP
- 調査手法
- MFAまたはOTPに使用されるSMSトラフィックの合計
- MFAおよびOTP SMSトラフィックからのプラットフォーム総収益
- オペレーター請求の総収益
第3章 電話番号検証API
- 調査手法
- 電話番号検証API呼び出しの総数
- 電話番号検証API呼び出しによるオペレーター総収益
第4章 RCS OTP
- 調査手法
- 認証メッセージであるRCSビジネスメッセージの総数
- RCSビジネスメッセージング認証トラフィックからの総収益
第5章 OTP音声
- 調査手法
- OTP音声APIコールによるオペレーター総収益
第6章 OTT OTP
- 調査手法
- OTPに起因するOTTビジネスメッセージの総数
- OTTビジネスメッセージングの総収益
第7章 モバイル個人認証のためのMSISDN
- 調査手法
- MSISDNログインからのMNO直接総収益
第8章 デバイスベースの生体認証
- 調査手法
- 生体認証機能を備えたスマートフォンの総数
目次
'APIs to Account for More Than Half of Global Mobile Identity Revenue by 2029'
| KEY STATISTICS | |
|---|---|
| Total mobile identity revenue in 2025: | $25.5bn |
| Total mobile identity revenue in 2029: | $42.7bn |
| 2025 to 2029 mobile identity revenue increase: | 68% |
| Forecast period: | 2025-2029 |
Overview
Our "Mobile Identity" research suite provides detailed and insightful analysis of a market set for significant change over the next five years. It enables stakeholders, from mobile identity vendors and mobile operators, to better understand how the mobile identity market will evolve; assessing the extent to which the decline in SMS business messaging and migration to alternative mobile identity solutions will disrupt established services.
The mobile identity market suite includes several different options that can be purchased separately, including data and forecasts for traffic and future revenue potential of mobile identity. Additionally, it includes an insightful study uncovering key trends and future opportunities within the market, as well as an extensive analysis of 18 leading vendors in the mobile identity space. The coverage can also be purchased as a full research suite, which contains all these elements and includes a substantial discount.
Collectively, they provide a critical tool for understanding this ever-changing market; allowing mobile identity vendors and operators to capitalise on trends and shape their future strategy. This research suite's unparalleled coverage makes it an incredibly useful resource for projecting the future of such an unpredictable market.
Key Features
- Market Dynamics: Insights into key trends and market opportunities resulting from changes within the mobile identity market. This study addresses key growth opportunities for mobile identity vendors and mobile operators, including one-time passwords (OTPs) via over the top (OTT) messaging and rich communications services (RCS), as well as number verification application programming interfaces (APIs). It assesses challenges posed to mobile operators by authentication traffic migrating to non-operator monetisable platforms and the security of emerging mobile identity solutions, providing recommendations for how these must be navigated. Moreover, it includes a regional market growth rate analysis on the current development and future growth of mobile identity across 61 key countries, identifying key focus markets.
- Key Takeaways & Strategic Recommendations: In-depth analysis of key development opportunities and findings within the mobile identity market, accompanied by key strategic recommendations for mobile identity vendors and mobile operators.
- Benchmark Industry Forecasts: Five-year forecast databases are provided for the mobile identity market, providing user, traffic, and revenue splits for each sector. These sector splits include SMS OTPs, phone number verification APIs, RCS OTPs, voice OTPs, OTT OTPs, mobile station international subscriber directory number (MSISDN) and biometric authentication.
- Juniper Research Competitor Leaderboard: Key player capability and capacity assessment for 18 mobile identity vendors via the Juniper Research Competitor Leaderboard; scoring these vendors on criteria such as market performance, revenue and future business prospects.
SAMPLE VIEW
Market Trends & Strategies PDF Report
A comprehensive analysis of the current market landscape, alongside strategic recommendations and a walk-through of the forecasts.
SAMPLE VIEW
Market Data & Forecasts Report
The numbers tell you what's happening, but our written report details why, alongside the methodologies.
Market Trends & Strategies
This trends analysis report examines the mobile identity market landscape in detail; assessing market trends and factors shaping the evolution of this rapidly-changing market. This essential strategy report delivers a comprehensive analysis of the strategic opportunities for mobile identity providers, market challenges, and how stakeholders must navigate these. It also includes an evaluation of the key country-level opportunities for mobile roaming growth, with the Country Readiness Index.
Competitor Leaderboard Report
The Competitor Leaderboard report provides a detailed evaluation and market positioning for 18 leading vendors in the mobile identity space. The vendors are positioned as established leaders, leading challengers, or disruptors and challengers, based on capacity and capability assessments:
|
|
This competitive analysis document is centred around the Juniper Research Competitor Leaderboard, a vendor positioning tool that provides an at-a-glance view of the competitive landscape in a market; backed by a robust methodology.
The market-leading research suite for the mobile identity market includes access to a comprehensive five-year forecast dataset comprising 57 tables and over 25,900 datapoints. Metrics in the research suite include:
|
|
These metrics are provided for the following key market verticals:
|
|
Juniper Research Interactive Forecast Excel contains the following functionality:
- Statistics Analysis: Users benefit from the ability to search for specific metrics, displayed for all regions and countries across the data period. Graphs are easily modified and can be exported to the clipboard.
- Country Data Tool: This tool lets users look at metrics for all regions and countries in the forecast period. Users can refine the metrics displayed via a search bar.
- Country Comparison Tool: Users can select and compare specific countries. The ability to export graphs is included in this tool.
- What-if Analysis: Here, users can compare forecast metrics against their own assumptions via five interactive scenarios.
Table of Contents
Market Trends & Strategies
1. Key Takeaways & Strategic Recommendations
- 1.1. Key Takeaways and Strategic Recommendations
- 1.2. Key Takeaways
- 1.3. Strategic Recommendations
2. Mobile Identity: Future Market Outlook
- 2.1. Introduction To Mobile Identity
- Figure 2.1: Total Mobile Identity Revenue ($25.5 billion), Split by Channel, 2025
- Table 2.2: Fraudulent Challenges for Mobile Identity Vendors
- 2.2. OTP-based Authentication
- 2.2.1. SMS OTPs
- Figure 2.3: Total Cost of AIT and SMS Trashing to Enterprises ($m), Split by 8 Key Regions, 2024
- Figure 2.4: SMS OTPs
- Figure 2.5: Total Operator-billed Revenue from SMS OTPs ($m), Split by 8 Key Regions, 2025-2029
- 2.2.2. RCS-based Authentication
- Figure 2.6: RCS OTPs
- Figure 2.7: Total Revenue from RCS Business Messaging OTPs ($m), Split by 8 Key Regions, 2025-2029
- 2.2.3. Flash Calling
- 2.2.4. Unstructured Supplementary Service Data (USSD)-based Authentication
- 2.2.5. Over-the-top (OTT)-based Authentication
- Figure 2.8: Total Revenue from OTT OTPs ($m), Split by 8 Key Regions, 2025-2029
- 2.2.1. SMS OTPs
- 2.3. SIM-based Authentication
- Figure 2.9: Total Operator Revenue from Phone Number Verification APIs ($m), Split by 8 Key Regions, 2025-2029
- 2.3.1. Privacy and Consent
- 2.4. Device-based Biometric Authentication
- Figure 2.10: Proportion of Smartphones That are Capable of Biometric Authentication (%), Split by 8 Key Regions, 2025-2029
- 2.4.1. Passkeys
- 2.5. Push Notification Authentication
- 2.6. AI and Blockchain in Authentication
- 2.7. MFA/2FA
- Figure 2.11: MFA/2FA
3. Country Readiness Index
- 3.1. Introduction to Country Readiness Index
- Figure 3.1: Mobile Identity Country Readiness Index Regional Definitions
- Table 3.2: Juniper Research Country Readiness Index Scoring Criteria: Mobile Identity
- Figure 3.3: Juniper Research Country Readiness Index: Mobile Identity
- Table 3.4: Mobile Identity Country Readiness Index: Market Segments
- 3.2. Focus Markets
- Figure 3.5: Total Mobile Identity Revenue ($m), Split by Focus Markets, 2025
- 3.2.1. Smartphone Penetration
- Figure 3.6: Smartphone Penetration Rate (%), Split by Select Focus Markets, 2025-2029
- 3.2.2. Far East & China
- 3.2.3. France
- 3.2.4. India
- 3.3. Growth Markets
- Figure 3.7: Total Mobile Identity Revenue ($m), Split by Select Growth Markets, 2025-2029
- 3.3.1. West Europe
- 3.3.2. Hong Kong
- 3.4. Saturated Markets
- 3.5. Developing Markets
- Figure 3.8: Total Mobile Identity Revenue ($m), Split by Developing Markets, 2025
- Table 3.9: Juniper Research's Country Readiness Index Heatmap: North America
- Table 3.10: Juniper Research's Country Readiness Index Heatmap: Latin America
- Table 3.11: Juniper Research's Country Readiness Index Heatmap: West Europe
- Table 3.12: Juniper Research's Country Readiness Index Heatmap: Central & East Europe
- Table 3.13: Juniper Research's Country Readiness Index Heatmap: Far East & China
- Table 3.14: Juniper Research's Country Readiness Index Heatmap: Indian Subcontinent
- Table 3.15: Juniper Research's Country Readiness Index Heatmap: Rest of Asia Pacific
- Table 3.16: Juniper Research's Country Readiness Index Heatmap: Africa & Middle East
Competitor Leaderboard
1. Juniper Research Competitor Leaderboard
- 1.1. Why Read This Report
- Authentication Traffic to Migrate to Number Verification APIs
- Table 1.1: Juniper Research Competitor Leaderboard: Vendors & Product Portfolio
- Figure 1.2: Juniper Research Competitor Leaderboard: Mobile Identity
- Table 1.3: Juniper Research Competitor Leaderboard: Vendors
- Table 1.4: Juniper Research Competitor Leaderboard Heatmap: Mobile Identity Vendors
- Authentication Traffic to Migrate to Number Verification APIs
2. Vendor Profiles
- 2.1. Mobile Identity Vendor Profiles
- 2.1.1. BICS
- i. Corporate Information
- Table 2.1: BICS' Select Financial Information (Euro-m), 2022 & 2023
- ii. Geographic Spread
- iii. Key Clients & Strategic Partnerships
- iv. High-level View of Offerings
- v. Juniper Research's View: Key Strengths & Strategic Development Opportunities
- i. Corporate Information
- 2.1.2. Clickatell
- i. Corporate Information
- ii. Geographic Spread
- iii. Key Clients & Strategic Partnerships
- iv. High-level View of Offerings
- v. Juniper Research's View: Key Strengths & Strategic Development Opportunities
- 2.1.3. CM.com
- i. Corporate Information
- Table 2.2: Acquisitions Made by CM.com, 2021-present
- Table 2.3: CM.com's Select Financial Information (Euro-m), 2022-2023
- ii. Geographic Spread
- iii. Key Clients & Strategic Partnerships
- iv. High-level View of Offerings
- v. Juniper Research's View: Key Strengths & Strategic Development Opportunities
- i. Corporate Information
- 2.1.4. Comviva
- i. Corporate Information
- Table 2.4: Comviva's Select Financial Information ($m), 2021-2023
- ii. Geographic Spread
- iii. Key Clients & Strategic Partnerships
- iv. High-level View of Offerings
- v. Juniper Research's View: Key Strengths & Strategic Development Opportunities
- i. Corporate Information
- 2.1.5. GMS Worldwide
- i. Corporate Information
- ii. Geographic Spread
- iii. Key Clients & Strategic Partnerships
- iv. High-level View of Offerings
- v. Juniper Research's View: Key Strengths & Strategic Development Opportunities
- 2.1.6. Infobip
- i. Corporate Information
- Table 2.5: Infobip's Acquisitions - April 2021 to Present
- ii. Geographic Spread
- iii. Key Clients & Strategic Partnerships
- iv. High-level View of Offerings
- Figure 2.6: Infobip's Signals Solution
- v. Juniper Research's View: Key Strengths & Strategic Development Opportunities
- i. Corporate Information
- 2.1.7. LINK Mobility
- i. Corporate Information
- ii. Geographic Spread
- iii. Key Clients & Strategic Partnerships
- iv. High-level View of Offerings
- v. Juniper Research's View: Key Strengths & Strategic Development Opportunities
- 2.1.8. Methics
- i. Corporate Information
- ii. Geographic Spread
- iii. Key Clients & Strategic Partnerships
- Figure 2.7: Methics' Partners
- iv. High-level View of Offerings
- v. Juniper Research's View: Key Strengths & Strategic Development Opportunities
- 2.1.9. Mitto
- i. Corporate Information
- ii. Geographic Spread
- iii. Key Clients & Strategic Partnerships
- iv. High-level View of Offerings
- v. Juniper Research's View: Key Strengths & Strategic Development Opportunities
- 2.1.10. Monty Mobile
- i. Corporate Information
- ii. Geographic Spread
- iii. Key Clients & Strategic Partnerships
- iv. High-level View of Offerings
- v. Juniper Research's View: Key Strengths & Strategic Development Opportunities
- 2.1.11. Prelude
- i. Corporate Information
- ii. Geographic Spread
- iii. Key Clients & Strategic Partnerships
- iv. High-level View of Offerings
- v. Juniper Research's View: Key Strengths & Strategic Development Opportunities
- 2.1.12. Route Mobile
- i. Corporate Information
- Table 2.8: Route Mobile's Annual Financial Information (Indian Rupee Cr), 2021-2023
- ii. Geographic Spread
- iii. Key Clients & Strategic Partnerships
- iv. High-level View of Offerings
- Figure 2.9: Verified Call Service Process
- v. Juniper Research's View: Key Strengths & Strategic Development Opportunities
- i. Corporate Information
- 2.1.13. Sinch
- i. Corporate Information
- Table 2.8: Sinch's Recent Acquisitions, 2020-2021
- Table 2.9: Sinch's Select Financial Information ($m), 2021-2023
- ii. Geographic Spread
- iii. Key Clients & Strategic Partnerships
- iv. High-level View of Offerings
- v. Juniper Research's View: Key Strengths & Strategic Development Opportunities
- i. Corporate Information
- 2.1.14. Syniverse
- i. Corporate Information
- ii. Geographic Spread
- iii. Key Clients & Strategic Partnerships
- iv. High-level View of Offerings
- Figure 2.10: Syniverse Identity and Authentication Engine
- v. Juniper Research's View: Key Strengths & Strategic Development Opportunities
- 2.1.15. Tata Communications
- i. Corporate Information
- ii. Geographic Spread
- iii. Key Clients & Strategic Partnerships
- iv. High-level View of Offerings
- v. Juniper Research's View: Key Strengths & Strategic Development Opportunities
- 2.1.16. Telesign
- i. Corporate Information
- ii. Geographic Spread
- iii. Key Clients & Strategic Partnerships
- iv. High-level View of Offerings
- v. Juniper Research's View: Key Strengths & Strategic Development Opportunities
- 2.1.17. Twilio
- i. Corporate Information
- Table 2.11: Twilio's Revenue ($m), 2021-2023
- Table 2.12: Twilio's Acquisitions, November 2019-present
- ii. Geographic Spread
- iii. Key Clients & Strategic Partnerships
- iv. High-level View of Offerings
- v. Juniper Research's View: Key Strengths & Strategic Development Opportunities
- i. Corporate Information
- 2.1.18. Vonage
- i. Corporate Information
- ii. Geographic Spread
- iii. Key Clients & Strategic Partnerships
- iv. High-level View of Offerings
- v. Juniper Research's View: Key Strengths & Strategic Development Opportunities
- 2.1.1. BICS
- 2.2. Juniper Research Leaderboard Methodology
- 2.3. Limitations & Interpretations
- Table 2.13: Juniper Research Competitor Leaderboard Scoring Criteria: Mobile Identity Vendors
- 2.4. Related Research
Data & Forecasting
1. Market Forecast & Key Takeaways
- 1.1. Introduction to Mobile Identity Forecasts
- Figure 1.1: Total Mobile Identity Revenue ($25bn), Split by Channel, 2025
- 1.1.1. Total Operator-billed Mobile Identity Revenue
- Figure & Table 1.2: Total Operator-billed Mobile Identity Revenue ($m), Split by Key Regions, 2025-2029
- 1.1.2. Total Mobile Identity Revenue
- Figure & Table 1.3: Total Mobile Identity Revenue ($m), Split by 8 Key Regions, 2025-2029
- Table 1.4: Total Mobile Identity Revenue ($m), Split by Operator-billed and Non-Operator-billed revenue, 2025-2029
2. SMS OTPs
- 2.1. SMS OTPs
- 2.1.1. SMS OTP Methodology
- Figure 2.1: OTP SMS Forecast Methodology
- 2.1.2. Total SMS Traffic Used for MFA or OTP Use Cases
- Figure & Table 2.2: Total SMS Traffic Used for MFA or OTP Use Cases (m), Split by 8 Key Regions, 2025-2029
- 2.1.3. Total Platform Revenue from MFA and OTP SMS Traffic
- Figure & Table 2.3: Total Platform Revenue from MFA and OTP SMS Traffic ($m), Split by 8 Key Regions, 2025-2029
- 2.1.4. Total Operator-billed Revenue from SMS Which Use OTP & MFA Use Cases
- Figure & Table 2.4: Total Operator-billed Revenue from SMS which use OTP & MFA Use Cases ($m), Split by 8 Key Regions, 2025-2029
- 2.1.1. SMS OTP Methodology
3. Phone Number Verification APIs
- 3.1. Phone Number Verification APIs Introduction
- 3.1.1. Phone Number Verification APIs Methodology
- Figure 3.1: Phone Number Verification APIs Forecast Methodology
- 3.1.2. Total Number of Phone Number Verification API Calls
- Figure & Table 3.2: Total Number of Phone Number Verification API Calls (m), Split by 8 Key Regions, 2025-2029
- 3.1.3. Total Operator Revenue from Phone Number Verification API Calls
- Figure & Table 3.3: Total Operator Revenue from Phone Number Verification API Calls ($m), Split by 8 Key Regions, 2025-2029
- 3.1.1. Phone Number Verification APIs Methodology
4. RCS OTPs
- 4.1. RCS OTPs
- 4.1.1. RCS OTPs Methodology
- Figure 4.1: RCS OTPs Forecast Methodology
- 4.1.2. Total Number of RCS Business Messages Which are Authentication Messages
- Figure & Table 4.2: Total Number of RCS Business Messages Which are Authentication Messages (m), Split by 8 Key Regions, 2025-2029
- 4.1.3. Total Revenue from RCS Business Messaging Authentication Traffic
- Figure & Table 4.3: Total Revenue from RCS Business Messaging Authentication Traffic ($m), Split by 8 Key Regions, 2025-2029
- 4.1.1. RCS OTPs Methodology
5. OTP Voice
- 5.1. OTP Voice Introduction
- 5.1.1. OTP Voice Methodology
- Figure 5.1: OTP Voice Forecast Methodology
- 5.1.2. Total Operator Revenue from OTP Voice API Calls
- Figure & Table 5.2: Total Operator Revenue from OTP Voice API Calls ($m), Split by 8 Key Regions, 2025-2029
- 5.1.1. OTP Voice Methodology
6. OTT OTPs
- 6.1. OTT OTPs Introduction
- 6.1.1. OTT OTP Methodology
- Figure 6.1: OTT OTP Forecast Methodology
- 6.1.2. Total OTT Business Messages Attributable to OTPs
- Figure & Table 6.2: Total OTT Business Messages Attributable to OTPs
- 6.1.3. Total OTT Business Messaging Revenue
- Figure & Table 6.3: Total OTT Business Messaging Revenue ($m), Split by 8 Key Regions, 2025-2029
- Table 6.4: Potential Operator A2P Revenue Loss Due to OTT Business Messaging OTPs ($m), Split by 8 Key Regions, 2025-2029
- 6.1.1. OTT OTP Methodology
7. MSISDN For Mobile Identity
- 7.1. MSISDN Introduction
- 7.1.1. MSISDN Methodology
- Figure 7.1: MSISDN Forecast Methodology
- 7.1.2. Total MNO Direct Revenue from MSISDN Login
- Figure & Table 7.2: Total MNO Direct Revenue from MSISDN Login ($m), Split by 8 Key Regions, 2025-2029
- Table 7.3: Total Number of Mobile Devices Using MSISDN for Single Sign In (m), Split by 8 Key Regions, 2025-2029
- 7.1.1. MSISDN Methodology
8. Device-based Biometric Authentication
- 8.1. Device-based Biometric Authentication Introduction
- 8.1.1. Device-based Biometric Authentication Methodology
- Figure 8.1: Device-based Biometric Authentication Forecast Methodology
- 8.1.2. Total Number of Smartphones That are Capable of Biometric Authentication
- Figure & Table 8.2: Total Number of Smartphones That are Capable of Biometric Authentication (m), Split by 8 Key Regions, 2025-2029
- 8.1.1. Device-based Biometric Authentication Methodology
- 発行日
- 発行
- Juniper Research Ltd
- ページ情報
- 英文
- 納期
- 即日から翌営業日
