|
|
市場調査レポート
商品コード
1627226
ネットワークトークン化の世界市場:2025-2029年Global Network Tokenisation Market: 2025-2029 |
||||||
|
|||||||
|
|||||||

| ネットワークトークン化の世界市場:2025-2029年 |
|
出版日: 2025年01月08日
発行: Juniper Research Ltd
ページ情報: 英文
納期: 即日から翌営業日
|

全表示
- 概要
- 目次
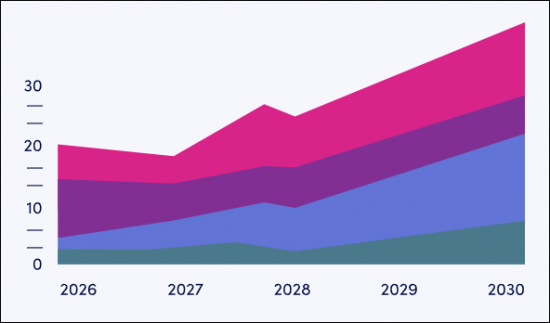
ネットワークトークン化のトランザクションは2029年には世界で5,740億に達する見通し
| 主要統計 | |
|---|---|
| 2025年のネットワークトークン化の総収益: | 41億米ドル |
| 2029年のネットワークトークン化の総収益 | 89億米ドル |
| 2025年から2029年の市場成長率: | 117.3% |
| 予測期間: | 2024-2029年 |
当調査スイートは、ネットワークトークン化を取り巻くエコシステムの包括的かつ詳細な分析を提供し、加盟店、決済ゲートウェイ、トークンサービスプロバイダー、トークン要求者などのステークホルダーが、今後の成長、主要動向、競合環境を理解することを可能にします。当スイートには、ネットワークトークン化のメリット、Click to Payがeコマース分野に与える影響、ネットワークトークン化をリードする地域の評価などが含まれています。
また、当スイートには、ネットワークトークン化の今後の成長機会をマッピングしたデータ、金融市場の最新動向と機会を明らかにした洞察に満ちた調査、ネットワークトークン化を促進する12のマーケットリーダーに関する広範な分析を収録した資料など、個別に購入可能なオプションがいくつか含まれています。
本レポートは、急速に発展するネットワークトークン化市場を理解する上で不可欠な資料となり、ステークホルダーが効果的な将来戦略を策定する上で役立ちます。包括的な洞察と広範な調査対象からなるこの調査スイートは、急成長する市場において、ナビゲートとプランニングを行うための貴重なツールです。
主な特徴
- 市場力学:ネットワークトークン化の採用促進要因・障壁など、市場の主要動向と市場拡大の課題について洞察します。レポートでは、ネットワークトークン化がチェックアウト体験に与える影響、IoT決済を促進する上でネットワークトークン化が果たす役割、ネットワークトークンがサブスクリプションビジネスなどの業界セグメントに与える影響の違いなどを取り上げています。また、主要8地域の現在の発展状況や成長セグメントに関する国別準備度指数や将来の展望も掲載しています。
- 主な要点と戦略的提言:ネットワークトークン化市場における主な発展機会と知見を詳細に分析し、ステークホルダーへの戦略的提言を添えています。
- ベンチマーク業界予測:ネットワークトークン化のデータセットには、ネットワークトークンのプロビジョニングと管理によって得られる総収益を含むネットワークトークン化市場の規模と、さまざまな市場セグメントのトランザクション数の予測が含まれています。
- Juniper Researchの競合リーダーボード:主要企業の市場規模を掲載し、ネットワークトークン化ベンダー12社の能力を評価します。
サンプルビュー
市場データ・予測レポート
市場動向・戦略レポート
市場データ&予測レポート
当調査スイートには、43の表と15,480のデータポイントの予測データ一式へのアクセスが含まれています。調査スイートには以下の指標が含まれます:
- ネットワークトークン化市場の総トランザクション・トークン・収益
- ネットワークトークン化市場の総トランザクション・収益:以下の区分別
- NFCモバイル決済
- リモートモバイル決済
- リモートPCおよびデスクトップ決済
- IoTペイメント
目次
市場動向・戦略
第1章 重要ポイントと戦略的推奨事項
- 重要ポイント
- 戦略的推奨事項
第2章 市場情勢
- ネットワークトークン化のプロセス:主要な関係者
- PCIトークン化とネットワークトークン化
- サブスクリプション経済におけるネットワークトークン
- 使い捨てトークン
- 詐欺への対処
- 導入の障壁
- 規制の影響
- ネットワークトークン化の利点
第3章 セグメント分析
- eコマース
- モバイル決済
- NFCモバイルトランザクション
- IoTトークン化
第4章 国別準備指数
- 国別準備指数:イントロダクション
- 重点市場
- 成長市場
- 新興国市場
競合リーダーボード
第1章 競合リーダーボード
第2章 企業プロファイル
- ネットワークトークン化ベンダープロファイル
- Adyen
- Carta Worldwide
- Fiserv
- G+D
- IDEMIA Secure Transactions
- IXOPAY
- Pagos
- PayPal Braintree
- Spreedly
- Thales
- VGS
- Worldpay
- 評価手法
データ&予測
第1章 市場概要
第2章 市場概要
- ネットワークトークン化トランザクションの総数
- ネットワークトークンの年間使用総数
- ネットワークトークン化の年間収益
第3章 eコマーストークン化
- トランザクション総数
- トークンの年間使用総数
- トークンプロビジョニングによる年間収益
- ネットワークトークン管理による年間収益
第4章 リモートモバイル決済ネットワークトークン化
- トランザクション総数
- トークンの年間使用総数
- トークンプロビジョニングによる年間収益
- ネットワークトークン管理による年間収益
第5章 NFCモバイルネットワークトークン化
- トランザクション総数
- トークンの年間使用総数
- トークンプロビジョニングによる年間収益
- ネットワークトークン管理による年間収益
第6章 IoTネットワークトークン化
- トランザクション総数
- トークンの年間使用総数
- トークンプロビジョニングによる年間収益
- ネットワークトークン管理による年間収益
'Network Tokenised Transactions to Reach 574 Billion Globally in 2029'
| KEY STATISTICS | |
|---|---|
| Total network tokenisation revenue in 2025: | $4.1bn |
| Total network tokenisation revenue in 2029: | $8.9bn |
| 2025 to 2029 market growth: | 117.3% |
| Forecast period: | 2024-2029 |
Overview
Our "Network Tokenisation" research suite provides a comprehensive and in-depth analysis of the ecosystem surrounding network tokenisation, enabling stakeholders such as merchants, payment gateways, token service providers and token requestors to understand future growth, key trends and the competitive environment. The report includes an assessment of the benefits of network tokenisation, the impact of Click to Pay on the eCommerce sector, and the regions which are leading network tokenisation.
The suite includes several different options that can be purchased separately, including access to data mapping the future growth of network tokenisation, an insightful study uncovering the latest trends and opportunities within the financial markets, and a document containing extensive analysis of the 12 market leaders facilitating network tokenisation. The coverage can also be purchased as a Full Research Suite, containing all these elements, at a substantial discount.
This report serves as an essential resource for understanding the rapidly evolving network tokenisation market, empowering stakeholders to shape effective future strategies. With its comprehensive insights and extensive coverage, this research suite is an invaluable tool for navigating and planning in a fast-growing landscape.
Key Features
- Market Dynamics: Insights into key trends and market expansion challenges within the network tokenisation market, including drivers and barriers for network tokenisation adoption. The report addresses the impact that network tokenisation can have on the checkout experience; the role that network tokenisation plays in facilitating IoT payments; and the differential impact that network tokens can have on industry segments such as subscription businesses. The research also features a Country Readiness Index on the current development and segment growth of the network tokenisation market across eight key regions, as well as providing a future outlook.
- Key Takeaways & Strategic Recommendations: In-depth analysis of key development opportunities and findings within the network tokenisation market, accompanied by strategic recommendations for stakeholders.
- Benchmark Industry Forecasts: The network tokenisation dataset includes forecasts for total value of the network tokenisation market, including the total revenue to be gained through provisioning and managing network tokens, and the transaction volume of various market segments.
- Juniper Research Competitor Leaderboard: Key market player capability and capacity assessment for 12 network tokenisation vendors, via the Juniper Research Competitor Leaderboard; featuring market size for major players in the network token platform market.
SAMPLE VIEW
Market Data & Forecasting Report
The numbers tell you what's happening, but our written report details why, alongside the methodologies.
Market Trends & Strategies Report
A comprehensive analysis of the current market landscape, alongside strategic recommendations.
Market Data & Forecasting Report
The market-leading research suite for the "Network Tokenisation" market includes access to the full set of forecast data of 43 tables and 15,480 datapoints. Metrics in the research suite include:
- Total Transaction Volume, Tokens, and Revenue Received from the Network Token Market
- Total Transaction Volume and Revenue of the Network Tokenisation Market, Split by the Following Market Segments:
- NFC Mobile Payments
- Remote Mobile Payments
- Remote PC and Desktop Payments
- IoT Payments
Juniper Research's Interactive Forecast Excel contains the following functionality:
- Statistics Analysis: Users benefit from the ability to search for specific metrics, displayed for all regions and countries across the data period. Graphs are easily modified and can be exported to the clipboard.
- Country Data Tool: This tool lets users look at metrics for all regions and countries in the forecast period. Users can refine the metrics displayed via a search bar.
- Country Comparison Tool: Users can select and compare specific countries. The ability to export graphs is included in this tool.
- What-if Analysis: Here, users can compare forecast metrics against their own assumptions, via five interactive scenarios.
Market Trends & Strategies Report
This report examines the "Network Tokenisation" market landscape in depth; assessing trends and factors shaping the evolution of this rapidly growing market. The report delivers comprehensive analysis of the strategic opportunities for payment processors and network tokenisation platforms; addressing key verticals such as eCommerce, in-store, and IoT use of network tokens. This report also includes evaluation of key country-level opportunities for stakeholders in the network tokenisation market.
Competitor Leaderboard Report
The Competitor Leaderboard report provides a detailed evaluation and market positioning for 12 leading vendors in the "Network Tokenisation" space. The vendors are positioned as established leaders, leading challengers, or disruptors and challengers, based on capacity and capability assessments:
|
|
This document is centred around the Juniper Research Competitor Leaderboard; a vendor positioning tool that provides an at-a-glance view of the competitive landscape in a market, backed by a robust methodology.
Table of Contents
Market Trends & Strategies
1. Key Takeaways & Strategic Recommendations
- 1.1. Key Takeaways
- 1.2. Strategic Recommendations
2. Market Landscape
- 2.1. Introduction
- 2.1.1. A Timeline of Network Tokenisation
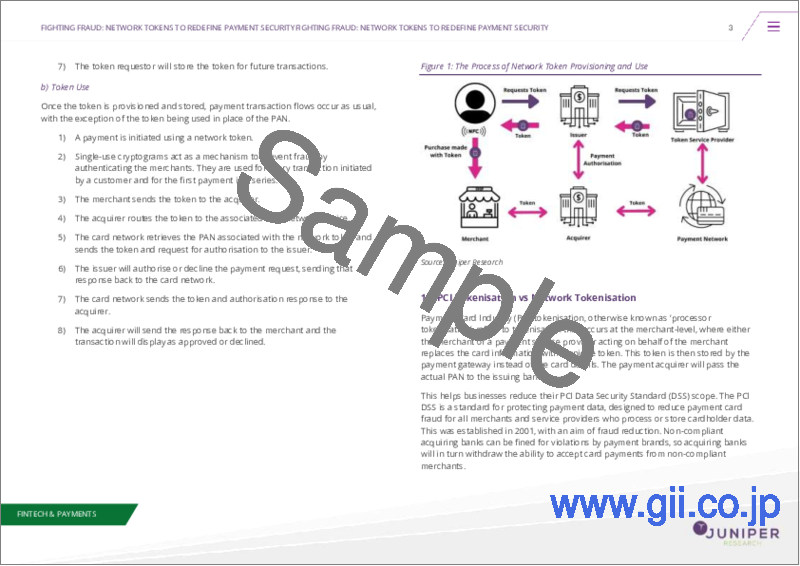
- 2.2. Process of Network Tokenisation: Key Actors
- Figure 2.1: The Process of Network Token Provisioning and Use
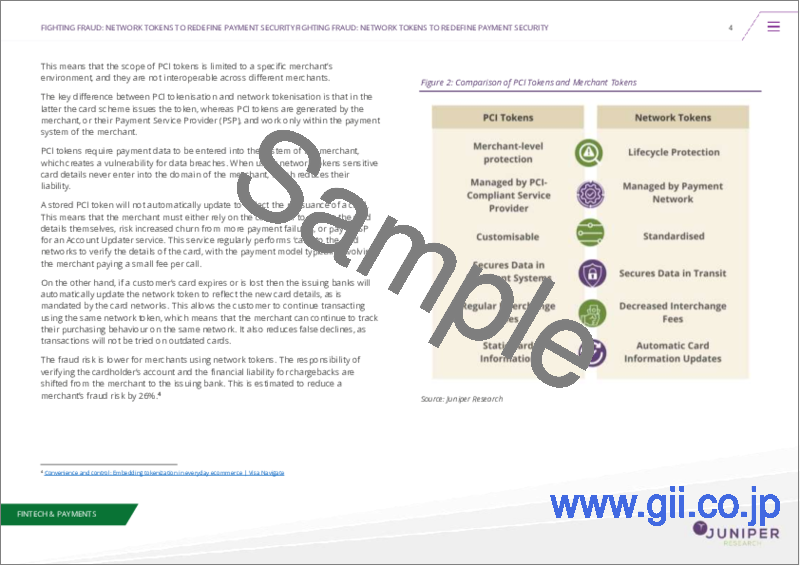
- 2.3. PCI Tokenisation vs Network Tokenisation
- Figure 2.2: Comparison of PCI Tokens and Merchant Tokens
- 2.4. Network Tokens in a Subscription Economy
- 2.5. Single-use Tokens
- 2.6. Addressing Fraud
- Figure 2.3: Total Value of Fraudulent Digital Good Transactions ($m), Split across 8 Key Regions, 2024-2029
- 2.7. Barriers to Adoption
- 2.8. Regulatory Effects
- i. Payment Services Directive (PSD)2/PSD3
- 2.8. Benefits of Network Tokenisation
3. Segment Analysis
- 3.1. Introduction
- 3.2. eCommerce
- Figure 3.1: Total eCommerce Transaction Value ($m), Split by 8 Key Regions, 2024-2029
- Figure 3.2: Mastercard Click to Pay
- Figure 3.3: Click to Pay Implementation Ecosystem
- 3.2.2. Mobile Payments
- Figure 3.4: Total Number of Remote Mobile Transactions (m), 2024-2029, Split by 8 Key Regions
- 3.2.3. NFC Mobile Transactions
- Figure 3.5: NFC Retail Transaction Volume, 2024-2029, Split by 8 Key Regions
- 3.3. IoT Tokenisation
4. Country Readiness Index
- 4.1. Introduction to Country Readiness Index
- Figure 4.1: Network Tokenisation Country Readiness Index: Regional Definitions
- Table 4.2: Juniper Research Country Readiness Scoring Index: Network Tokenisation
- Figure 4.3: Juniper Research Country Readiness Index: Network Tokenisation
- Table 4.4: Network Tokenisation Country Readiness Index: Market Segments
- 4.2. Focus Market
- Figure 4.5: Total Number of Network Tokenised Transactions (m), Split by Top Countries, 2024-2029
- i. Emerging Markets with Rapid Digital Payment Adoption
- ii. Developed Economies with Strong eCommerce Markets
- 4.2.2. Investment in Fraud Detection and Prevention
- i. India
- 4.3. Growth Market
- Figure 4.6: Total Network Tokenisation Revenue ($m) for Notable Growth Markets, 2024-2029
- i.Growth in Card Penetration
- 4.4. Saturated Market
- Figure 4.7: Network Tokenisation Revenue ($m) from Nine Notable Saturated Markets, 2024-2029
- i. High Card Penetration
- ii. Opportunities: IoT
- 4.5. Developing Markets
- i. Cash Reliance
- Figure 4.8: Total Network Tokenisation Revenue ($m) for Notable Developing Markets, 2024-2029
- ii. Leapfrogging of Cards
- Table 4.9: Juniper Research's Country Readiness Index Heatmap: North America
- Table 4.10: Juniper Research's Country Readiness Index Heatmap: Latin America
- Table 4.11: Juniper Research's Country Readiness Index Heatmap: West Europe
- Table 4.12: Juniper Research's Country Readiness Index Heatmap: Central & Eastern Europe
- Table 4.13: Juniper Research's Country Readiness Index Heatmap: Far East & China
- Table 4.14: Juniper Research's Country Readiness Index Heatmap: Indian Subcontinent
- Figure 4.15: Juniper Research's Country Readiness Index Heatmap: Rest of Asia Pacific
- Table 4.16: Juniper Research's Country Readiness Index Heatmap: Africa & Middle East
- i. Cash Reliance
Competitor Leaderboard
1. Competitor Leaderboard
- 1.1. Why Read This Report
- Figure 1.1: Juniper Research Competitor Leaderboard Vendors: Network Tokenisation
- Figure 1.2: Juniper Research Competitor Leaderboard: Network Tokenisation
- Figure 1.3: Juniper Research Competitor Leaderboard: Network Tokenisation Vendor Ranking
- Table 1.4: Juniper Research Competitor Leaderboard Network Tokenisation - Heatmap
2. Company Profiles
- 2.1. Network Tokenisation Vendor Profiles
- 2.1.1. Adyen
- i. Corporate
- Table 2.1: Adyen's Revenue and Growth, ( Euro billion), 2021-2023
- ii. Geographical Spread
- iii. Key Clients & Strategic Partnerships
- iv. High-level View of Offerings
- v. Juniper Research's View: Key Strengths & Strategic Opportunities
- i. Corporate
- 2.1.2. Carta Worldwide
- i. Corporate
- ii. Geographical Spread
- iii. Key Clients & Strategic Partnerships
- Figure 2.2: Carta Worldwide Fintech Customers
- iv. High-level View of Offerings
- v. Juniper Research's View: Key Strengths & Strategic Opportunities
- 2.1.3. Fiserv
- i. Corporate
- Figure 2.3: Fiserv's Financial Information Snapshot ($b)
- ii. Geographical Spread
- iii. Key Clients & Strategic Partnerships
- iv. High-level View of Offerings
- Figure 2.4: Fiserv's Role in Tokenisation
- v. Juniper Research's View: Key Strengths & Strategic Opportunities
- i. Corporate
- 2.1.4. G+D
- i. Corporate
- ii. Geographical Spread
- iii. Key Clients & Strategic Partnerships
- iv. High-level View of Offerings
- Figure 2.5: Visualisation of G+D Convego Service Broker
- v. Juniper Research's View: Key Strengths & Strategic Opportunities
- 2.1.5. IDEMIA Secure Transactions
- i. Corporate
- ii. Geographical Spread
- iii. Key Clients & Strategic Partnerships
- iv. High-level View of Offerings
- v. Juniper Research's View: Key Strengths & Strategic Opportunities
- 2.1.6. IXOPAY
- i. Corporate
- ii. Geographical Spread
- iii. Key Clients & Strategic Partnerships
- iv. High-level View of Offerings
- Figure 2.6: How IXOPAY's platform works
- v. Juniper Research's View: Key Strengths & Strategic Opportunities
- 2.1.7. Pagos
- i. Corporate
- ii. Geographical Spread
- iii. Key Clients & Strategic Partnerships
- iv. High-level View of Offerings
- Figure 2.7: Pagos' Visualise, Analyse, Detect, Act, Repeat!
- v. Juniper Research's View: Key Strengths & Strategic Opportunities
- 2.1.8. PayPal Braintree
- i. Corporate
- ii. Geographical Spread
- iii. Key Clients & Strategic Partnerships
- iv. High-level View of Offerings
- Figure 2.8: Braintree Direct Product
- v. Juniper Research's View: Key Strengths & Strategic Opportunities
- 2.1.9. Spreedly
- i. Corporate
- ii. Geographical Spread
- iii. Key Clients & Strategic Partnerships
- iv. High-level View of Offerings
- v. Juniper Research's View: Key Strengths & Strategic Opportunities
- 2.1.10. Thales
- i. Corporate
- Figure 2.9: Thales' Financial Snapshot ($ Euro), FY 2023-2022
- ii. Geographical Spread
- iii. Key Clients & Strategic Partnerships
- iv. High-level View of Offerings
- v. Juniper Research's View: Key Strengths & Strategic Opportunities
- i. Corporate
- 2.1.11. VGS
- i. Corporate
- Founded in 2015 as Very Good Security, VGS is a cloud-based tokenisation platform built to facilitate payments across channels and comply with PCI standards. As part of the VGS mission to protect the world's sensitive data, VGS provides large banks, aspiring fintechs, and growing merchants with a universal token vault. VGS provides solutions for Fortune 500 companies and as a result has 4 billion tokens held globally, 30 million annual interactions, and stores 70% all US cards.
- ii. Geographic Spread
- iii. Key Clients & Strategic Opportunities
- iv. High-level View of Offerings
- v. Juniper Research's View: Key Strengths & Strategic Opportunities
- i. Corporate
- 2.1.12. Worldpay
- i. Corporate
- ii. Geographical Spread
- iii. Key Clients & Strategic Partnerships
- iv. High-level View of Offerings
- v. Juniper Research's View: Key Strengths & Strategic Opportunities
- 2.1.1. Adyen
- 2.2. Juniper Research Leaderboard Assessment Methodology
- 2.2.1. Limitations & Interpretations
- Table 2.10: Juniper Research Leaderboard Assessment Criteria: Network Tokenisation
- 2.2.1. Limitations & Interpretations
Data & Forecasting
1. Market Overview
- 1.1. Introduction
- 1.2. Methodology & Assumptions
- Figure 1.1. eCommerce Network Tokenisation Methodology
- Figure 1.2. Mobile Payment Network Tokenisation Methodology
- Figure 1.3. IoT Network Tokenisation Methodology
- Figure 1.4:NFC Mobile Network Tokenisation Methodology
2. Market Summary
- 2.1. Total Number of Network Tokenised Transactions
- Figure & Table 2.1: Total Volume of Network Tokenised Transactions (m), Split 8 Key Regions, 2024-2029
- 2.1.1. Total Number of Network Tokens in Use per Annum
- Figure & Table 2.2: Total Network Tokens Used per Annum (m), Split by 8 Key Regions, 2024-2029
- 2.1.2. Total Network Tokenisation Revenue per Annum ($m)
- Figure 2.3: Total Network Tokenisation Revenue per Annum, ($m), Split across Key Regions, 2024-2029
3. eCommerce Tokenisation
- 3.1.1. Total Volume of eCommerce Network Tokenisation Transactions
- Figure & Table 3.1: Total Number of PC eCommerce Network Tokenised Transactions (m), Split by 8 Key Regions, 2024-2029
- 3.1.2. Total Number of eCommerce Network Tokens in Use per Annum
- Figure & Table 3.2: Number of PC eCommerce Network Tokens in Use (m), Split by 8 Key Regions, 2024-2029
- 3.1.3. Revenue from eCommerce Network Token Provisioning per Annum
- Figure & Table 3.3: Revenue from eCommerce Network Token Provisioning per Annum ($m), Split by 8 Key Regions, 2024-2029
- 3.1.4. Revenue from eCommerce Network Token Management per Annum
- Figure & Table 3.4: Revenue for eCommerce Network Token Management per Annum ($m), Split by 8 Key Regions, 2024-2029
4. Remote Mobile Payments Network Tokenisation
- 4.1.1. Total Volume of Remote Mobile Payments Network Tokenised Transactions
- Figure & Table 4.1: Total Remote Mobile Payments Network Tokenised Transactions (m), Split by 8 Key Regions, 2024-2029
- 4.1.2. Total Number of Mobile Network Tokens in Use per Annum
- Figure & Table 4.2: Total Number of Mobile Network Tokens in Use per Annum (m), Split by 8 Key Regions, 2024-2029
- 4.1.3. Revenue from Mobile Payment Network Token Provisioning per Annum
- Figure &Table 4.3: Mobile Payment Network Token Provisioning Revenue ($m), Split by 8 Key Regions, 2024-2029
- 4.1.4. Revenue from Mobile Payment Network Token Management per Annum
- Figure & Table 4.4: Mobile Payment Network Token Management Revenue ($m), Split by 8 Key Regions, 2024-2029
5. NFC Mobile Network Tokenisation
- 5.1.1. Total Number of NFC Mobile Network Tokenised Transactions
- Figure & Table 5.1: Total Number of NFC Mobile Network Tokenised Transactions (m), Split by 8 Key Regions, 2024-2029
- 5.1.2. Total Number of NFC Mobile Network Tokens in Use
- Figure & Table 5.2: Total Number of NFC Mobile Network Tokens in Use (m), Split by 8 Key Regions, 2024-2029
- 5.1.3. Revenue from NFC Mobile Network Token Provisioning per Annum
- Figure & Table 5.3: Revenue from NFC Mobile Network Provisioning per Annum ($m), Split by 8 Key Regions, 2024-2029
- 5.1.4. Revenue from NFC Network Token Management per Annum
- Figure & Table 5.4: Revenue from NFC Network Token Management ($m), Split by 8 Key Regions, 2024-2029
6. IoT Network Tokenisation
- 6.1.1. Total Number of IoT Network Tokenised Transactions
- Figure & Table 6.1: Total Number of IoT Network Tokenised Transactions (m), Split by 8 Key Regions, 2024-2029
- 6.1.2. Total Number of IoT Network Tokens in Use
- Figure & Table 6.2: Total Number of Network Tokens in Use (m), Split by 8 Key Regions, 2024-2029
- 6.1.3. Total Revenue from IoT Network Token Provisioning per Annum
- Figure & Table 6.3: Total Revenue from IoT Network Provisioning per annum (m), Split by 8 Key Regions, 2024-2029
- 6.1.4. Revenue from IoT Network Token Management per Annum
- Figure & Table 6.4: Revenue from IoT Network Token Management ($m), Split 8 Key Regions, 2024-2029

