|
|
市場調査レポート
商品コード
1589862
IoTサイバーセキュリティの世界市場:2024-2029年Global IoT Cybersecurity Market: 2024-2029 |
||||||

|
|||||||
|
|||||||

| IoTサイバーセキュリティの世界市場:2024-2029年 |
|
出版日: 2024年11月20日
発行: Juniper Research Ltd
ページ情報: 英文
納期: 即日から翌営業日
|

全表示
- 概要
- 目次
"IoTサイバーセキュリティの市場規模は2029年には世界で600億米ドルに達する見通し"
| 主要統計 | |
|---|---|
| 2024年の総収益: | 270億ポンド |
| 2029年の総収益: | 600億米ドル |
| 2021~2029年の市場成長率: | 124% |
| 予測期間: | 2024-2029年 |
当調査スイートは、IoTサイバーセキュリティサービスプロバイダー、規制関係者、製造業者などのステークホルダーが将来の成長、主要動向、競合環境を理解できるよう、進化するIoTサイバーセキュリティ市場を詳細かつ洞察的に分析します。また、ネットワークセキュリティ、プラットフォームセキュリティ、エンドポイントセキュリティ、アプリケーションセキュリティなど、IoTサイバーセキュリティの主要セグメントの現在の動向と重要な収益化の機会を分析する製品・サービス分析も含まれています。
当調査スイートには、今後5年間のIoTサイバーセキュリティサービスの導入と今後の成長をマッピングしたデータへのアクセスや、主要なIoTサイバーセキュリティセグメント (ネットワークセキュリティ、プラットフォームセキュリティ、エンドポイントセキュリティ、アプリケーションセキュリティ、その他のセキュリティソリューション) ごとに分割されたデータなど、個別に購入できるいくつかのオプションが含まれています。
また、サイバーセキュリティにおけるブロックチェーンの利用など、IoTサイバーセキュリティ市場における最新の動向と機会を明らかにする洞察に満ちた調査や、IoTサイバーセキュリティ分野における市場リーダー17社に関する広範な分析も提供しています。
主な特徴:
- 主要要点・戦略的提言:IoTサイバーセキュリティ市場における主な成長機会と知見を詳細に分析し、IoTサイバーセキュリティベンダー、OEM、規制当局への戦略的提言を添えています。
- 市場の展望:IoTサイバーセキュリティ市場における重要な動向と市場拡大の課題について洞察し、限られたサイバーセキュリティ予算とIoTネットワークの複雑性がもたらす課題に対処します。IoTサイバーセキュリティサービスプロバイダー、製造業者、規制当局が現在の市場課題を克服するための提言を提供し、主要な収益化の機会を明らかにします。また、IoT導入の急増、規制状況の増加、サイバー攻撃の増加など、市場成長の主な促進要因についても分析しています。
- 業界予測ベンチマーク:総収益、IoTサイバーセキュリティを採用する企業の総数、IoTサイバーセキュリティによって保護されるIoTデバイスの総数など、IoTサイバーセキュリティの市場規模と予測を提供します。予測ではさらに、総収益と企業導入数をネットワークセキュリティ、プラットフォームセキュリティ、エンドポイントセキュリティ、アプリケーションセキュリティ、その他のIoTサイバーセキュリティソリューションの各セグメントに分類しています。
- Juniper Researchの競合リーダーボード:Juniper Researchの競合リーダーボードを通じて、IoTサイバーセキュリティベンダー17社の能力を評価します。
サンプルビュー
市場データ・予測レポート
市場動向・戦略レポート
市場データ&予測レポート
本調査スイートには、40の表と18,200以上のデータポイントの予測データ一式へのアクセスが含まれています。調査スイートには以下の指標が含まれます:
- IoTの総導入数
- IoTサイバーセキュリティソリューションを採用する企業の総数
- IoTサイバーセキュリティの総収益
これらの指標は、以下の主要市場別で提供されています:
- アプリケーションセキュリティ
- エンドポイントセキュリティ
- ネットワークセキュリティ
- プラットフォームセキュリティ
- その他
Juniper Researchのインタラクティブ予測 (Excel) には、次の機能があります:
- 統計分析:データ期間中のすべての地域と国について表示される特定のメトリクスを検索できます。グラフは簡単に変更でき、クリップボードへのエクスポートも可能です。
- 国別データツール:このツールでは、予測期間中のすべての地域と国の指標を見ることができます。検索バーで表示される指標を絞り込むことができます。
- 国別比較ツール:特定の国を選択して比較することができます。このツールにはグラフをエクスポートする機能が含まれています。
- What-if分析:5つのインタラクティブなシナリオにより、ユーザーは予測の前提条件と比較することができます。
目次
市場動向・戦略
第1章 重要ポイント・戦略的推奨事項
- 重要ポイント
- 戦略的推奨事項
第2章 将来の市場展望:促進要因・課題
- サイバー脅威
- IoTサイバーセキュリティソリューション
- 市場促進要因
- 拡大するIoT導入
- 攻撃の増加
- 国の規制と法律
- 課題
- IoTネットワークの複雑さ
- 法的認証の欠如
- サイバーセキュリティ予算
- 教育の欠如
第3章 市場動向
- ゼロトラストアーキテクチャ
- AIと機械学習
- エッジコンピューティング
- 量子通信とポスト量子暗号
- ブロックチェーン
- OTAアップデート
第4章 製品およびサービスの分析
- ネットワークセキュリティ
- プラットフォームセキュリティ
- アプリケーションセキュリティ
- エンドポイントセキュリティ
- マネージドセキュリティサービス
- プロフェッショナルセキュリティサービス
競合リーダーボード
第1章 Juniper Researchの競合リーダーボード
第2章 企業プロファイル
- IoTサイバーセキュリティ-ベンダープロファイル
- Armis
- AWS
- Broadcom
- Cisco
- Claroty
- Entrust
- Forescout
- Fortinet
- Honeywell
- IBM
- Intel
- Microsoft
- Palo Alto Networks
- Ping Identity
- Rapid7
- Thales
- Trend Micro
- リーダーボード評価手法
データ・予測
第1章 IoTサイバーセキュリティ:予測・重要ポイント
- IoTサイバーセキュリティ市場の概要と将来の展望
- 予測手法
第2章 世界のIoTサイバーセキュリティ市場
- IoTサイバーセキュリティソリューションの導入企業総数
- IoTサイバーセキュリティの総収益
第3章 ネットワークセキュリティ
- ネットワークセキュリティの総収益
- ネットワークセキュリティハードウェアの総コスト
第4章 エンドポイントセキュリティ
- エンドポイントセキュリティで保護されているIoTデバイスの総数
- エンドポイントセキュリティの総収益
第5章 プラットフォームセキュリティ
- プラットフォームセキュリティの総収益
- プラットフォームセキュリティの導入企業数
第6章 アプリケーションセキュリティ
- アプリケーションセキュリティ
- アプリケーションセキュリティの導入企業数
第7章 その他のセキュリティソリューション
- その他のセキュリティソリューションの収益
- その他のセキュリティソリューションハードウェアの総コスト
'IoT Cybersecurity Market to Reach $60 Billion Globally by 2029'
| KEY STATISTICS | |
|---|---|
| Total revenue in 2024: | Pound-27bn |
| Total revenue in 2029: | $60bn |
| 2021 to 2029 market growth: | 124% |
| Forecast period: | 2024-2029 |
Overview
Juniper Research's "IoT Cybersecurity" research suite provides a detailed and insightful analysis of this evolving market; enabling stakeholders including IoT cybersecurity service providers, regulators, and manufacturers to understand future growth, key trends, and the competitive environment. Additionally, it includes a product and service analysis that studies the current trends and critical monetisation opportunities of the key segments of IoT cybersecurity including network security, platform security, endpoint security and application security. The coverage can also be purchased as a full research suite, containing all of these elements, at a substantial discount.
The research suite includes several different options that can be purchased separately, including access to data mapping the adoption and future growth of IoT cybersecurity service over the next five years, split by the key IoT cybersecurity segments: network security, platform security, endpoint security, application security, and other security solutions.
It also provides an insightful study uncovering the latest trends and opportunities within the IoT cybersecurity market, such as the use of blockchain in cybersecurity, and a document containing an extensive analysis of the 17 market leaders in the IoT cybersecurity space.
Collectively, these documents provide a critical tool for understanding this fast-evolving market, allowing IoT cybersecurity providers and manufacturers to shape their future strategy and capitalise on future growth opportunities in digitally transforming regions. Its extensive coverage makes this research suite a valuable tool for navigating this rapidly growing market in the midst of an increasing regulatory landscape.
Key Features
- Key Takeaways & Strategic Recommendations: In-depth analysis of key development opportunities and findings within the IoT cybersecurity market, accompanied by strategic recommendations for IoT cybersecurity vendors, OEMs, and regulators.
- Market Outlook: Insights into critical trends and market expansion challenges within the IoT cybersecurity market; addressing those posed by limited cybersecurity budgets and IoT network complexity. It provides recommendations for IoT cybersecurity service providers, manufacturers, and regulators to overcome the current market challenges and highlights key monetisation opportunities. It also analyses the main drivers behind market growth, including the rapid growth of IoT deployments, increasing regulatory landscapes, and the growing number of cyber-attacks.
- Benchmark Industry Forecasts: The market size and forecast for IoT cybersecurity including total revenue, total businesses adopting IoT cybersecurity, and total number of IoT devices protected by IoT cybersecurity. The forecast further breaks down total revenue and business adoption into the following segments: network security, platform security, endpoint security, application security, and other IoT cybersecurity solutions.
- Juniper Research Competitor Leaderboard: Key player capability and capacity assessment for 17 IoT cybersecurity vendors, via the Juniper Research Competitor Leaderboard, featuring IoT cybersecurity market size for major players in the IoT cybersecurity industry.
SAMPLE VIEW
Market Data & Forecasting Report
The numbers tell you what's happening, but our written report details why, alongside the methodologies.
Market Trends & Strategies Report
A comprehensive analysis of the current market landscape, alongside strategic recommendations.
Market Data & Forecasting Report
The market-leading research suite for the "IoT Cybersecurity" market includes access to the full set of forecast data of 40 tables and over 18,200 datapoints. Metrics in the research suite include:
- Total Number of IoT Deployments
- Total Number of Businesses Adopting IoT Cybersecurity Solutions
- Total IoT Cybersecurity Revenue
These metrics are provided for the following key market verticals:
- Application Security
- Endpoint Security
- Network Security
- Platform Security
- Other
Juniper Research Interactive Forecast Excel contains the following functionality:
- Statistics Analysis: Users benefit from the ability to search for specific metrics, displayed for all regions and countries across the data period. Graphs are easily modified and can be exported to the clipboard.
- Country Data Tool: This tool lets users look at metrics for all regions and countries in the forecast period. Users can refine the metrics displayed via a search bar.
- Country Comparison Tool: Users can select and compare specific countries. The ability to export graphs is included in this tool.
- What-if Analysis: Here, users can compare forecast metrics against their own assumptions, via five interactive scenarios.
Market Trends & Strategies Report
This report examines the "IoT Cybersecurity" market landscape in detail; assessing market trends and factors shaping the evolution of this rapidly growing market. As IoT deployments continue to rise globally, cyber-attacks are increasing in volume and sophistication; driving market trends such as AI-and blockchain adoption in IoT cybersecurity solutions and services. However, IoT network complexity and low cybersecurity budgets restrain the market from full growth.
This report delivers a comprehensive analysis of the strategic opportunities for IoT cybersecurity service providers and manufacturers; analysing developing challenges and highlighting opportunities in key industries as well as assessing how stakeholders should navigate these. It also includes an evaluation of key segment opportunities for IoT cybersecurity services operators, underlining markets with the highest potential for growth.
Competitor Leaderboard Report
The Competitor Leaderboard report provides a detailed evaluation and market positioning for 17 leading vendors in the IoT cybersecurity space. The vendors are positioned as an established leader, leading challenger or disruptor and challenger, based on capacity and capability assessments:
|
|
This document is centred on the Juniper Research Competitor Leaderboard; a vendor positioning tool that provides an at-a-glance view of the competitive landscape in a market, backed by a robust methodology.
Table of Contents
Market Trends & Strategies
1. Key Takeaways & Strategic Recommendations
- 1.1. Key Takeaways
- 1.2. Strategic Recommendations
2. Future Market Outlook: Drivers and Challenges
- 2.1. Introduction
- 2.2. Cyber Threats
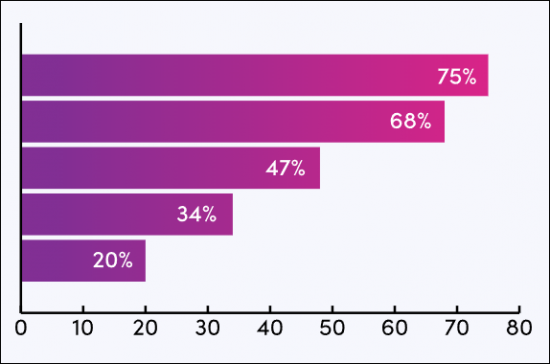
- Table 2.1: Summary of Common Cyber Attacks, Split by Type
- 2.3. IoT Cybersecurity Solutions
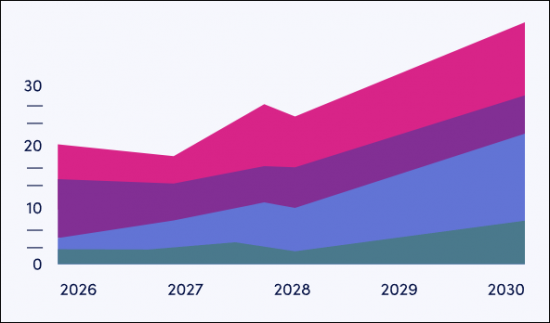
- Figure 2.2: Total IoT Cybersecurity Revenue (m), 2024-2029, Split by Key Market Segments
- i. Network Security
- Figure 2.3: Total Revenue from Network Security (m) 2024-2029, Spilt by 8Key Regions
- ii. Application Security
- iii. Cloud Security
- iv. Endpoint Security
- Figure 2.4: Total Revenue from Endpoint Security (m) 2024-2029, Spilt by 8Key Regions
- Figure 2.5: Types of IoT Cybersecurity in an IoT Ecosystem
- 2.4. Market Drivers
- 2.4.1. Growing IoT Deployments
- Figure 2.6: Total IoT Deployment (m) 2024-2029, Split by 8Key Regions
- 2.4.2. Increased Attacks
- 2.4.3. National Regulations and Laws
- Figure 2.7: Summary of Key National Regulations
- Source: Juniper Research
- Figure 2.7: Summary of Key National Regulations
- 2.4.1. Growing IoT Deployments
- 2.5. Challenges
- 2.5.1. IoT Network Complexity
- 2.5.2. Lack of Legal Certifications
- 2.5.3. Cybersecurity Budgets
- 2.5.4. Lack of Education
3. Market Trends
- 3.1. Introduction
- 3.1.1. Zero Trust Architecture
- Figure 3.1: The Five Pillars of Zero Trust Architecture
- 3.1.2. AI and Machine Learning
- 3.1.3. Edge Computing
- 3.1.4. Quantum Communications and Post-Quantum Cryptography
- 3.1.5. Blockchain
- Figure 3.2: The Advantages of Blockchain for IoT Cybersecurity
- 3.1.6. OTA Updates
- 3.1.1. Zero Trust Architecture
4. Product and Service Analysis
- 4.1. Introduction
- 4.1.1. Network Security
- i. Future Market Landscape
- ii. Key Monetisation Opportunities
- 4.1.2. Platform Security
- i. Future Market Outlook
- ii. Key Monetisation Opportunities
- Figure 4.1: Total Number of Businesses Adopting Platform Security Solutions 2024-2029, Split By 8Key Regions
- 4.1.3. Application Security
- i. Future Market Outlook
- ii. Key Monetisation Opportunities
- Figure 4.2: Total Number of Businesses Adopting Application Security Solutions 2024-2029, Split By 8Key Regions
- 4.1.4. Endpoint Security
- i. Future Market Outlook
- ii. Key Monetisation Opportunities
- 4.1.5. Managed Security Services
- 4.1.6. Professional Security Services
- 4.1.1. Network Security
Competitor Leaderboard
1. Juniper Research Competitor Leaderboard
- 1.1. Why Read this Report?
- Table 1.1: Juniper Research Competitor Leaderboard: IoT Cybersecurity Providers: Product & Portfolio (Part 1)
- Source: Juniper Research
- Figure 1.2: Juniper Research Competitor Leaderboard: IoT Cybersecurity Providers
- Figure 1.3: Juniper Research Competitor Leaderboard: Vendor & Position
- Source: Juniper Research
- Table 1.5: Juniper Research Competitor Leaderboard Heatmap - IoT Cybersecurity Vendors
- Table 1.1: Juniper Research Competitor Leaderboard: IoT Cybersecurity Providers: Product & Portfolio (Part 1)
2. Company Profiles
- 2.1. IoT Cybersecurity - Vendor Profiles
- 2.1.1. Armis
- i. Corporate
- ii. Geographical Spread
- iii. Key Clients and Strategic Partnerships
- iv. High-level View of Offerings
- Figure 2.1: Armis' Centrix Platform Ecosystem
- v. Juniper Research's View: Key Strengths and Strategic Development Opportunities
- 2.1.1. Armis
- 2.2. AWS
- i. Corporate
- Table 2.2: AWS Financial Summary ($m), 2022-2023
- ii. Geographical Spread
- iii. Key Clients and Strategic Partnerships
- iv. High-level View of Offerings
- v. Juniper Research's View: Key Strengths and Strategic Development Opportunities
- 2.2.2. Broadcom
- i. Corporate
- Table 2.3: Broadcom's Financial Summary ($m), 2022-2023
- ii. Geographical Spread
- iii. Key Clients and Strategic Partnerships
- iv. High-level View of Offerings
- v. Juniper Research's View: Key Strengths and Strategic Development Opportunities
- i. Corporate
- 2.2.3. Cisco
- i. Corporate
- Table 2.4: Cisco's Financial Summary ($m), 2022-2023
- ii. Geographical Spread
- iii. Key Clients and Strategic Partnerships
- iv. High-level View of Offerings
- v. Juniper Research's View: Key Strengths and Strategic Development Opportunities
- i. Corporate
- 2.2.4. Claroty
- i. Corporate
- ii. Geographical Spread
- iii. Key Clients and Strategic Partnerships
- iv. High-level View of Offerings
- v. Juniper Research's View: Key Strengths and Strategic Development Opportunities
- 2.2.5. Entrust
- i. Corporate
- Table 2.5: Entrust's Financial Summary ($m), 2022-2023
- ii. Geographical Spread
- iii. Key Clients and Strategic Partnerships
- iv. High-level View of Offerings
- v. Juniper Research's View: Key Strengths and Strategic Development Opportunities
- i. Corporate
- Forescout
- i. Corporate
- ii. Geographical Spread
- iii. Key Clients and Strategic Partnerships
- iv. High-level View of Offerings
- Figure 2.6: Summary of the Key Features of the Forescout Platform
- v. Juniper Research's View: Key Strengths and Strategic Development Opportunities
- 2.2.2. Fortinet
- i. Corporate
- Table 2.7: Fortinet's Financial Summary ($m), 2022-2023
- ii. Geographical Spread
- iii. Key Clients and Strategic Partnerships
- iv. High-level View of Offerings
- v. Juniper Research's View: Key Strengths and Strategic Development Opportunities
- i. Corporate
- 2.2.3. Honeywell
- i. Corporate
- Table 2.8: Honeywell's Financial Summary ($m), 2020-2022
- ii. Geographical Spread
- iii. Key Clients and Strategic Partnerships
- iv. High-level View of Offerings
- v. Juniper Research's View: Key Strengths and Strategic Development Opportunities
- i. Corporate
- 2.2.4. IBM
- i. Corporate
- Table 2.9: IBM's Financial Summary ($m), 2022-2023
- ii. Geographical Spread
- iii. Key Clients and Strategic Partnerships
- iv. High-level View of Offerings
- v. Juniper Research's View: Key Strengths and Strategic Development Opportunities
- i. Corporate
- 2.2.5. Intel
- i. Corporate
- Table 2.10: Intel's Financial Summary ($m), 2022-2023
- ii. Geographical Spread
- iii. Key Clients and Strategic Partnerships
- iv. High-level View of Offerings
- v. Juniper Research's View: Key Strengths and Strategic Development Opportunities
- i. Corporate
- 2.2.6. Microsoft
- i. Corporate
- Table 2.11: Microsoft's Financial Summary ($m), 2022-2023
- ii. Geographical Spread
- iii. Key Clients and Strategic Partnerships
- iv. High-level View of Offerings
- v. Juniper Research's View: Key Strengths and Strategic Development Opportunities
- i. Corporate
- 2.2.7. Palo Alto Networks
- i. Corporate
- Table 2.12: Palo Alto Network's Financial Summary ($m), 2022-2023
- ii. Geographical Spread
- iii. Key Clients and Strategic Partnerships
- iv. High-level View of Offerings
- v. Juniper Research's View: Key Strengths and Strategic Development Opportunities
- i. Corporate
- 2.2.8. Ping Identity
- i. Corporate
- ii. Geographical Spread
- iii. Key Clients and Strategic Partnerships
- iv. High-level View of Offerings
- v. Juniper Research's View: Key Strengths and Strategic Development Opportunities
- 2.2.9. Rapid7
- i. Corporate
- Table 2.13: Rapid7's Financial Summary ($m), 2022-2023
- ii. Geographical Spread
- iii. Key Clients and Strategic Partnerships
- iv. High-level View of Offerings
- Figure 2.14: Summary of the Key Features of Rapid7's Command Platform
- v. Juniper Research's View: Key Strengths and Strategic Development Opportunities
- i. Corporate
- 2.2.10. Thales
- i. Corporate
- Table 2.15: Thales' Financial Summary ($m), 2022-2023
- ii. Geographical Spread
- iii. Key Clients and Strategic Partnerships
- iv. High-level View of Offerings
- Figure 2.16: Thales' Data Protection Services
- v. Juniper Research's View: Key Strengths and Strategic Development Opportunities
- i. Corporate
- 2.2.11. Trend Micro
- i. Corporate
- Table 2.17: Trend Micro's Financial Summary ($m), 2022-2023
- ii. Geographical Spread
- iii. Key Clients and Strategic Partnerships
- iv. High-level View of Offerings
- Figure 2.18: Summary of Trend Micro's Trend Vision One Platform features
- v. Juniper Research's View: Key Strengths and Strategic Development Opportunities
- i. Corporate
- i. Corporate
- 2.3. Juniper Research Leaderboard Assessment Methodology
- 2.3.1. Limitation & Interpretations
- Table 2.19: Juniper Research Competitor Leaderboard Scoring Criteria
- 2.3.1. Limitation & Interpretations
Data & Forecasting
1. IoT Cybersecurity Forecast and Key Takeaways
- 1.1. IoT Cybersecurity Market Summary & Future Outlook
- 1.2. Forecast Methodology
- Figure 1.1: Total Network Security IoT Cybersecurity Forecast Methodology
- Source: Juniper Research Figure 1.2: Total Endpoint Security IoT Cybersecurity Forecast Methodology
- Source: Juniper Research Figure 1.3: Total Platform Security IoT Cybersecurity Forecast Methodology
- Source: Juniper Research Figure 1.4: Total Application Security IoT Cybersecurity Forecast Methodology
- Source: Juniper Research Figure 1.5: Total Other Security Solutions IoT Cybersecurity Forecast Methodology
- Figure 1.1: Total Network Security IoT Cybersecurity Forecast Methodology
2. Global IoT Cybersecurity Market
- 2.1. Total Businesses Adopting IoT Cybersecurity Solutions
- Figure and Table 2.1: Total Number of Businesses Adopting IoT Cybersecurity Solutions (m), Split by 8Key Regions, 2024-2029
- 2.2. Total IoT Cybersecurity Revenue
- Figure and Table 2.2: Total IoT Cybersecurity Revenue (m), Split by 8Key Regions, 2024-2029
- Table 2.3: Total IoT Cybersecurity Revenue ($m), Split by Solution, 2024-2029
3. Network Security
- 3.1. Total Network Security Revenue
- Figure and Table 3.1: Total IoT Cybersecurity Revenue from Network Security (m), Split by 8Key Regions, 2024-2029
- 3.2. Total Network Security Hardware Cost
- Figure & Table 3.2: Total Network Security Hardware Cost per Annum (m), Split by 8Key Regions, 2024-2029
4. Endpoint Security
- 4.1. Total Number of IoT Devices Protected by Endpoint Security
- Figure and Table 4.1: Total Number of IoT Devices Protected by Endpoint Security Revenue (m), Split by 8Key Regions, 2024-2029
- 4.2. Total Endpoint Security Revenue
- Figure and Table 4.2: Total IoT Cybersecurity Revenue from Endpoint Security (m), Split by 8Key Regions, 2024-2029
- Table 4.3: Total Number of IoT Devices (m), Split by 8Key Regions, 2024-2029
5. Platform Security
- 5.1. Total Platform Security Revenue
- Figure and Table 5.1: Total IoT Cybersecurity Revenue from Platform Security (m), Split by 8Key Regions, 2024-2029
- 5.2. Total Number of Businesses Adopting Platform Security
- Figure 5.2: Total Number of Businesses Adopting Platform Security (m), Split by Key Regions, 2024-2029
6. Application Security
- 6.1. Application Security
- Figure and Table 6.1: Total IoT Cybersecurity Revenue from Application Security (m), Split by 8Key Regions, 2024-2029
- 6.2. Total Number of Businesses Adopting Application Security
- Figure and Table 6.2: Total Number of Businesses Adopting Application Security (m), Split by 8Key Regions, 2024-2029
7. Other Security Solutions
- 7.1. Other Security Solutions Revenue
- Figure and Table 7.1: Total IoT Cybersecurity Revenue from Other Security Solutions (m), Split by 8Key Regions, 2024-2029
- 7.2. Total Other Security Solutions Hardware Cost
- Figure and Table 7.2: Total Hardware Cost for Other Security Solutions per Annum (m), Split by 8Key Regions, 2024-2029
