|
|
市場調査レポート
商品コード
1552965
量子技術の世界市場:2024-2030年Global Quantum Technology Market: 2024-2030 |
||||||
|
|||||||
| 量子技術の世界市場:2024-2030年 |
|
出版日: 2024年09月16日
発行: Juniper Research Ltd
ページ情報: 英文
納期: 即日から翌営業日
|
全表示
- 概要
- 目次
| 主要統計 | |
|---|---|
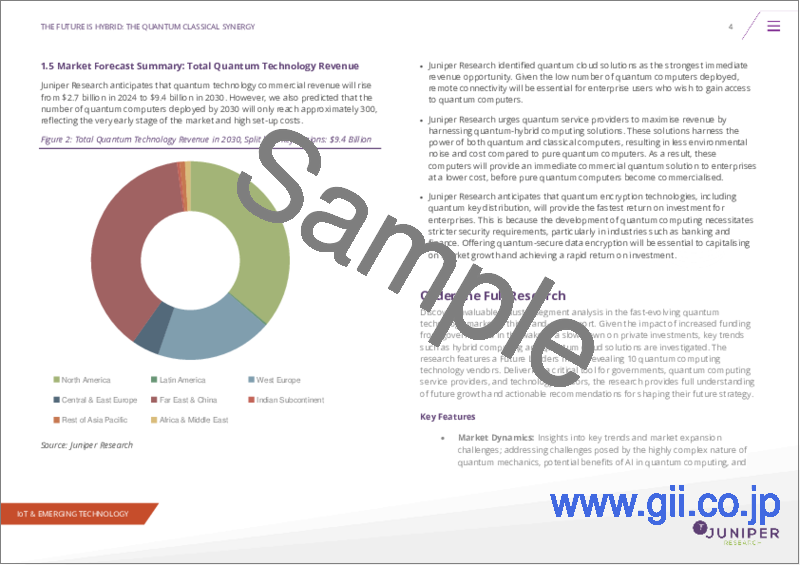
| 量子技術の総収益:2024年 | 27億米ドル |
| 量子技術の総収益:2030年 | 94億米ドル |
| 市場成長率:2024~2030年 | 243% |
| 予測期間 | 2024-2030年 |
量子コンピューティング:2030年には世界で100億米ドルに近い商業収益に
当調査パッケージは、この新興市場の詳細で洞察に満ちた分析を提供し、政府、量子コンピューティングサービスプロバイダー、技術ベンダーが市場の今後の成長を理解することを可能にします。民間投資の減速に伴う政府からの資金提供の増加の影響を考慮し、ハイブリッドコンピューティングや量子クラウドソリューションなどの主要動向や量子市場の競合情勢について論じています。
本スイートでは、主要な投資地域である北米、西欧、極東・中国を含む、主要8地域60カ国の市場規模と主要予測データを提供します。また、量子コンピューティング、量子センシング、量子通信など、量子市場の技術分野別のデータも提供しています。さらに、量子エコシステムの主要動向、産業機会、課題、ステークホルダーへの重要な提言も提供しています。これらの内容は、急速に進化する市場を理解するための重要なツールとなり、量子技術ベンダーは将来の戦略を立てることができます。
主な特徴
- 市場力学:量子力学の複雑な性質がもたらす課題、量子コンピューティングにおけるAIの潜在的な利点、主要産業 (ヘルスケア、物流、金融、製造、安全保障・防衛) における量子ユースケースの分析など、量子市場における主要動向と市場拡大の課題を洞察します。市場調査には、ハイブリッド量子コンピューティングソリューションの量子クラウドソリューションへの実装など、ベンダーにとっての主要な収益化機会の分析も含まれています。また、市場が成熟期に達するまで、ベンダーが市場で利益を上げるために取るべき主要なステップについても提言しています。
- 主な要点と戦略的提言:量子市場における主な発展機会と知見を詳細に分析し、政府や業界リーダーなどのステークホルダーに向けた主な戦略的提言も掲載しています。
- ベンチマーク業界予測:量子プロバイダーの事業概要には、2030年までの予測期間が含まれており、今後6年間の量子収益、量子投資、量子ハードウェアの展開が網羅されています。具体的には、世界市場の概要だけでなく、量子コンピューティング、量子センシング、量子通信などの量子技術別にデータを掲載しています。
- Juniper ResearchのFuture Leader Index:量子コンピューティング技術ベンダー10社の企業プロファイルと能力を評価し、各社の対象部門、イノベーション、将来展の望を掲載しています。
市場データ・予測
当調査スイートには、55のテーブルと29,000を超えるデータポイントの予測期間データ一式へのアクセスが含まれています。この調査スイートには以下の指標が含まれます:
- 量子技術を採用する企業数
- 量子技術ハードウェアの導入数
- 量子ソフトウェアの導入収益
- 量子技術事業への投資額
サンプルビュー
市場動向・予測 (PDFレポート):

目次
第1章 重要ポイントと戦略的推奨事項
- 量子市場:重要ポイント
- 量子市場:戦略的推奨事項
第2章 現在の市場情勢・促進要因・課題
- 量子とは何か?
- 現在の市場情勢
- 量子コンピューティング
- 量子センシング
- 量子通信
- 産業セグメント分析
- 製造
- ファイナンス
- 安全保障・防衛
- ヘルスケア
- ロジスティクス
- 量子の冬
- 量子の規制状況
- 課題
- 量子デコヒーレンス
- 初期コストの高さ
- スケーラビリティ
- 人材のスキル不足
第3章 将来の市場動向と主要技術分析
- イントロダクション
- AIと機械学習
- ハイブリッドコンピューティング
- クラウドソリューション
- 耐量子暗号
- 量子の実践
- 量子センサー
- 量子コンピューティング
- 量子通信
- 主要な収益化と投資機会
- 主要な産業機会
- 地域の機会
第4章 Future Leaders Index
- Amazon Web Services
- D-Wave Systems
- IBM
- Intel
- IonQ
- Microsoft Corporation
- Quantinuum
- Rigetti
- Xanadu
- Juniper Researchリーダーボード評価手法
- 制限と解釈
第5章 市場予測と重要ポイント
- 量子市場の概要と将来の見通し
- 量子ハードウェア導入数
- 量子技術の総収益
- 量子技術への総投資額
- 量子コンピューティングへの総投資額
- 量子通信への総投資額
- 量子センサーへの総投資額
- その他の量子技術への総投資額
| KEY STATISTICS | |
|---|---|
| Total quantum technology revenue in 2024: | $2.7bn |
| Total quantum technology revenue in 2030: | $9.4bn |
| 2024 to 2030 market growth: | 243% |
| Forecast period: | 2024-2030 |
'Quantum Computing: Commercial Revenue to Near $10bn Globally by 2030'
Overview
Our "Quantum Market" research suite provides a detailed and insightful analysis of this emerging market, enabling governments, quantum computing service providers, and technology vendors to understand future growth in the market. Given the impact of increased funding from governments in the wake of a slow-down on private investments, key trends such as hybrid computing and quantum cloud solutions are discussed, as well as the competitive nature of the quantum market.
The suite includes a data deliverable, sizing the market and providing key forecast data across 60 countries in 8 key regions, including regions of major investment, namely North America, West Europe and Far East & China. Data is also spilt by several different technology segments in the quantum market, including quantum computing, quantum sensing and quantum communications. In addition, the suite provides a Strategy and Trends document, which gives a complete assessment of the key trends, industry opportunities, challenges and key recommendations for stakeholders in the quantum ecosystem. Collectively, these provide a critical tool for understanding this rapidly evolving market, allowing quantum technology vendors to shape their future strategy.
Key Features
- Market Dynamics: Insights into key trends and market expansion challenges within the quantum market; addressing the challenges posed by the highly complex nature of quantum mechanics, the potential benefits of AI in quantum computing, and analysing quantum use cases in key industries (healthcare, logistics, finance, manufacturing, and security and defence). The quantum market research also includes an analysis of key monetisation opportunities for vendors, such as the implementation hybrid quantum computing solutions into quantum cloud solutions. It also recommends key steps that vendors must take to be profitable in the market until it reaches maturity.
- Key Takeaways & Strategic Recommendations: In-depth analysis of key development opportunities and key findings within the quantum market, accompanied by key strategic recommendations for stakeholders, such as governments and industry leaders.
- Benchmark Industry Forecasts: The business overview into quantum providers includes a forecast period until 2030, covering total quantum revenue, quantum investment and quantum hardware deployments over the next six years. Specifically, this data set not only provides a global market overview, but data is also split by quantum technology, including quantum computing, quantum sensing and quantum communications.
- Juniper Research Future Leader Index: Key player capability and capacity assessment for 10 quantum computing technology vendors, including company profiles, via the Juniper Research Future Leader Index, featuring segment coverage, innovation and future prospects for each major player:
- AWS
- D-Wave Systems
- IBM
- Intel
- IonQ
- Microsoft
- Quantinuum
- Rigetti Computing
- Xanadu
Market Data & Forecasts
This market-leading research suite for the quantum market includes access to the full set of forecast period data of 55 tables and over 29,000 datapoints. Metrics in the research suite include:
- Total Number of Businesses Adopting Quantum Technology
- Total Number of Quantum Technology Hardware Deployments
- Total Quantum Software Deployments Revenue
- Total Quantum Technology Business Investments
These metrics are provided for the following key market verticals:
- Quantum Computing
- Quantum Sensing
- Quantum Communications
- Other Quantum Technology
Juniper Research Interactive Forecast Excel contains the following functionality:
- Statistics Analysis: Users benefit from the ability to search for specific metrics, displayed for all regions and countries across the data period. Graphs are easily modified and can be exported to the clipboard.
- Country Data Tool: This tool lets users look at metrics for all regions and countries in the forecast period. Users can refine the metrics displayed via a search bar.
- Country Comparison Tool: Users can select countries and compare each of them. The ability to export graphs is included in this tool.
- What-if Analysis: Here, users can compare forecast metrics against their own assumptions via 5 interactive scenarios.
SAMPLE VIEW
Market Trends & Forecasts PDF Report:

A comprehensive analysis of the current market landscape, alongside strategic recommendations and a walk-through of the forecasts.
Table of Contents
1. Key Takeaways and Strategic Recommendations
- 1.1. The Quantum Market: Key Takeaways
- 1.2. The Quantum Market: Strategic Recommendations
2. Current Market Landscape, Drivers & Challenges
- 2.1. Introduction
- 2.2. What is Quantum?
- Figure 2.1: Summary of the Main Differences Between Quantum Computing and Classical Computing
- 2.3. Current Market Landscape
- 2.3.1. Quantum Computing
- Figure 2.2: Total Quantum Computers Deployed, Split by 8 Key Regions, 2024-2030
- Figure 2.3: Total Number of Businesses Adopting Quantum Computing Software, Split by 8 Key Regions, 2024-2030
- Figure 2.4: Total Cumulative Investment in Quantum Computers ($m), split by Key Regions, 2024-2030
- 2.3.2. Quantum Sensing
- Figure 2.5: Total Number of Quantum Sensors Deployed, Split by 8 Key Regions, 2024-2030
- 2.3.3. Quantum Communications
- Figure 2.6: Total Cumulative Investment in Quantum Communications ($m), split by 8 Key Regions, 2024-2030
- 2.3.1. Quantum Computing
- 2.4. Industry Segment Analysis
- 2.4.1. Manufacturing
- 2.4.2. Finance
- 2.4.3. Security and Defence
- 2.4.4. Healthcare
- 2.4.5. Logistics
- 2.5. Quantum Winter
- 2.6. Quantum Regulatory Landscape
- Table 2.7: Summary of the Current Institutions/Regulatory Bodies Releasing Standards and Regulations on Quantum Technologies
- 2.7. Challenges
- 2.7.1. Quantum Decoherence
- 2.7.2. High Initial Cost
- 2.7.3. Scalability
- 2.7.4. Unskilled Workforce
3. Future Market Trends & Key Technology Analysis
- 3.1. Introduction
- 3.1.1. AI and Machine Learning
- 3.1.2. Hybrid Computing
- Figure 3.1: Workflow of a Hybrid Quantum System
- 3.1.3. Cloud Solutions
- 3.1.4. Post-quantum Cryptography
- 3.2. Quantum in Action
- 3.2.1. Quantum Sensors
- Figure 3.2: Total Number of Businesses Deploying Quantum Sensors, Split by 8 Key Regions, 2024-2030
- 3.2.2. Quantum Computing
- 3.2.3. Quantum Communications
- Figure 3.3: Total Number of Businesses Deploying Quantum Communication Devices, Split by 8 Key Regions, 2024-2030
- 3.2.1. Quantum Sensors
- 3.3. Key Monetisation and Investment Opportunities
- 3.3.1. Key Industry Opportunities
- 3.3.2. Regional Opportunities
- Figure 3.4: Cumulative Investment in Quantum Technologies by 2029 ($m), Split by 10 Leading Countries
- Figure 3.5: Total Cumulative Investment and Revenue in Quantum Technologies ($), 2021-2030
- Figure 3.6: Quantum Commercialisation Roadmap and Key Monetisation Opportunities
4. Future Leaders Index
- 4.1. Why Read This Report
- Table 4.1: Juniper Research Future Leader Index: Quantum Vendor Solutions
- Figure 4.2: Juniper Research Future Leader Index: Quantum Market Vendors
- Source: Juniper Research Table 4.3: Juniper Research Quantum Vendors Ranking
- Table 4.4: Juniper Research Future Leader Index Heatmap: Quantum Market Vendors
- 4.2. Amazon Web Services
- i. Corporate
- Table 4.5: AWS Financial Summary ($m), 2022-2023
- ii. Geographical Spread
- iii. Key Clients and Strategic Partnerships
- iv. High-level View of Offerings
- v. Juniper Research's View: Key Strengths & Strategic Opportunities
- i. Corporate
- 4.3. D-Wave Systems
- i. Corporate
- Table 4.4: D-Wave Financial Summary ($m), 2022-2023
- ii. Geographical Spread
- iii. Key Clients and Strategic Partnerships
- iv. High-level View of Offerings
- v. Juniper Research's View: Key Strengths & Strategic Opportunities
- i. Corporate
- 4.4. Google
- i. Corporate
- Table 4.4: Google Financial Summary ($m), 2022-2023
- ii. Geographical Spread
- iii. Key Clients and Strategic Partnerships
- iv. High-level View of Offerings
- v. Juniper Research's View: Key Strengths & Strategic Opportunities
- i. Corporate
- 4.5. IBM
- i. Corporate
- Table 4.5: IBM's Financial Summary ($m), 2022-2023
- ii. Geographical Spread
- iii. Key Clients and Strategic Partnerships
- iv. High-level View of Offerings
- v. Juniper Research's View: Key Strengths & Strategic Opportunities
- i. Corporate
- 4.6. Intel
- i. Corporate
- Table 4.6: Intel's Financial Summary ($m), 2022-2023
- ii. Geographical Spread
- iii. Key Clients and Strategic Partnerships
- iv. High-level View of Offerings
- v. Juniper Research's View: Key Strengths & Strategic Opportunities
- i. Corporate
- 4.7. IonQ
- i. Corporate
- Table 4.7: IonQ's Financial Summary ($m), 2022-2023
- ii. Geographical Spread
- iii. Key Clients and Strategic Partnerships
- iv. High-level View of Offerings
- v. Juniper Research's View: Key Strengths & Strategic Opportunities
- i. Corporate
- 4.8. Microsoft Corporation
- i. Corporate
- Table 4.7: Microsoft's Financial Summary ($m), 2022-2023
- ii. Geographical Spread
- iii. Key Clients and Strategic Partnerships
- iv. High-level View of Offerings
- v. Juniper Research's View: Key Strengths & Strategic Opportunities
- i. Corporate
- 4.9. Quantinuum
- i. Corporate
- ii. Geographical Spread
- iii. Key Clients and Strategic Partnerships
- iv. High-level View of Offerings
- v. Juniper Research's View: Key Strengths & Strategic Opportunities
- 4.10. Rigetti
- i. Corporate
- Table 4.8: Rigetti's Financial Summary ($m), 2022-2023
- ii. Geographical Spread
- iii. Key Clients and Strategic Partnerships
- iv. High-level View of Offerings
- v. Juniper Research's View: Key Strengths & Strategic Opportunities
- i. Corporate
- 4.11. Xanadu
- i. Corporate
- ii. Geographical Spread
- iii. Key Clients and Strategic Partnerships
- iv. High-level View of Offerings
- v. Juniper Research's View: Key Strengths & Strategic Opportunities
- 4.1. Juniper Research Leaderboard Assessment Methodology
- 4.2. Limitations & Interpretations
- Table 4.6: Juniper Research Future Leader Index Criteria Table: The Quantum Market
5. Market Forecast & Key Takeaways
- 5.1. Quantum Market Summary & Future Outlook
- 5.1.1. Methodology
- Figure 5.1: The Quantum Market Methodology
- 5.1.1. Methodology
- 5.2. Total Number of Quantum Hardware Deployments
- Figure and Table 5.2: Number of Quantum Hardware Deployments, Split by 8 Key Regions, 2024-2030
- Table 5.3: Number of Quantum Hardware Deployments, Split by Technology, 2024-2030
- 5.3. Total Quantum Technology Revenue
- Figure and Table 5.4: Total Quantum Technology Revenue ($m), Split by 8 Key Regions, 2024-2030
- Table 5.5: Total Quantum Technology Revenue ($m), Split by Technology, 2024-2030
- 5.4. Total Investment in Quantum Technology
- Figure and Table 5.6: Total Investment in Quantum Technology ($m), Split by 8 Key Regions, 2024-2030
- Table 5.7: Total Cumulative Investment in Quantum Technology ($m), Split by 8 Key Regions, 2024-2030
- 5.5. Total Investment in Quantum Computing
- Figure and Table 5.8: Total Investment in Quantum Computing ($m), Split by 8 Key Regions, 2024-2030
- Table 5.9: Total Cumulative Investment in Quantum Computing ($m), Split by 8 Key Regions, 2024-2030
- 5.5.1. Total Investment in Quantum Communications
- Figure and Table 5.10: Total Investment in Quantum Communications ($m), by 8 Key Regions, 2024-2030
- Figure 5.11: Total Cumulative Investment in Quantum Communications ($m), Split by 8 Key Regions, 2024-2030
- 5.6. Total Investment in Quantum Sensors
- Figure and Table 5.12: Total Investment in Quantum Sensors ($m), Split by 8 Key Regions, 2024-2030
- Table 5.13: Total Cumulative Investment in Quantum Sensors ($m), Split by 8 Key Regions, 2024-2030
- 5.7. Total Investment in Other Quantum Technology
- Figure and Table 5.14: Total Investment in Other Quantum Technology ($m), Split by 8 Key Regions, 2024-2030
- Figure 5.15: Total Cumulative Investment in Other Quantum Technology ($m), Split by 8 Key Regions, 2024-2030


