|
|
市場調査レポート
商品コード
1537092
再生可能エネルギー技術の世界市場:2024-2029年Global Renewable Energy Technology Market: 2024-2029 |
||||||
|
|||||||
| 再生可能エネルギー技術の世界市場:2024-2029年 |
|
出版日: 2024年08月19日
発行: Juniper Research Ltd
ページ情報: 英文
納期: 即日から翌営業日
|
全表示
- 概要
- 目次
| 主要統計 | |
|---|---|
| 2024年の再生可能エネルギー発電総量: | 9,603.3 TWh |
| 2029年の再生可能エネルギー発電総量: | 11,980.6 TWh |
| 2029年の電力容量に占める再生可能エネルギーの割合: | 7% |
| 予測期間: | 2024-2029年 |
当レポートは、再生可能エネルギー技術市場の詳細な分析を提供し、再生可能エネルギー技術メーカーや再生可能エネルギーサプライヤーの主要動向、潜在的な急成長要因や機会、競合環境を理解することを可能にします。
再生可能エネルギー技術の展開と再生可能エネルギー技術市場の将来的な成長率をマッピングしたデータへのアクセス、市場内の最新の機会と動向を明らかにする詳細な調査、再生可能エネルギーベンダーおよびプロバイダーに関する広範な分析、市場シェアの詳細などを提供します。
また、再生可能エネルギー技術メーカーやプロバイダーが将来の戦略を策定することを可能する、再生可能エネルギー市場を理解するための効果的なツールを提供します。
主な特徴
- 市場力学:洋上風力発電プロジェクトなど、再生可能エネルギー市場における主要な動向と市場拡大の課題についての洞察を提供します。再生可能エネルギー技術の進化がもたらす課題、技術の進歩、再生可能エネルギー技術の導入における商業的・消費者的障壁の分析に加え、複数の再生可能エネルギー技術の使用事例の分析も行っています。また、再生可能エネルギー技術の市場シェア分析では、60カ国市場の現況と成長見通しを分析し、将来の展望を提供する「国別準備指数」も含まれています。
- 主な要点と戦略的提言:再生可能エネルギー技術市場における主な発展の機会と発見を詳細に分析し、再生可能エネルギー技術ベンダーへの主要な戦略的提言を添えています。
- ベンチマーク産業予測:この予測には、再生可能エネルギーのハードウェア支出、運用コスト、再生可能エネルギーの設備容量と発電量を示す予測が含まれており、風力エネルギー、太陽エネルギー、水力、バイオエネルギーなど、さまざまな再生可能エネルギー源別に分かれています。また、石炭・ガス・石油発電所を含む化石燃料と年間排出量の予測も含まれています。
- Juniper Researchの競合リーダーボード:再生可能エネルギー企業15社の能力を評価します。
サンプルビュー
市場データ&予測レポート
市場動向・戦略レポート
Juniper Research Interactive Forecast Excelには以下の機能があります:
- 統計分析:データ期間中のすべての地域と国について表示される特定の指標を検索できるのがメリットです。グラフは簡単に修正でき、クリップボードへのエクスポートも可能です。
- 国別データツール:このツールでは、予測期間中のすべての地域と国の指標を見ることができます。ユーザーは検索バーで表示される指標を絞り込むことができます。
- 国別比較ツール:この国別レポートでは、特定の国を選択して比較することができます。このツールにはグラフをエクスポートする機能が含まれています。
- What-if分析:5つのインタラクティブなシナリオを通じて、ユーザーは予測の前提条件と比較することができます。
目次
市場動向・戦略
第1章 重要ポイント・戦略的推奨事項
- 重要ポイント
- 戦略的推奨事項
第2章 市場情勢
- 定義
- 再生可能エネルギー市場
- 再生可能エネルギーのタイプ
- 風力エネルギー
- 太陽エネルギー
- 水力発電
- バイオエネルギー
- 水素
- 地熱エネルギー
- 原子力エネルギー
- 再生可能エネルギーと電力網
- 再生可能エネルギーのタイプ
- 再生可能エネルギーで使用される方法と技術
- 風力技術と方法
- 陸上風力タービン
- 洋上風力タービン
- 太陽光発電技術と方法
- 太陽光発電パネル
- 太陽熱パネル
- 水力発電技術と方法
- 水力発電所
- 水力発電タービン
- バイオエネルギー技術と方法
- バイオマス燃焼
- 細菌別分解
- ガス燃料への転換
- 液体燃料への変換
- 水素技術と方法
- 水蒸気メタン改質
- 電気分解
- i部分酸化
- バイオマスガス化
- 熱化学的水分解
- 光分解別水分解
- 地熱技術と方法
- 原子力技術と方法
- 風力技術と方法
- 潜在的エネルギー貯蔵
- 揚水発電エネルギー貯蔵
- 熱および相転移エネルギー貯蔵
- 機械的エネルギー貯蔵
- 水素貯蔵
- 電気化学/電気貯蔵
- リチウムイオン電池ストレージ
- フロー電池ストレージ
- 主な動向、市場促進要因、制約
- 政府の政策とインセンティブ
- 国際貿易
- 太陽光発電の供給過剰
- 脅威にさらされるオフショアプロジェクト
- 今後の展望
第3章 セグメント分析
- ケーススタディ
- イノベーション
第4章 国別準備指数
- 国別準備指数のイントロダクション
- 重点市場
- 成長市場
競合リーダーボード
第1章 Juniper Researchによる再生可能エネルギー技術の競合リーダーボード
第2章 再生可能エネルギー技術ベンダーのプロファイル
- 再生可能エネルギー技術ベンダー
- Brookfield Renewable
- Canadian Solar Incorporated
- China Three Gorges Corporation
- Eletrobras
- Envision
- First Solar
- General Electric Vernova
- Goldwind
- Iberdrola
- JinkoSolar Holding Company
- NextEra Energy
- Orsted
- Siemens Gamesa
- Sonnedix
- Vestas Wind Systems A/S
データ・予測
第1章 再生可能エネルギー技術と非再生可能エネルギー技術の予測:調査手法
第2章 風力エネルギー予測
- 陸上風力エネルギー
- 設備発電容量
- 陸上風力タービンへの年間総支出額
- 総運用コスト
- 陸上風力エネルギーの総卸売コスト
- 洋上風力エネルギー
- 設備発電容量
- 洋上風力タービンへの総支出額
- 総運用コスト
- 洋上風力エネルギーの総卸売コスト
- 風力エネルギー
- 風力発電による発電量の割合
- 風力発電による総CO2排出量削減量
第3章 太陽エネルギー予測
- 太陽エネルギー
- 設備発電容量
- 太陽光モジュールへの総支出額
- 太陽電池モジュールの総運用コスト
- 太陽エネルギーの総卸売コスト
- 太陽光発電による発電量の割合
- 太陽光発電による総CO2排出量削減量
第4章 水力発電エネルギー予測
- 水力発電
- 設備発電容量
- 水力発電所の設置にかかる総支出額
- 総運用コスト
- 水力発電の総卸売コスト
- 水力発電による発電量の割合
- 水力発電による総CO2排出量削減量
第5章 バイオエネルギー予測
- バイオエネルギー
- 設備発電容量
- バイオエネルギープラントの設置にかかる総支出額
- 総運用コスト
- 総卸売コスト
- バイオエネルギーによる発電容量の割合
- バイオエネルギーによる総CO2排出量削減量
第6章 石炭エネルギー予測
- 石炭エネルギー
- 設備発電容量
- 総運用コスト
- 総卸売コスト
- 石炭火力発電の発電容量の割合
- 石炭火力発電による総CO2排出量
第7章 ガスエネルギー予測
- ガスエネルギー
- 設備発電容量
- 総運用コスト
- 総卸売コスト
- ガス発電による発電容量の割合
- ガスエネルギー発電から排出されるCO2総量
第8章 石油エネルギー予測
- 石油エネルギー
- 設備発電容量
- 年間の総運用コスト
- 総卸売コスト
- 石油発電による発電容量の割合
- 石油エネルギー発電から排出されるCO2総量
第9章 原子力エネルギーの予測
- 原子力エネルギー
- 設備発電容量
- 総運用コスト
- 原子力エネルギーの総卸売コスト
- 原子力発電による発電容量の割合
'Renewable Energy Technology to Save Over 2.4 Gigatonnes of CO2 Globally by 2029.'
| KEY STATISTICS | |
|---|---|
| Total renewable energy generated in 2024: | 9,603.3 TWh |
| Total renewable energy generated in 2029: | 11,980.6 TWh |
| Proportion of electricity capacity attributable to renewable energy in 2029: | 7% |
| Forecast period: | 2024-2029 |
Overview
Our "Renewable Energy Technology" research suite provides detailed analysis of the renewable energy technology market; allowing renewable energy technology manufacturers and renewable energy suppliers to gain an understanding of key trends, potential rapid growth factors and opportunities, and the competitive environment.
Providing multiple options that can be purchased separately, major factors of the research suite include access to data mapping the deployment of renewable energy technologies and the future growth rate of the renewable energy technologies market, a detailed study revealing the latest opportunities and trends within the market, and an insightful document containing an extensive analysis of 15 renewable energy vendors and providers within the space; detailing largest market share. The coverage can also be purchased as a Full Research Suite, containing all of these elements, at a substantial discount.
Collectively, these elements provide an effective tool for understanding this constantly evolving sources of energy market, enabling renewable energy technology manufacturers and providers to set out their future strategies. The renewable energy market report's unparalleled coverage makes this research suite an incredibly useful resource for gauging the future of the demand of electricity in this complex renewable energy sector.
Key Features
- Market Dynamics: Insights into key trends and market expansion challenges within the renewable energy market such as offshore wind projects; addressing the challenges posed by the evolving nature of renewable energy technologies, technological advancements, commercial and consumer barriers to renewable energy technology adoption, in addition to analysis of multiple renewable energy technology use cases. The renewable energy technology market share research also includes a Country Readiness Index; analysing the current development and growth of the renewable energy technology market in 60 countries, as well as providing a future outlook.
- Key Takeaways & Strategic Recommendations: In-depth analysis of key development opportunities and key findings within the renewable energy technology market, accompanied by key strategic recommendations for renewable energy technology vendors.
- Benchmark Industry Forecasts: This clean electricity overview into renewable energy technology includes forecasts presenting renewable energy hardware spend, operational costs, and installed renewable energy capacity and generation; split by different renewable energy sources including wind energy, solar energy, hydro, and bioenergy. The forecast also includes accompanying forecasts for fossil fuels and annual emissions, including coal, gas, and oil power plants.
- Juniper Research Competitor Leaderboard: Key player capability and capacity assessment for 15 renewable energy companies, via the Juniper Research Competitor Leaderboard, featuring renewable energy market size for major players in the renewable energy technology industry.
SAMPLE VIEW
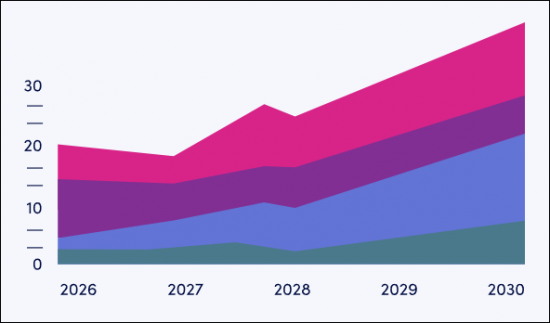
Market Data & Forecasting Report

The numbers tell you what's happening, but our written report details why, alongside the methodologies.
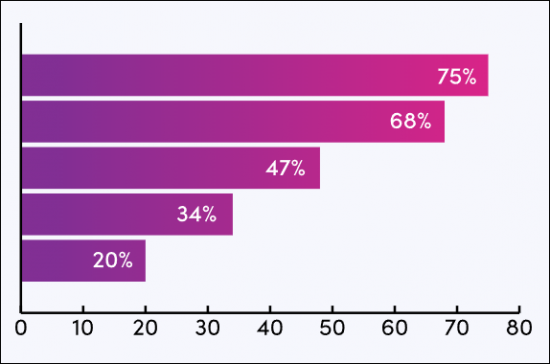
Market Trends & Strategies Report

A comprehensive analysis of the current market landscape, alongside strategic recommendations.
The market-leading research suite for the "Renewable Energy Technology" market includes access to the full set of forecast data, consisting of 127 tables and over 57,900 datapoints. Metrics in the research suite include:
- Total Installed Energy Capacity
- Total Operational Costs of Energy Technology
- Total Wholesale Cost of Energy
- Proportion Attributable to Total Electricity Generation
- Amount of Carbon Emissions Avoided/Produced
These metrics are provided for the following key market verticals:
- Renewable Energy Sources & Technology
- Wind Turbines Power
- Onshore Wind Power
- Offshore Wind Power
- Solar Power
- Hydroelectric Power
- Bioenergy Power
- Non-renewable Energy Sources & Technology
- Coal Power
- Gas Power
- Oil Power
- Nuclear Power
The Juniper Research Interactive Forecast Excel contains the following functionality:
- Statistics Analysis: Users benefit from the ability to search for specific metrics, displayed for all regions and countries across the data period. Graphs are easily modified and can be exported to the clipboard.
- Country Data Tool: This tool lets the user look at metrics for all regions and countries in the forecast period. Users can refine the metrics displayed via the search bar.
- Country Comparison Tool: Users can select and compare specific countries in this country-level report. The ability to export graphs is included in this tool.
- What-if Analysis: Here, users can compare forecast metrics against their own assumptions, via five interactive scenarios.
Market Trends & Strategies Report
This energy efficiency report examines the "Renewable Energy Technology" market landscape in detail; assessing market trends and factors shaping the evolution of this growing market, such as offshore wind technology and pyramidal solar lenses. The report delivers comprehensive analysis of the strategic opportunities for renewable energy technology providers and market participants; addressing key verticals and developing challenges, and how vendors should navigate these. As well as looking into renewable technology use cases, it also includes evaluation of key country-level opportunities for renewable energy growth.
Competitor Leaderboard Report
The renewable sources Competitor Leaderboard report provides a detailed evaluation and market positioning for 15 leading vendors in the renewable energy space. These renewable electricity vendors are positioned as an established leader, leading challenger, or disruptor and challenger, based on capacity and capability assessments.
The 15 renewable energy technology vendors consist of:
|
|
This document is centred around the Juniper Research Competitor Leaderboard, a vendor positioning tool that provides an at a glance view of the competitive landscape in a market, backed by a robust methodology.
Table of Contents
Market Trends & Strategies
1. Key Takeaways & Strategic Recommendations
- 1.1. Key Takeaways
- 1.2. Strategic Recommendations
2. Market Landscape
- 2.1. Introduction
- 2.2. Definitions
- 2.3. Renewable Energy Market
- Figure 2.1: Renewable Energy Market Landscape
- 2.3.1. Types of Renewable Energy
- i. Wind Energy
- Figure 2.2: Onshore & Offshore Wind Turbines
- ii. Solar Energy
- Figure 2.3: Solar PV Farm
- iii. Hydroelectric Energy
- Figure 2.4: Hydroelectric Power Plant with a Reservoir
- iv. Bioenergy
- v. Hydrogen
- vi. Geothermal Energy
- Figure 2.5: Geothermal Energy Generated from the Earth's Core
- vii. Nuclear Energy
- i. Wind Energy
- 2.3.2. Renewable Energy and the Grid
- Figure 2.6: Renewable Energy Generation & Distribution to the Grid
- 2.4. Methods & Technologies Used in Renewable Energy
- 2.4.1. Wind Technologies & Methods
- i. Onshore Wind Turbine
- ii. Offshore Wind Turbine
- 2.4.2. Solar Technologies & Methods
- i. Solar PV Panel
- ii. Solar Thermal Panel
- Figure 2.7: Evacuated Tube Collector Solar Thermal Panel
- 2.4.3. Hydroelectric Technologies & Methods
- i. Hydroelectric Power Plants
- ii. Hydroelectric Turbines
- Figure 2.8: Francis Hydroelectric Turbine
- 2.4.4. Bioenergy Technologies & Methods
- i. Biomass Combustion
- ii. Bacterial Decomposition
- iii. Conversion to a Gas Fuel
- iv. Conversion to a Liquid Fuel
- 2.4.5. Hydrogen Technologies & Methods
- i. Steam-methane Reforming
- ii. Electrolysis
- iii. Partial Oxidation
- iv. Biomass Gasification
- v. Thermochemical Water Splitting
- vi. Photolytic Water Splitting
- 2.4.6. Geothermal Technologies & Methods
- 2.4.7. Nuclear Technologies & Methods
- 2.4.1. Wind Technologies & Methods
- 2.5. Potential Energy Storage
- 2.5.1. Pumped Hydroelectricity Energy Storage
- Figure 2.9: Closed-loop Pumped Hydroelectric Energy Storage Diagram
- 2.5.2. Thermal & Phase Transition Energy Storage
- i. Liquid-to-air Transition Energy Storage
- ii. Thermal Sand Batteries
- 2.5.3. Mechanical Energy Storage
- i. Compressed Air Energy Storage
- ii. Gravitational Energy Storage
- iii. Flywheel Energy Storage
- iv. Pumped Heat Electrical Storage
- 2.5.4. Hydrogen Storage
- 2.5.5. Electrochemical/Electricity Storage
- i. Lithium-ion Battery Storage
- ii. Flow Battery Storage
- 2.5.1. Pumped Hydroelectricity Energy Storage
- 2.6. Key Trends, Market Drivers, and Constraints
- 2.6.1. Government Policies & Incentives
- i. Solar PV Policies
- ii. Wind Energy Policies
- iii. Hydroelectric Energy Policies
- 2.6.2. International Trading
- 2.6.3. Solar PV Oversupply
- 2.6.4. Offshore Projects Under Threat
- 2.6.1. Government Policies & Incentives
- 2.7. Future Outlook
3. Segment Analysis
- 3.1. Case Studies
- 3.1.1. Solar AquaGrid Solar Canal Project
- 3.1.2. Whitelee Windfarm
- 3.1.3. Red Rock Hydroelectric Project
- 3.1.4. Attero & Peka Kroef
- 3.2. Innovations
- 3.2.1. Solar Innovations
- i. Floatovoltaics
- ii. Pyramidal Lenses
- Figure 3.1: Pyramidal Lens in Three Stages of Development
- iii. Solar Cells
- 3.2.2. Wind Innovations
- i. Bladeless Wind Turbines
- ii. Floating Wind Turbines
- iii. Flying Wind Power
- 3.2.3. Hydroelectric Innovations
- i. Helicoid Penstocks
- ii. VIVACE (Vortex Induced Vibration for Aquatic Clean Energy)
- 3.2.1. Solar Innovations
4. Country Readiness Index
- 4.1. Introduction to Country Readiness Index
- Figure 4.1: Renewable Energy Technology Country Readiness Index Regional Definitions
- Table 4.2: Juniper Research Country Readiness Index Scoring Criteria: Renewable Energy Technology
- Figure 4.3: Juniper Research Country Readiness Index: Renewable Energy Technology
- Figure 4.4: Renewable Energy Technology Country Readiness Index: Market Segments
- 4.1.1. Focus Markets
- i. Offshore Wind Investment
- ii. Easing International Trading
- iii. Renewable Energy Is Not Yet the Primary Energy Source
- 4.1.2. Growth Markets
- i. Large Potential for Increased Renewable Energy Generation
- ii. Markets with Great Investment Opportunities
- 4.1.3. Saturated Markets
- 4.1.4. Developing Markets
- Table 4.11: Juniper Research's Country Readiness Index Heatmap: North America
- Table 4.12: Juniper Research's Country Readiness Index Heatmap: Latin America
- Table 4.13: Juniper Research's Country Readiness Index Heatmap: West Europe
- Table 4.14: Juniper Research's Country Readiness Index Heatmap: Central & East Europe
- Table 4.15: Juniper Research's Country Readiness Index Heatmap: Far East & China
- Table 4.16: Juniper Research's Country Readiness Index Heatmap: Indian Subcontinent
- Table 4.17: Juniper Research's Country Readiness Index Heatmap: Rest of Asia Pacific
- Table 4.18: Juniper Research's Country Readiness Index Heatmap: Africa & Middle East
Competitor Leaderboard
1. Juniper Research Renewable Energy Technologies Competitor Leaderboard
- 1.1. Why Read this Report
- Table 1.1: Juniper Research Competitor Leaderboard: Renewable Energy Technology Vendors Included & Product Profiles
- Figure 1.2: Juniper Research Competitor Leaderboard: Renewable Energy Technology Vendors
- Table 1.3: Juniper Research Competitor Leaderboard Vendors & Positioning: Renewable Energy Technologies
- Table 1.4: Juniper Research Competitor Leaderboard Heatmap: Renewable Energy Technology Vendors
2. Renewable Energy Technology Vendor Profiles
- 2.1. Renewable Energy Technology Vendors
- 2.1.1. Brookfield Renewable
- i. Corporate
- Table 2.1: Brookfield Renewable Revenue for 2022 & 2023
- ii. Geographical Spread
- iii. Key Clients & Strategic Partnerships
- iv. High-level View of Offerings
- Figure 2.2: Brookfield Renewable's Holtwood Hydroelectric Facility
- v. Juniper Research Strategic Recommendations & Key Opportunities
- i. Corporate
- 2.1.2. Canadian Solar Incorporated
- i. Corporate
- Table 2.3: Canadian Solar Revenue for 2022 & 2023
- ii. Geographical Spread
- iii. Key Clients & Strategic Partnerships
- iv. High-level View of Offerings
- v. Juniper Research Strategic Recommendations & Key Opportunities
- i. Corporate
- 2.1.3. China Three Gorges Corporation
- i. Corporate
- Table 2.4: CTG Revenue for 2022 & 2023
- ii. Geographical Spread
- iii. Key Clients & Strategic Partnerships
- iv. High-level View of Offerings
- v. Juniper Research Strategic Recommendations & Key Opportunities
- i. Corporate
- 2.1.4. Eletrobras
- i. Corporate
- Table 2.5: Eletrobras Revenue for 2022-2023
- ii. Geographical Spread
- iii. Key Clients & Strategic Partnerships
- iv. High-level View of Offerings
- v. Juniper Research Strategic Recommendations & Key Opportunities
- i. Corporate
- 2.1.5. Envision
- i. Corporate
- ii. Geographical Spread
- iii. Key Clients & Strategic Partnerships
- iv. High-level View of Offerings
- v. Juniper Research Strategic Recommendations & Key Opportunities
- 2.1.6. First Solar
- i. Corporate
- Table 2.6: First Solar Revenue for 2022 & 2023 ($m)
- ii. Geographical Spread
- iii. Key Clients & Strategic Partnerships
- iv. High-level View of Offerings
- v. Juniper Research Strategic Recommendations & Key Opportunities
- i. Corporate
- 2.1.7. General Electric Vernova
- i. Corporate
- Table 2.7: GE Vernova Revenue for 2022 & 2023 ($m)
- ii. Geographical Spread
- iii. Key Clients & Strategic Partnerships
- iv. High-level View of Offerings
- v. Juniper Research Strategic Recommendations & Key Opportunities
- i. Corporate
- 2.1.8. Goldwind
- i. Corporate
- Table 2.8: Goldwind Revenue for 2022 & 2023 ($m)
- ii. Geographical Spread
- iii. Key Clients & Strategic Partnerships
- iv. High-level View of Offerings
- v. Juniper Research Strategic Recommendations & Key Opportunities
- i. Corporate
- 2.1.9. Iberdrola
- i. Corporate
- Table 2.9: Iberdrola Revenue for 2022 & 2023 ($m)
- ii. Geographical Spread
- iii. Key Clients & Strategic Partnerships
- iv. High-level View of Offerings
- v. Juniper Research Strategic Recommendations & Key Opportunities
- i. Corporate
- 2.1.10. JinkoSolar Holding Company
- i. Corporate
- Table 2.10: JinkoSolar Revenue for 2022 & 2023 ($m)
- ii. Geographical Spread
- iii. Key Clients & Strategic Partnerships
- iv. High-level View of Offerings
- v. Juniper Research Strategic Recommendations & Key Opportunities
- i. Corporate
- 2.1.11. NextEra Energy
- i. Corporate
- Table 2.11: NextEra Energy Revenue for 2022 & 2023 ($m)
- ii. Geographical Spread
- iii. Key Clients & Strategic Partnerships
- iv. High-level View of Offerings
- v. Juniper Research Strategic Recommendations & Key Opportunities
- i. Corporate
- 2.1.12 Orsted
- i. Corporate
- Table 2.12: Orsted Revenue for 2022 & 2023 ($m)
- ii. Geographical Spread
- iii. Key Clients & Strategic Partnerships
- iv. High-level View of Offerings
- v. Juniper Research Strategic Recommendations & Key Opportunities
- i. Corporate
- 2.1.13. Siemens Gamesa
- i. Corporate
- Table 2.13: Siemens Gamesa Revenue for 2022 & 2023 ($m)
- ii. Geographical Spread
- iii. Key Clients & Strategic Partnerships
- iv. High-level View of Offerings
- v. Juniper Research Strategic Recommendations & Key Opportunities
- i. Corporate
- 2.1.14. Sonnedix
- i. Corporate
- ii. Geographical Spread
- iii. Key Clients & Strategic Partnerships
- iv. High-level View of Offerings
- v. Juniper Research Strategic Recommendations & Key Opportunities
- 2.1.15. Vestas Wind Systems A/S
- i. Corporate
- Table 2.14: Vestas Wind Systems A/S Revenue for 2022 & 2023 ($m)
- ii. Geographical Spread
- iii. Key Clients & Strategic Partnerships
- iv. High-level View of Offerings
- v. Juniper Research Strategic Recommendations & Key Opportunities
- Table 2.15: Juniper Research Competitor Leaderboard Scoring Criteria: Renewable Energy Technology Vendors
- i. Corporate
- 2.1.1. Brookfield Renewable
Data & Forecasting
1. Renewable and Non-renewable Energy Technology Forecast Methodology
- 1.1. Methodology & Assumptions
- Figure 1.1: Onshore Wind Energy Forecast Methodology
- Figure 1.2: Offshore Wind Energy Forecast Methodology
- Figure 1.3: Solar Energy Forecast Methodology
- Figure 1.4: Hydroelectric Energy Forecast Methodology
- Figure 1.5: Bioenergy Energy Forecast Methodology
- Figure 1.6: Coal Energy Forecast Methodology
- Figure 1.7: Gas Energy Forecast Methodology
- Figure 1.8: Oil Energy Forecast Methodology
- Figure 1.9: Nuclear Energy Forecast Methodology
2. Wind Energy Forecasts
- 2.1. Onshore Wind Energy
- 2.1.1. Total Installed Onshore Wind Capacity
- Figure & Table 2.1: Total Global Installed Onshore Wind Capacity (GW), Split by 8 Key Regions, 2024-2029
- 2.1.2. Total Spend on Onshore Wind Turbines per annum
- Figure & Table 2.2: Total Spend on Onshore Wind Turbines ($m), Split by 8 Key Regions, 2024-2029
- 2.1.3. Total Onshore Wind Operating Costs
- Figure & Table 2.3: Total Global Onshore Wind Operating Costs ($m), Split by 8 Key Regions, 2024-2029
- 2.1.4. Total Wholesale Cost of Onshore Wind Energy
- Figure & Table 2.4: Total Global Price of Wholesale Onshore Wind Energy ($m), Split by 8 Key Regions, 2024-2029
- 2.1.1. Total Installed Onshore Wind Capacity
- 2.2. Offshore Wind Energy
- 2.2.1. Total Installed Offshore Wind Capacity
- Figure & Table 2.5: Total Installed Offshore Wind Capacity Globally (GW), Split by 8 Key Regions, 2024-2029
- 2.2.2. Total Spend on Offshore Wind Turbines
- Figure & Table 2.6: Total Spend on Offshore Wind Turbines Globally ($m), Split by 8 Key Regions, 2024-2029
- 2.2.3. Total Offshore Wind Turbine Operating Costs
- Figure & Table 2.7: Total Offshore Wind Turbine Operating Costs Globally per annum ($m), Split by 8 Key Regions, 2024-2029
- 2.2.4. Total Wholesale Cost of Offshore Wind Energy
- Figure & Table 2.8: Total Wholesale Cost of Offshore Wind Energy Globally ($m), Split by 8 Key Regions, 2024-2029
- 2.2.1. Total Installed Offshore Wind Capacity
- 2.3. Wind Energy
- 2.3.1. Proportion of Electricity Capacity Attributable to Wind
- Figure & Table 2.9: Proportion of Global Electricity Capacity Attributable to Wind Energy (%), Split by 8 Key Regions, 2024-2029
- 2.3.2. Total CO2 Equivalent Avoided Through Wind
- Figure & Table 2.10: Total CO2e Avoided by Wind Energy Globally (Gt), Split by Key Regions, 2024-2029
- 2.3.1. Proportion of Electricity Capacity Attributable to Wind
3. Solar Energy Forecasts
- 3.1. Solar Energy
- 3.1.1. Total Installed Solar Capacity
- Figure & Table 3.1: Total Installed Solar Capacity Globally (GW), Split by 8 Key Regions, 2024-2029
- 3.1.2. Total Spend on Solar Modules
- Figure & Table 3.2: Total Spend on Solar Modules Globally ($m), Split by 8 Key Regions, 2024-2029
- 3.1.3. Total Solar Module Operating Costs
- Figure & Table 3.3: Total Solar Module Operating Costs Globally per annum ($m), Split by 8 Key Regions, 2024-2029
- 3.1.4. Total Wholesale Cost of Solar Energy
- Figure & Table 3.4: Total Wholesale Cost of Solar Energy ($m), Split by 8 Key Regions, 2024-2029
- 3.1.5. Proportion of Electricity Capacity Attributable to Solar
- Figure & Table 3.5: Proportion of Electricity Capacity Attributable to Solar Globally (%), Split by 8 Key Regions, 2024-2029
- 3.1.6. Total CO2 Equivalent Avoided Through Solar
- Figure & Table 3.6: Total CO2e Avoided Through Solar Globally (Gt), Split by 8 Key Regions, 2024-2029
- 3.1.1. Total Installed Solar Capacity
4. Hydroelectric Energy Forecasts
- 4.1. Hydroelectric Energy
- 4.1.1. Total Installed Hydroelectric Energy Capacity
- Figure & Table 4.1: Total Installed Hydroelectric Capacity Globally (GW), Split by 8 Key Regions, 2024-2029
- 4.1.2. Total Spend on Hydroelectric Plant Installation
- Figure & Table 4.2: Total Spend on Hydroelectric Power Plant Installation Globally ($m), Split by 8 Key Regions, 2024-2029
- 4.1.3. Total Hydroelectric Plant Operating Costs
- Figure & Table 4.3: Total Hydroelectric Plant Operating Costs Globally per annum ($m), Split by 8 Key Regions, 2024-2029
- 4.1.4. Total Wholesale Cost of Hydroelectric Energy
- Figure & Table 4.4: Total Wholesale Cost of Hydroelectric Energy Globally ($m), Split by 8 Key Regions, 2024-2029
- 4.1.5. Proportion of Electricity Generated Attributable to Hydro
- Figure & Table 4.5: Proportion of Electricity Generated Attributable to Hydro Globally (%), Split by 8 Key Regions, 2024-2029
- 4.1.6. Total CO2 Equivalent Avoided Through Hydro
- Figure & Table 4.6: Total CO2e Avoided Through Hydro Globally (Gt), Split by 8 Key Regions, 2024-2029
- 4.1.1. Total Installed Hydroelectric Energy Capacity
5. Bioenergy Forecasts
- 5.1. Bioenergy
- 5.1.1. Total Installed Bioenergy Capacity
- Figure & Table 5.1: Total Installed Bioenergy Capacity Globally (GW), Split by 8 Key Regions, 2024-2029
- 5.1.2. Total Spend on Bioenergy Plant Installation
- Figure & Table 5.2: Total Spend on Bioenergy Plant Installation Globally ($m), Split by 8 Key Regions, 2024-2029
- 5.1.3. Total Bioenergy Plant Operating Costs
- Figure & Table 5.3: Total Bioenergy Plant Operating Costs Globally per annum ($m), Split by 8 Key Regions, 2024-2029
- 5.1.4. Total Wholesale Cost of Bioenergy
- Figure & Table 5.4: Total Wholesale Cost of Bioenergy Globally ($m), Split by 8 Key Regions, 2024-2029
- 5.1.5. Proportion of Electricity Capacity Attributable to Bioenergy
- Figure & Table 5.5: Proportion of Electricity Capacity Attributable to Bioenergy Globally (%), Split by 8 Key Regions, 2024-2029
- 5.1.6. Total CO2 Equivalent Avoided Through Bioenergy
- Figure & Table 5.6: Total CO2e Avoided Through Bioenergy Globally (Gt), Split by 8 Key Regions, 2024-2029
- 5.1.1. Total Installed Bioenergy Capacity
6. Coal Energy Forecasts
- 6.1. Coal Energy
- 6.1.1. Total Installed Coal Capacity
- Figure & Table 6.1: Total Installed Coal Capacity Globally (GW), Split by 8 Key Regions, 2024-2029
- 6.1.2. Total Coal Plant Operating Costs
- Figure & Table 6.2: Total Coal Plant Operating Costs Globally per annum ($m), Split by 8 Key Regions, 2024-2029
- 6.1.3. Total Wholesale Cost of Coal Energy
- Figure & Table 6.3: Total Wholesale Cost of Coal Energy Globally ($m), Split by 8 Key Regions, 2024-2029
- 6.1.4. Proportion of Electricity Capacity Attributable to Coal Power
- Figure & Table 6.4: Proportion of Electricity Capacity Attributable to Coal Power Globally (%), Split by 8 Key Regions, 2024-2029
- 6.1.5. Total CO2 Produced by Coal Energy Generation
- Figure & Table 6.5: Total Amount of CO2 Produced From Coal Energy Generation Globally (Gt), Split by 8 Key Regions, 2024-2029
- 6.1.1. Total Installed Coal Capacity
7. Gas Energy Forecasts
- 7.1. Gas Energy
- 7.1.1. Total Installed Gas Power Capacity
- Figure & Table 7.1: Total Installed Gas Power Capacity Globally (GW), Split by 8 Key Regions, 2024-2029
- 7.1.2. Total Gas Plant Operating Costs
- Figure & Table 7.2: Total Gas Plant Operating Costs Globally per annum ($m), Split by 8 Key Regions, 2024-2029
- 7.1.3. Total Wholesale Cost of Gas Energy
- Figure & Table 7.3: Total Wholesale Cost of Gas Energy Globally ($m), Split by 8 Key Regions, 2024-2029
- 7.1.4. Proportion of Electricity Capacity Attributable to Gas Power
- Figure & Table 7.4: 7.1.4. Proportion of Electricity Capacity Attributable to Gas Power Globally (%), Split by 8 Key Regions, 2024-2029
- 7.1.5. Total CO2 Produced From Gas Energy Generation
- Figure & Table 7.5: 7.1.5. Total CO2 Produced From Gas Energy Generation Globally (Gt), Split by 8 Key Regions, 2024-2029
- 7.1.1. Total Installed Gas Power Capacity
8. Oil Energy Forecasts
- 8.1. Oil Energy
- 8.1.1. Total Installed Oil Power Capacity
- Figure & Table 8.1: Total Installed Oil Power Capacity Globally (GW), Split by 8 Key Regions, 2024-2029
- 8.1.2. Total Oil Plant Operating Costs per annum
- Figure & Table 8.2: Total Oil Plant Operating Costs Globally per annum ($m), Split by 8 Key Regions, 2024-2029
- 8.1.3. Total Wholesale Cost of Oil Energy
- Figure & Table 8.3: Total Wholesale Cost of Oil Energy Globally ($m), Split by 8 Key Regions, 2024-2029
- 8.1.4. Proportion of Electricity Capacity Attributable to Oil Power
- Figure & Table 8.4: Proportion of Electricity Capacity Attributable to Oil Power (%), Split by 8 Key Regions, 2024-2029
- 8.1.5. Total CO2 Produced From Oil Energy Generation
- Figure & Table 8.5: Total CO2 Produced From Oil Energy Generation Globally (Gt), Split by 8 Key Regions, 2024-2029
- 8.1.1. Total Installed Oil Power Capacity
9. Nuclear Energy Forecasts
- 9.1. Nuclear Energy
- 9.1.1. Total Installed Nuclear Power Capacity
- Figure & Table 9.1: Total Installed Nuclear Power Capacity Globally (GW), Split by 8 Key Regions, 2024-2029
- 9.1.2. Total Nuclear Plant Operating Costs
- Figure & Table 9.2: Total Nuclear Power Plant Operating Costs Globally ($m), Split by 8 Key Regions, 2024-2029
- 9.1.3. Total Wholesale Cost of Nuclear Energy
- Figure & Table 9.3: Total Wholesale Cost of Nuclear Energy Globally ($m), Split by 8 Key Regions, 2024-2029
- 9.1.4. Proportion of Electricity Capacity Attributable to Nuclear Power
- Figure & Table 9.4: Proportion of Electricity Capacity Attributable to Nuclear Power Globally (%), Split by 8 Key Regions, 2024-2029
- 9.1.1. Total Installed Nuclear Power Capacity
