銀行業務における不正検知・防止市場:2025-2030年
Fraud Detection & Prevention in Banking Market: 2025-2030- 発行日
- ページ情報
- 英文
- 納期
- 即日から翌営業日
- 商品コード
- 1788493
- 翻訳ツール提供対象 PDF対応AI翻訳ツールの無料貸し出しサービスのご利用が可能です
- 通信/IT関連専門 通信/IT関連専門を専門とする市場調査会社です。
概要
合成IDが脅威となり、2030年までに世界の金融機関は詐欺によって583億ドルの損失を被る見込み
| 主要統計 | |
|---|---|
| 金融機関による不正検知・防止への支出 (2025年): | 211億米ドル |
| 金融機関による不正検知・防止への支出 (2030年): | 391億米ドル |
| 2025年から2030年の市場成長率: | 85.5% |
| 予測期間: | 2025-2030年 |
概要
当調査スイートは、あらゆる種類の不正行為と、それらを克服するために用いられる方法について、包括的かつ詳細な分析を提供します。これにより、銀行や金融機関、フィンテック企業といったステークホルダーは、将来の成長、主要動向、競合環境を理解することが可能になります。本レポートでは、銀行業務における新たな不正要素を評価し、主要な市場動向を強調するとともに、不正対策ソリューション導入における地域ごとの機会を検討しています。
本スイートには、複数のオプションが含まれており、それぞれ個別に購入することも可能です。具体的には、金融機関による将来的な不正対策ソリューションへの支出をマッピングしたデータへのアクセス、不正防止市場における最新のトレンドと機会を明らかにする洞察に富んだ調査、不正防止ソリューションを提供する主要15社の詳細な分析を収録した文書などが含まれます。さらに、これらすべてを含むフルリサーチスイートとして一括購入することもでき、その場合は大幅な割引価格で提供されます。
本レポートは、急速に進化する不正行為の状況を理解するための不可欠なリソースであり、ステークホルダーが効果的な将来戦略を構築することを可能にします。その包括的なインサイトと広範なカバレッジにより、この調査スイートは、成長著しい市場環境における計画立案と意思決定を支援する極めて有用なツールとなっています。
本レポートはすべて英語で作成されています。
主な特徴
- 市場力学:不正の要因や、金融機関が直面する主要な課題など、主要動向や市場拡大の課題についてのインサイトを提供します。本レポートでは、不正防止ソリューションが取引のリスク監視に果たす役割、不正防止における機械学習の活用、不正防止の状況に影響を与える規制について分析します。さらに、不正防止市場の現状の発展段階やセグメント成長を8つの主要地域にわたって評価する国別準備度指数を掲載し、将来の展望も提示しています。
- 主な要点と戦略的提言:不正防止ソリューション市場における主要な成長機会や調査結果を深く分析し、ステークホルダー向けに戦略的な提言を提供します。
- ベンチマーク業界予測:不正検知・防止データセットには、不正取引の総額予測、金融機関による不正防止ソリューションへの支出予測、各市場セグメントにおける取引量の予測が含まれています。
- Juniper Researchの競合リーダーボード:Juniper Researchの競合リーダーボードを通じて、不正防止ベンダー15社の能力を評価します。
サンプルビュー
市場データ・予測レポート
サンプル
市場動向・戦略レポート
市場データ&予測レポート
本調査スイートには、54の表と24,600のデータポイントからなる予測データ一式へのアクセスが含まれています。
- 不正取引の総取引件数および総取引額
- 銀行および金融機関による不正検知・防止ソリューションへの年間総支出額:セグメント別:
- 銀行および信用組合
- フィンテック
- 投資会社
- 貸金業者
Juniper Researchのインタラクティブ予測 (Excel) には以下の機能が含まれています:
- 統計分析:データ期間中の全地域・国について表示される特定の指標を検索できるのがメリットです。グラフは簡単に修正でき、クリップボードへのエクスポートも可能です。
- 国別データツール:このツールでは、予測期間中のすべての地域と国の指標を見ることができます。検索バーで表示される指標を絞り込むことができます。
- 国別比較ツール:特定の国を選択して比較することができます。このツールには、グラフをエクスポートする機能が含まれています。
- What-if分析:5つのインタラクティブなシナリオにより、ユーザーは予測の前提条件と比較することができます。
競合リーダーボードレポート
|
|
目次
市場動向・戦略
第1章 市場サマリー
- 重要ポイントと戦略的推奨事項
- 戦略的提言
第2章 市場情勢
- 市場情勢とセグメンテーション
- 定義と範囲
- 詐欺の種類
- 一次不正
- 申込詐欺および偽アカウント
- マネーミュール
- フロンティング
- スリーパー詐欺
- APP詐欺
- ソーシャルエンジニアリング詐欺
- マネーロンダリング
- チャージバック詐欺
- ATO
- 合成ID詐欺
- AIによる不正行為
- 内部脅威
- 一次不正
- 発行側で不正検知・防止に用いられるソリューション
- 不正行為検出および防止システム
- 生体認証
- トークン化
- 行動分析
- マネーロンダリング防止ソフトウェア
- 不正行為検出および防止システム
- 課題
- インフレと金融不安
- 技術の進歩
- アンバンクト層(銀行サービスを十分に受けられない層)を保護する緊急性
- 急速に進化する不正の状況
- サイバーセキュリティ人材の不足
第3章 セクター分析:ペイメントタイプ別
- ペイメントタイプ
- オープンバンキング
- 後払いサービス
- CBDC
- 暗号通貨
- 即時支払い
- 送金
- QRコード
- ソリューションと機会
- AI
- 機械学習
- API
- 耐量子暗号
- 規則
第5章 セグメント分析:産業別
- セグメント分析
- 銀行および信用組合
- フィンテック企業
- 貸金業者
- 投資会社
- 付加価値サービス
- 請求書ファイナンス
- 買掛金と売掛金の自動化
- 貿易金融
- キャッシュフロー予測と分析
- 照合サービス
競合リーダーボード
第1章 競合リーダーボード
- このレポートを読む理由
- 発行者不正防止ベンダープロファイル
- Accertify
- ACI Worldwide
- ComplyAdvantage
- Discover Financial Services
- Entrust
- Feedzai
- Fiserv
- Hawk
- LexisNexis Risk Solutions
- Mastercard
- SEON
- Thales
- Tookitaki
- TransUnion
- Visa
データ・予測
第1章 市場概要
- 定義と範囲
第2章 予測サマリー
- 発行者別不正行為防止予測のサマリー
- 不正検出・防止ソリューションを導入している銀行およびその他の金融機関の数
- 銀行・金融機関による不正検知・防止ソリューションへの年間総支出
- デジタルバンキングと送金における不正取引の総数
- 銀行および送金における不正取引の総額
第3章 銀行およびその他の金融機関
- 不正検出・防止ソリューションを使用している銀行および信用組合の数
- 不正検出・防止ソリューションへの総支出
第4章 フィンテック
- 不正検出・防止ソリューションを導入しているフィンテック企業の数
- 不正検出・防止ソリューションへの総支出
第5章 投資会社
- 不正検出・防止ソリューションを導入している投資会社の数
- 不正検出・防止ソリューションへの総支出
第6章 貸金業者
- 不正検出および防止ソリューションを使用している貸金業者の数
- 不正検出・防止ソリューションへの総支出
第7章 銀行および送金における不正取引
- デジタルバンキングにおける不正取引の総数
- デジタルバンキングにおける不正取引の総額
- 送金における不正取引の総数
- 送金における不正取引総額
目次
'Fraud to Cost Financial Institutions $58.3 Billion by 2030 Globally, as Synthetic Identities Threaten Fraud Tidal Wave'
| KEY STATISTICS | |
|---|---|
| Spend on fraud detection and prevention by financial institutions in 2025: | $21.1 billion |
| Spend on fraud detection and prevention by financial institutions by 2030: | $39.1 billion |
| 2025 to 2030 market growth: | 85.5% |
| Forecast period: | 2025-2030 |
Overview
Our 'Fraud Detection and Prevention in Banking' research suite provides a comprehensive and in-depth analysis of the types of fraud, and methods that can be used to overcome them. This enables stakeholders such as banks, financial institutions, and fintechs to understand future growth, key trends and the competitive environment. The report evaluates emerging elements of banking fraud, highlights key market trends, and examines regional opportunities in fraud solution adoption.
The suite includes several different options that can be purchased separately, including access to data mapping the future spend on fraud solutions by financial institutions, an insightful study uncovering the latest trends and opportunities within the fraud prevention market, and a document containing extensive analysis of the 15 market leaders facilitating fraud prevention solutions. The coverage can also be purchased as a Full Research Suite, containing all these elements, at a substantial discount.
This report serves as an essential resource for understanding the rapidly evolving fraud landscape; empowering stakeholders to shape effective future strategies. With its comprehensive insights and extensive coverage, this research suite is an invaluable tool for navigating and planning in a fast-growing landscape.
All report content is delivered in the English language.
Key Features
- Market Dynamics: Insights into key trends and market expansion challenges within the fraud prevention solutions market, including drivers of fraud and major challenges faced by financial institutions regarding fraud. The report addresses the role of fraud prevention solutions in monitoring transactions for risk, the use of machine learning in fraud prevention, and the regulations affecting the fraud prevention landscape. The research also features a Country Readiness Index on the current development and segment growth of the fraud prevention market across eight key regions, as well as providing a future outlook.
- Key Takeaways & Strategic Recommendations: In-depth analysis of key development opportunities and findings within the solutions for fraud prevention market, accompanied by strategic recommendations for stakeholders.
- Benchmark Industry Forecasts: The fraud detection and prevention dataset includes forecasts for the total value of fraudulent transactions, including the spend on fraud prevention solutions by financial institutions, and the transaction volume of various market segments.
- Juniper Research Competitor Leaderboard: Key market player capability and capacity assessment for 15 fraud prevention vendors, via the Juniper Research Competitor Leaderboard; featuring market size for major players in the fraud prevention market.
SAMPLE VIEW
Market Data & Forecasting Report
The numbers tell you what's happening, but our written report details why, alongside the methodologies.
SAMPLE VIEW
Market Trends & Strategies Report
A comprehensive analysis of the current market landscape, alongside strategic recommendations.
Market Data & Forecasting Report
The market-leading research suite for the 'Fraud Detection and Prevention in Banking' market includes access to the full set of forecast data of 54 tables and 24,600 datapoints.
Metrics in the research suite include:
- Total Transaction Volume and Value of Fraudulent Transactions
- Total Annual Spend on Fraud Detection and Prevention Solutions by Banks and Financial Institutions, Split by the Following Market Segments:
- Banks and Credit Unions
- Fintechs
- Investment Companies
- Lending Companies
Juniper Research's Interactive Forecast Excel contains the following functionality:
- Statistics Analysis: Users benefit from the ability to search for specific metrics, displayed for all regions and countries across the data period. Graphs are easily modified and can be exported to the clipboard.
- Country Data Tool: This tool lets users look at metrics for all regions and countries in the forecast period. Users can refine the metrics displayed via a search bar.
- Country Comparison Tool: Users can select and compare specific countries. The ability to export graphs is included in this tool.
- What-if Analysis: Here, users can compare forecast metrics against their own assumptions, via five interactive scenarios.
Market Trends & Strategies Report
This report examines the 'Fraud Detection and Prevention in Banking' market landscape in depth; assessing trends and factors shaping the evolution of this rapidly growing market. The report delivers comprehensive analysis of the strategic opportunities for vendors providing fraud prevention solutions; addressing key verticals such as banks, credit unions, fintechs, investment companies, and lenders. This report also includes evaluation of key country-level opportunities for stakeholders in the fraud prevention market.
Competitor Leaderboard Report
The Competitor Leaderboard report provides a detailed evaluation and market positioning for 15 leading vendors in the fraud prevention space. The vendors are positioned as established leaders, leading challengers, or disruptors and challengers, based on capacity and capability assessments:
|
|
This document is centred around the Juniper Research Competitor Leaderboard; a vendor positioning tool that provides an at-a-glance view of the competitive landscape in a market, backed by a robust methodology.
Table of Contents
Market Trends & Strategies
1. Market Summary
- 1.1. Key Takeaways & Strategic Recommendations
- 1.2. Strategic Recommendations
2. Market Landscape
- 2.1. Market Landscape & Segmentation
- 2.1.1. Introduction
- 2.1.2. Definitions and Scope
- 2.2. Types of Fraud
- Figure 2.1: Types of Fraud
- 2.2.1. First-party Fraud
- i. Application Fraud and Fake Accounts
- ii. Money Mules
- iii. Fronting
- iv. Sleeper Fraud
- v. APP Fraud
- vi. Social Engineering Fraud
- 2.2.2. Money Laundering
- 2.2.3. Chargeback Fraud
- 2.2.4. ATO
- 2.2.5. Synthetic Identity
- i. Detection of Synthetic Identity Fraud
- 2.2.6. AI-driven Fraud
- 2.2.7. Insider Threat
- 2.3. Solutions Used in Issuer Fraud Detection & Prevention
- 2.3.1. Fraud Detection & Prevention Systems
- i. Biometric Identification
- ii. Tokenisation
- iii. Behavioural Analytics
- iv. AML Software
- 2.3.1. Fraud Detection & Prevention Systems
- 2.4. Challenges
- 2.4.1. Introduction
- Figure 2.2: Major Challenges Faced by Financial Institutions in the Fraud Landscape
- 2.4.2. Inflation and Financial Uncertainty
- 2.4.3. Technological Advancement
- 2.4.4. Urgent Need to Protect the 'Underbanked'
- 2.4.5. Rapidly Evolving Fraud Landscape
- 2.4.6. Cyber Security Talent Shortage
- 2.4.1. Introduction
3. Sector Analysis: Payment Types
- 3.1. Payment Types
- 3.1.1. Open Banking
- i. Avenues of Fraud Through Open Banking
- ii. How Open Banking Can Help Prevent Banking Fraud
- 3.1.2. Buy Now, Pay Later
- 3.1.3. CBDCs
- 3.1.4. Cryptocurrency
- 3.1.5. Instant Payments
- 3.1.6. Money Transfer
- 3.1.7. QR Codes
- i. Avenues of Fraud Via QR Code Payments
- ii. How QR Code Payments Can Reduce Fraud
- 3.1.1. Open Banking
- 4.1. Solutions & Opportunities
- 4.1.1. AI
- i. Advantages of AI in Fraud Detection and Prevention
- ii. Disadvantages of AI in Fraud Detection and Prevention
- 4.1.2. Machine Learning
- i. Advantages of Machine Learning in Fraud Detection and Prevention
- ii. Disadvantages of ML in Fraud Detection and Prevention
- 4.1.3. APIs
- i. Advantages of APIs in Fraud Detection and Prevention
- ii. Disadvantages of APIs in Fraud Detection and Prevention
- 4.1.4. Quantum-safe Cryptography
- i. Advantages of Quantum-safe Cryptography in Fraud Detection and Prevention
- ii. Disadvantages of Quantum-safe Cryptography in Fraud Detection and Prevention
- 4.1.1. AI
- 4.2. Regulations
- 4.2.1. UK Faster Payments Regulation
- 4.2.2. PSD2
- 4.2.3. Brazil's PIX Instant Payment Regulation
- 4.2.4. India's UPI and Real-time Payment Regulation
5. Segment Analysis: Business Verticals
- 5.1. Segment Analysis
- 5.1.1. Introduction
- 5.1.2. Banks and Credit Unions
- 5.1.3. Fintechs
- 5.1.4. Lenders
- 5.1.5. Investment Companies
- 5.1.6. Value-added Services
- 5.1.7. Invoice Financing
- 5.1.8. Accounts Payable (AP) and Accounts Receivable (AR) Automation
- 5.1.9. Trade Financing
- 5.1.10. Cashflow Forecasting and Analytics
- 5.1.11. Reconciliation Services
Competitor Leaderboard
1. Competitor Leaderboard
- 1.1. Why Read This Report
- Figure 1.1: Juniper Research Competitor Leaderboard: Fraud Detection & Prevention in Banking Vendor Product Portfolio
- Figure 1.2: Juniper Research Leaderboard: Fraud Detection & Prevention in Banking Vendors
- Table 1.3: Juniper Research Leaderboard: Fraud Detection & Prevention in Banking Vendor Positioning
- Figure 1.4: Juniper Research Leaderboard Heatmap: Fraud Detection & Prevention in Banking Vendors
- 1.2. Issuer Fraud Prevention Vendor Profiles
- 1.2.1. Accertify
- i. Corporate Information
- ii. Geographical Spread
- iii. Key Clients & Strategic Partnerships
- iv. High-level View of Offerings
- v. Juniper Research's View: Key Strengths & Strategic Development Opportunities
- 1.2.2. ACI Worldwide
- i. Corporate Information
- ii. Geographical Spread
- iii. Key Clients & Strategic Partnerships
- iv. High-level View of Offerings
- v. Juniper Research's View: Key Strengths & Strategic Development Opportunities
- 1.2.3. ComplyAdvantage
- i. Corporate Information
- ii. Geographical Spread
- iii. Key Clients & Strategic Partnerships
- iv. High-level View of Offerings
- v. Juniper Research's View: Key Strengths & Strategic Development Opportunities
- 1.2.4. Discover Financial Services
- i. Corporate Information
- ii. Geographical Spread
- iii. Key Clients & Strategic Partnerships
- iv. High-level View of Offerings
- v. Juniper Research's View: Key Strengths & Strategic Development Opportunities
- 1.2.5. Entrust
- i. Corporate Information
- ii. Geographical Spread
- iii. Key Clients & Strategic Partnerships
- iv. High-level View of Offerings
- v. Juniper Research's View: Key Strengths & Strategic Development Opportunities
- 1.2.6. Feedzai
- i. Corporate Information
- ii. Geographical Spread
- iii. Key Clients & Strategic Partnerships
- iv. High-level View of Offerings
- v. Juniper Research's View: Key Strengths & Strategic Development Opportunities
- 1.2.7. Fiserv
- i. Corporate Information
- ii. Geographical Spread
- iii. Key Clients & Strategic Partnerships
- iv. High-level View of Offerings
- v. Juniper Research's View: Key Strengths & Strategic Development Opportunities
- 1.2.8. Hawk
- i. Corporate Information
- ii. Geographical Spread
- iii. Key Clients & Strategic Partnerships
- iv. High-level View of Offerings
- v. Juniper Research's View: Key Strengths & Strategic Development Opportunities
- 1.2.9. LexisNexis Risk Solutions
- i. Corporate Information
- ii. Geographical Spread
- iii. Key Clients & Strategic Partnerships
- iv. High-level View of Offerings
- v. Juniper Research's View: Key Strengths & Strategic Development Opportunities
- 1.2.10. Mastercard
- i. Corporate Information
- ii. Geographical Spread
- iii. Key Clients & Strategic Partnerships
- iv. High-level View of Offerings
- v. Juniper Research's View: Key Strengths & Strategic Development Opportunities
- 1.2.11. SEON
- i. Corporate Information
- ii. Geographical Spread
- iii. Key Clients & Strategic Partnerships
- iv. High-level View of Offerings
- v. Juniper Research's View: Key Strengths & Strategic Development Opportunities
- 1.2.12. Thales
- i. Corporate Information
- ii. Geographical Spread
- iii. Key Clients & Strategic Partnerships
- iv. High-level View of Offerings
- v. Juniper Research's View: Key Strengths & Strategic Development Opportunities
- 1.2.13. Tookitaki
- i. Corporate Information
- ii. Geographical Spread
- iii. Key Clients & Strategic Partnerships
- iv. High-level View of Offerings
- v. Juniper Research's View: Key Strengths & Strategic Development Opportunities
- 1.2.14. TransUnion
- i. Corporate Information
- ii. Geographical Spread
- iii. Key Clients & Strategic Partnerships
- iv. High-level View of Offerings
- v. Juniper Research's View: Key Strengths & Strategic Development Opportunities
- 1.2.15. Visa
- i. Corporate Information
- ii. Geographical Spread
- iii. Key Clients & Strategic Partnerships
- iv. High-level View of Offerings
- v. Juniper Research's View: Key Strengths & Strategic Development Opportunities
- 1.2.1. Accertify
Data & Forecasting
1. Market Overview
- 1.1. Introduction
- 1.2. Definitions and Scope
- 1.2.1. Forecast Introduction
- 1.2.2. Methodology & Assumptions
- i. Methodology
- ii. Assumptions
- Figure 1.1: Fraud Detection & Prevention in Banking Market 2025-2030: Forecast Methodology
2. Forecast Summary
- 2.1. Issuer Fraud Prevention Forecast Summary
- 2.1.1. Number of Banks and Other Financial Institutions Using Fraud Detection & Prevention Solutions
- Figure & Table 2.1: Number of Banks & FIs Using FDP Solutions, Split by 8 Key Regions, 2025-2030
- 2.1.2. Total Annual Spend on Fraud Detection & Prevention Solutions by Banks & FIs
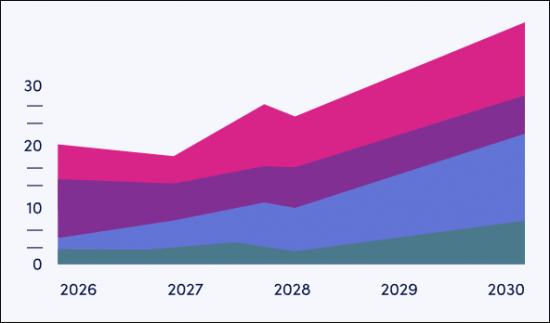
- Figure & Table 2.2: Total Annual Spend on FDP Solutions by Banks & FIs ($m), Split by 8 Key Regions, 2025-2030
- 2.1.3. Total Number of Fraudulent Transactions across Digital Banking and Money Transfers
- Figure & Table 2.3: Total Number of Fraudulent Transactions across Digital Banking and Money Transfer (m), Split by 8 Key Regions, 2025-2030
- 2.1.4. Total Value of Fraudulent Transactions across Banking and Money Transfers
- Figure & Table 2.4: Total Value of Fraudulent Banking & Money Transfer Transactions ($m), Split by 8 Key Regions, 2025-2030
- 2.1.1. Number of Banks and Other Financial Institutions Using Fraud Detection & Prevention Solutions
3. Banks and Other Financial Institutions
- 3.1.1. Number of Banks and Credit Unions Using Fraud Detection & Prevention Solutions
- Figure & Table 3.1: Banks & Credit Unions Using FDP Solutions, Split by 8 Key Regions, 2025-2030
- 3.1.2. Total Spend by Banks & Credit Unions on Fraud Detection & Prevention Solutions
- Figure & Table 3.2: Total Spend by Banks & Credit Unions on FDP Solutions ($m), Split by 8 Key Regions, 2025-2030
4. Fintechs
- 4.1.1. Number of Fintechs Using Fraud Detection & Prevention Solutions
- Figure & Table 4.1: Number of Fintechs Using FDP Solutions, Split by 8 Key Regions, 2025-2030
- 4.1.2. Total Spend by Fintechs on Fraud Detection & Prevention Solutions
- Figure & Table 4.2: Total Spend by Fintechs on FDP Solutions ($m), Split by 8 Key Regions, 2025-2030
5. Investment Companies
- 5.1.1. Number of Investment Companies Using Fraud Detection & Prevention Solutions
- Figure & Table 5.1: Number of Investment Companies Using FDP Solutions, Split by 8 Key Regions, 2025-2030
- 5.1.2. Total Spend by Investment Companies on Fraud Detection & Prevention Solutions
- Figure & Table 5.2: Total FDP Spend by Investment Companies ($m), Split by 8 Key Regions, 2025-2030
6. Lenders
- 6.1.1. Number of Lenders Using Fraud Detection & Prevention Solutions
- Figure & Table 6.1: Number of Lenders Using FDP Solutions, Split by 8 Key Regions, 2025-2030
- 6.1.2. Total Spend by Lenders on Fraud Detection & Prevention Solutions
- Figure & Table 6.2: Total Spend by Lenders on FDP Solutions ($m), Split by 8 Key Regions, 2025-2030
7. Fraudulent Transactions in Banking and Money Transfers
- 7.1.1. Total Number of Fraudulent Transactions in Digital Banking
- Figure & Table 7.1: Total Number of Fraudulent Transactions in Digital Banking (m), Split by 8 Key Regions, 2025-2030
- 7.1.2. Total Value of Fraudulent Transactions in Digital Banking
- Figure & Table 7.2: Total Value of Fraudulent Transactions in Digital Banking ($m), Split by 8 Key Regions, 2025-2030
- 7.1.3. Total Number of Fraudulent Transactions in Money Transfer
- Figure & Table 7.3: Total Number of Fraudulent Transactions in Money Transfer (m), Split by 8 Key Regions, 2025-2030
- 7.1.4. Total Fraudulent Transactions Value in Money Transfer
- Figure & Table 7.4: Total Fraudulent Transactions Value ($m), Split by 8 Key Regions, 2025-2030
- 発行日
- 発行
- Juniper Research Ltd
- ページ情報
- 英文
- 納期
- 即日から翌営業日


