|
|
市場調査レポート
商品コード
1286054
統合脅威管理 (UTM) 市場:動向・戦略・市場予測 (2023-2028年)Unified Threat Management Market: Trends, Strategies & Market Forecasts 2023-2028 |
||||||
|
|
|||||||
|
|||||||


| 統合脅威管理 (UTM) 市場:動向・戦略・市場予測 (2023-2028年) |
|
出版日: 2023年06月05日
発行: Juniper Research Ltd
ページ情報: 英文
納期: 即日から翌営業日
|

- 全表示
- 概要
- 目次
企業による統合脅威管理 (UTM) への支出額は、2023年に75億米ドルを示し、2028年にかけては98%の増加を示すと予測されています。
企業によるクラウド導入の拡大、IoTデバイスの利用、AIによる新たな脅威の発生など、サイバー脅威の状況が複雑化する中、企業が安全な状態を維持するためには、統合脅威管理 (UTM) が必要であり、企業による投資レベルの向上が予想されています。
主な市場統計
| 2023年の市場規模 | 7億5,000万米ドル |
| 2028年の市場規模 | 148億米ドル |
| 2023年から2028年の成長率 | 98% |
当レポートでは、世界の統合脅威管理 (UTM) の市場を調査し、市場概要、主要動向、市場成長への影響因子の分析、市場規模の推移・予測、各種区分・地域/主要国別の詳細分析、主要ベンダーの競合情勢、プロファイル、将来の展望、戦略的提言などをまとめています。
本調査スイートの構成:
- 戦略・予測 (PDF)
- 5カ年市場規模・予測スプレッドシート (Excel)
- 12カ月のオンラインデータプラットフォームへのアクセス権
目次
第1章 重要ポイント・戦略的提言
第2章 統合脅威管理 (UTM):市場情勢
- 定義・範囲
- 脅威の情勢
- 現在のUTMの情勢
- 主要動向・成長推進因子
第3章 統合脅威管理 (UTM):セグメント分析
- セグメント分析
- ネットワークファイアウォール
- 侵入検知システム
- 侵入防御システム
- ゲートウェイウイルス対策
- アプリケーション層 (層7) ファイアウォール&コントロール
- DPI
- Webプロキシ・コンテンツフィルタリング
- スパムおよびフィッシング攻撃に対する電子メールフィルタリング
- DLP (データ損失防止)
- SIEM
- VPN
- NAC (ネットワークアクセスコントロール)
- ネットワークターピット
- DoS、DDoS、ゼロデイ、スパイウェア保護に対する追加のセキュリティサービス
第4章 統合脅威管理 (UTM):競合リーダーボード・ベンダープロファイル
- ベンダープロファイル
- Arista
- Barracuda Networks
- Broadcom
- Check Point
- Cisco
- Clavister
- Comodo Group
- Fortinet
- Hillstone Networks
- IBM
- Juniper Networks
- Palo Alto Networks
- SonicWall
- Sophos
- Trustwave
- Venustech
- WatchGuard
- Juniper Researchの競合リーダーボード:評価手法
- 制限・解釈
第5章 市場予測
- 調査手法・前提
- UTM導入企業総数:地域別
- UTM支出額:地域別
REPORT OVERVIEW
Juniper Research's new “Unified Threat Management Market” research report provides an independent analysis of the future trajectory of this dynamic market within the wider cybersecurity landscape, with these solutions, also known as NGFW (Next-generation Firewalls), representing a new technological approach. It provides a comprehensive study of key industry trends, including the growth expected in the use of unified threat management systems, how these systems will transform the way enterprises manage their cybersecurity risks, and how smaller businesses are beginning to adopt these services. The report analyses how these systems will deal with wider changes within the cybersecurity space, including emerging advanced threat types.
The research also presents insightful forecasts for the market, including the number of businesses adopting next-generation firewall solutions and the associated spend by those businesses.
The unified threat management report positions 17 key players in the Juniper Research Competitor Leaderboard; providing an invaluable resource for stakeholders seeking to understand the competitive landscape in this highly varied and complex market.
The research suite comprises:
- Strategy & Forecasts (PDF)
- 5-year Market Sizing & Forecast Spreadsheet (Excel)
- 12 Months' Access to harvest Online Data Platform
Key Market Statistics
| Market size in 2023: | $7.5bn |
| Market size in 2028: | $14.8bn |
| 2023 to 2028 Growth: | 98% |
KEY FEATURES
- Market Dynamics: Provides a detailed assessment of market drivers and the key market trends within the unified threat management market, as well as an in-depth evaluation of the future growth of the market and readiness for further disruption. This includes an analysis of the state of the overall cybersecurity market and the external threats being faced within network security. This enables readers to understand the critical innovations driving this market forward.
- Key Takeaways & Strategic Recommendations: Featuring growth opportunities and crucial factors for unified threat management platforms highlighted across the landscape; making for important reading for key stakeholders, including the platforms themselves, broader cybersecurity vendors and regulators.
- Juniper Research Competitor Leaderboard: Key player capability and capacity assessment for 17 unified threat management providers; positioning them as either established leaders, leading challengers, or disruptors and challengers. Our Competitor Leaderboard scores these companies on their size of operations in the space, their extent and breadth of market partnerships, the sophistication of their platforms and Juniper Research's view on each company's innovation and future business prospects. The company profiles included in the Competitor Leaderboard are the following:
- Arista
- Barracuda Networks Inc
- Broadcom
- Check Point Software Technologies Ltd
- Cisco Systems
- Clavister
- Comodo Group
- Fortinet Inc
- Hillstone Networks
- IBM Corporation
- Juniper Networks Inc
- Palo Alto Networks Inc
- SonicWall Inc
- Sophos
- Trustwave
- Venustech
- WatchGuard Technologies, Inc
- Benchmark Industry Forecasts: 5-year forecasts for the unified threat management market, including the number of businesses adopting UTM solutions, and the associated enterprise spend. These metrics are split by business size, including large and SME. This data is also split by our 8 key regions and 60 countries as follows:
- North America:
- Canada, US
- Latin America:
- Argentina, Brazil, Chile, Colombia, Ecuador, Mexico, Peru, Uruguay
- West Europe:
- Austria, Belgium, Denmark, Finland, France, Germany, Greece, Ireland, Italy, Netherlands, Norway, Portugal, Spain, Sweden, Switzerland, UK
- Central & East Europe:
- Croatia, Czech Republic, Hungary, Poland, Romania, Russia, Turkey, Ukraine
- Far East & China:
- China, Hong Kong, Japan, South Korea
- Indian Subcontinent:
- Bangladesh, India, Nepal, Pakistan
- Rest of Asia Pacific:
- Australia, Indonesia, Malaysia, New Zealand, Philippines, Singapore, Thailand, Vietnam
- Africa & Middle East:
- Algeria, Egypt, Israel, Kenya, Kuwait, Nigeria, Qatar, Saudi Arabia, South Africa, United Arab Emirates
KEY QUESTIONS ANSWERED
- 1. Who are the most successful players in the unified threat management space, and why?
- 2. What are the largest segments for growth within unified threat management?
- 3. What role does machine learning play within unified threat management?
- 4. What is the value of the unified threat management market today, and what will it be in 2028?
- 5. What factors will spur unified threat management growth, both nationally and internationally?
COMPANIES REFERENCED
- Included in the Juniper Research Competitor Leaderboard: Arista, Barracuda Networks, Broadcom, Check Point, Cisco Umbrella, Clavister, Comodo Group, Fortinet, Hillstone Networks, IBM, Juniper Networks, Palo Alto Networks, SonicWall, Sophos, Trustwave, Venustech, WatchGuard.
- Mentioned: AB Bank, ACBA-Credit Agricole Bank, Accenture, Accor, Acorn Campus Ventures, Adobe, Advanced Micro Devices, Agricultural Bank of China, AIG, Airbus, Algeria Telecom, AliBaba, Amdocs, America First Credit Union, Anthem, Apple, Array Networks, Aston Martin, Atos, auth0, Authorize.Net, Avago Technologies, Avanan, Aviva, Awake Security, AWS, Bank of China, Bank One, Barracuda, BBVA, BDO, Big Switch, Bloomberg, Boeing, Braintrace, Bridgecrew, Brocade, Brompton Bikes, BT, Canon, Capsule8, Carrefour, China Construction Bank, China Mobile, China Telecom, China Union Pay, Cider Security, Citrix, City of Philadelphia, Cognizant, ConnectWise, CVS, DEFTA Partners, Dell, Deloitte, Delta Airlines, Deutsche Telekom, DHL, D-Link, Dragos, Esri, European Commission, European Investment Bank, Finastra, FireEye, First Data Corporation, FIS, Flexera, Forbes, Forcepoint, Ford, Gaumont, Globespan Capital Brothers, Google, Grab, Honda, Honeywell, HostGator, HP, HPE, ICBC, Indonet Partners, Intel, Kaspersky Lab, Kenna Security Inc, Keolis, Lehman Brothers, Loreal, Mastercard, McAfee, Meritech Capital Partners, Microsoft , Mitsubishi, Morrisons, Mount Sinai, MTN, MyDLP, MySQL, NASDAQ, National Airlines Corporation, National Grid, NHS, Nissan, Nokia, Nvidia, Oil India, Okta, OMEN Technologies AB, Opaq, Open Stack, OPSWAT, Oracle, Panasonic, Panda Security, Panopta, Phenix ID, Philips, Ping Identity, Proofpoint, PUMA, Qantas, Qatar Airways, Rabobank, Rakuten, RCB Bank, Red Hat, Redpoint, Refactr, RSA Security, Samsung SDS, SAP, Sentinel One, Sequoia Capital, Sharp, ShieldX Networks, Sken.ai, Slack, Société Générale, Spectral, Splunk, State of Utah, Stellar Cyber, Surgate Labs, Swarovski, Symantec CloudSOC, Telefónica, Tencent, Thales, The National Football League, The National Gallery, The New York Times, The People's Bank of China, The Ritz London, Thoma Bravo, Toyota, Toys R Us, Trend Micro, T-Systems, Turkcell, UCLA, Unitel, University of Colorado, Verizon, Visa, VMware, Vodafone, William Hill, WiteSand, Xero, Zoom, ZScaler.
DATA & INTERACTIVE FORECAST
The “Unified Threat Management Market” forecast suite includes 5-year forecasts for this market, including the following:
- The number of businesses that are adopting unified threat management solutions.
- The associated spend from businesses adopting unified threat management.
The above metrics are split by business size: large businesses and SMEs (Small & Medium Enterprises).
- Geographical splits: 60 countries
- Number of tables: 18 tables
- Number of datapoints: Over 7,300 datapoints
harvest: Our online data platform, harvest, contains the very latest market data and is updated throughout the year. This is a fully featured platform; enabling clients to better understand key data trends and manipulate charts and tables; overlaying different forecasts within the one chart - using the comparison tool. Empower your business with our market intelligence centre, and get alerted whenever your data is updated.
Interactive Excels (IFxl): Our IFxl tool enables clients to manipulate both forecast data and charts, within an Excel environment, to test their own assumptions using the interactive scenario tool and compare selected markets side by side in customised charts and tables. IFxls greatly increase a clients' ability to both understand a particular market and to integrate their own views into the model.
FORECAST SUMMARY
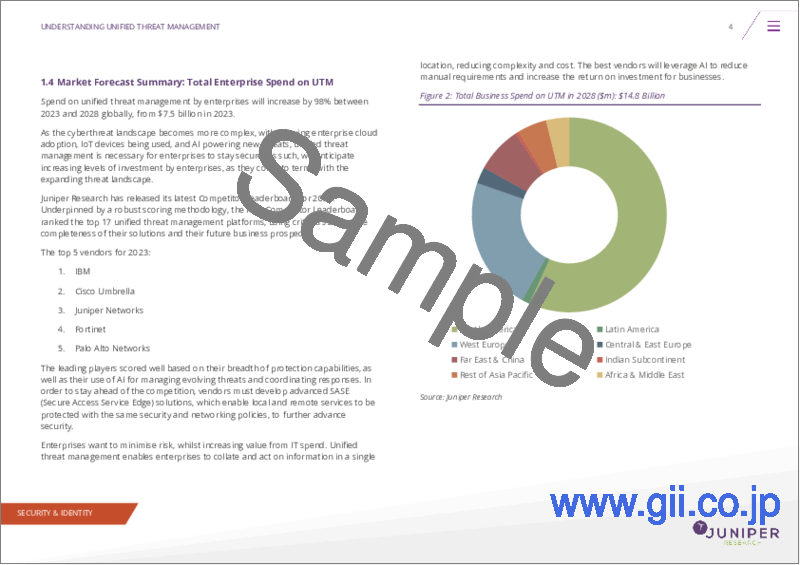
Spend on unified threat management by enterprises will increase by 98% between 2023 and 2028 globally, from $7.5 billion in 2023.
As the cyberthreat landscape becomes more complex, with growing enterprise cloud adoption, IoT devices being used, and AI powering new threats, unified threat management is necessary for enterprises to stay secure. As such, we anticipate increasing levels of investment by enterprises, as they come to terms with the expanding threat landscape.
Juniper Research has released its latest Competitor Leaderboard for 2023. Underpinned by a robust scoring methodology, the new Competitor Leaderboard ranked the top 17 unified threat management platforms, using criteria such as the completeness of their solutions and their future business prospects.
The top 5 vendors for 2023:
|
|
The leading players scored well based on their breadth of protection capabilities, as well as their use of AI for managing evolving threats and coordinating responses. In order to stay ahead of the competition, vendors must develop advanced SASE (Secure Access Service Edge) solutions, which enable local and remote services to be protected with the same security and networking policies, to further advance security.
Enterprises want to minimise risk, whilst increasing value from IT spend. Unified threat management enables enterprises to collate and act on information in a single location, reducing complexity and cost. The best vendors will leverage AI to reduce manual requirements and increase the return on investment for businesses.
Table of Contents
1. Key Takeaways & Strategic Recommendations
- 1.1. Key Takeaways
- 1.2. Strategic Recommendations
2. Unified Threat Management - Market Landscape
- 2.1. Introduction
- 2.2. Definitions and Scope
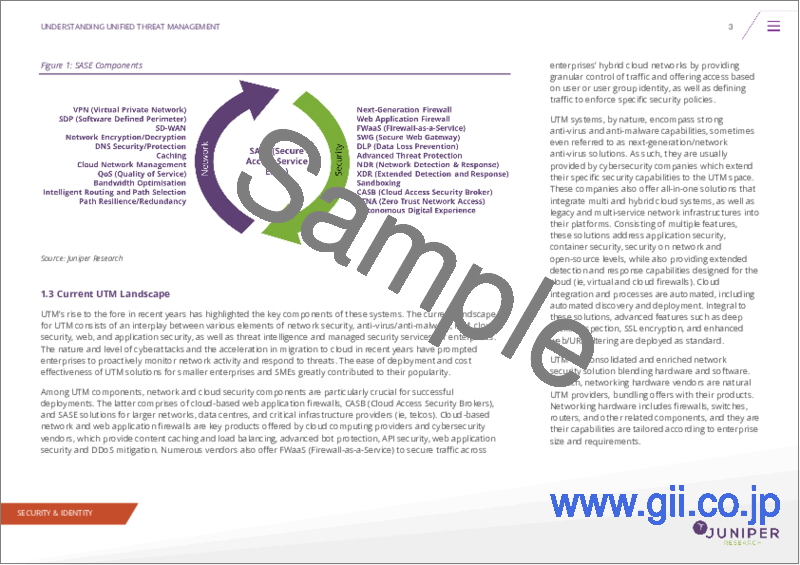
- Figure 2.1: SASE Components
- Figure 2.2: Core Tenets of ZTA
- 2.3. The Threat Landscape
- 2.4. Current UTM Landscape
- Figure 2.3: UTM Components
- 2.5. Key Trends & Drivers
- 2.5.1. Increasing Smaller Enterprise Adoption
- 2.5.2. The Impact of COVID-19 and Remote Working
- 2.5.3. The Rise of Passwordless
- 2.5.4. Hybrid UTM
- 2.5.5. ML and Automation
3. Unified Threat Management: Segment Analysis
- 3.1. Segment Analysis
- 3.1.1. Network Firewall
- Figure 3.1: Traditional Firewall versus NGFW Capabilities
- 3.1.2. Intrusion Detection System
- 3.1.3. Intrusion Prevention System
- Figure 3.2: Four Types of IPS
- 3.1.4. Gateway Anti-virus
- 3.1.5. Application Layer (Layer 7) Firewall and Control
- Figure 3.3: Network Layers
- 3.1.6. DPI
- 3.1.7. Web Proxy and Content Filtering
- 3.1.8. Email Filtering for Spam and Phishing Attacks
- 3.1.9. DLP (Data Loss Prevention)
- 3.1.10. SIEM
- Figure 3.4: Components of SIEM
- Figure 3.5: XDR Conceptual Architecture
- 3.1.11. VPN
- 3.1.12. NAC (Network Access Control)
- 3.1.13. Network Tarpit
- 3.1.14. Additional Security Services against DoS, DDoS, Zero Day, and Spyware Protection
- 3.1.1. Network Firewall
4. Unified Threat Management Competitor Leaderboard & Vendor Profiles
- 4.1. Why Read This Report?
- Table 4.1: Juniper Research Competitor Leaderboard: Unified Threat Management Vendors Included & Product Portfolio
- Table 4.2: Juniper Research Competitor Leaderboard: Unified Threat Management Vendors Included & Product Portfolio - Continued
- Figure 4.3: Juniper Research Competitor Leaderboard for Unified Threat Management Vendors
- Table 4.4: Juniper Research Competitor Leaderboard: Unified Threat Management Vendors & Positioning
- Table 4.5: Juniper Research Competitive Leaderboard Heatmap: Unified Threat Management Vendors
- 4.2. Vendor Profiles
- 4.2.1. Arista
- i. Corporate
- Table 4.6: Arista's Financial Performance Snapshot (USD $bn), 2018-2021
- ii. Geographical Spread
- iii. Key Clients & Strategic Partnerships
- iv. High-level View of Offerings
- Figure 4.7: Arista Zero Trust Networking Principles
- Figure 4.8: Components of Arista NDR
- v. Juniper Research's View: Strategic Recommendations & Key Opportunities
- i. Corporate
- 4.2.2. Barracuda Networks
- i. Corporate
- ii. Geographical Spread
- iii. Key Clients & Strategic Partnerships
- iv. High-level View of Offerings
- v. Juniper Research's View: Strategic Recommendations & Key Opportunities
- 4.2.3. Broadcom
- i. Corporate
- ii. Geographical Spread
- iii. Key Clients & Strategic Partnerships
- iv. High-level View of Offerings
- Figure 4.9: Overview of Symantec Enterprise Cloud
- Figure 4.10: Symantec Email Security.cloud
- v. Juniper Research's View: Strategic Recommendations & Key Opportunities
- 4.2.4. Check Point
- i. Corporate
- Table 4.11: Check Point's Financial Performance Snapshot (USD $m), 2018-2022
- ii. Geographical Spread
- iii. Key Clients & Strategic Partnerships
- iv. High-level View of Offerings
- v. Juniper Research's View: Strategic Recommendations & Key Opportunities
- i. Corporate
- 4.2.5. Cisco
- i. Corporate
- Table 4.12: Cisco's Financial Performance Snapshot (USD $bn), 2019-2022(FYE, 30th July)
- ii. Geographical Spread
- iii. Key Clients & Strategic Partnerships
- iv. High-level View of Offerings
- Figure 4.13: Cisco Umbrella Components
- Figure 4.14: Cisco Umbrella Secure Web Gateway
- v. Juniper Research's View: Strategic Recommendations & Key Opportunities
- i. Corporate
- 4.2.6. Clavister
- i. Corporate
- Table 4.15: Clavister's Financial Performance Snapshot (USD $m), 2018-2021
- ii. Geographical Spread
- iii. Key Clients & Strategic Partnerships
- iv. High-level View of Offerings
- Figure 4.16: Clavister NetWall Security Use Cases
- v. Juniper Research's View: Strategic Recommendations & Key Opportunities
- i. Corporate
- 4.2.7. Comodo Group
- i. Corporate
- ii. Geographical Spread
- iii. Key Clients & Strategic Partnerships
- iv. High-level View of Offerings
- Figure 4.17: Comodo/Xcitium ZeroDwell Containment
- v. Juniper Research's View: Strategic Recommendations & Key Opportunities
- 4.2.8. Fortinet
- i. Corporate
- Table 4.18: Fortinet's Financial Performance Snapshot (USD $m), 2018-2022
- ii. Geographical Spread
- iii. Key Clients & Strategic Partnerships
- iv. High-level View of Offerings
- v. Juniper Research's View: Strategic Recommendations & Key Opportunities
- i. Corporate
- 4.2.9. Hillstone Networks
- i. Corporate
- ii. Geographical Spread
- iii. Key Clients & Strategic Partnerships
- iv. High-level View of Offerings
- Figure 4.19: Hillstone Networks Services Overview
- v. Juniper Research's View: Strategic Recommendations & Key Opportunities
- 4.2.10. IBM
- i. Corporate
- Table 4.20: IBM's Financial Performance Snapshot ($bn), 2018-2022
- ii. Geographical Spread
- iii. Key Clients & Strategic Partnerships
- iv. High-level View of Offerings
- v. Juniper Research's View: Strategic Recommendations & Key Opportunities
- i. Corporate
- 4.2.11. Juniper Networks
- i. Corporate
- Table 4.21: Juniper Networks' Financial Performance Snapshot ($m), 2019-2022
- ii. Geographical Spread
- iii. Key Clients & Strategic Partnerships
- iv. High-level View of Offerings
- Figure 4.22: Juniper Mist Risk Profiling
- Figure 4.23: Enterprise at Home
- v. Juniper Research's View: Strategic Recommendations & Key Opportunities
- i. Corporate
- 4.2.12. Palo Alto Networks
- i. Corporate
- Table 4.24: Palo Alto Networks' Financial Performance Snapshot ($bn), 2019-2022(FYE, 31 July)
- ii. Geographical Spread
- iii. Key Clients & Strategic Partnerships
- iv. High-level View of Offerings
- Figure 4.25: Prisma Access Solution
- v. Juniper Research's View: Strategic Recommendations & Key Opportunities
- i. Corporate
- 4.2.13. SonicWall
- i. Corporate
- ii. Geographical Spread
- iii. Key Clients & Strategic Partnerships
- iv. High-level View of Offerings
- Figure 4.26: SonicWall Network Security Manager
- v. Juniper Research's View: Strategic Recommendations & Key Opportunities
- 4.2.14. Sophos
- i. Corporate
- ii. Geographical Spread
- iii. Key Clients & Strategic Partnerships
- iv. High-level View of Offerings
- v. Juniper Research's View: Strategic Recommendations & Key Opportunities
- 4.2.15. Trustwave
- i. Corporate
- ii. Geographical Spread
- iii. Key Clients & Strategic Partnerships
- iv. High-level View of Offerings
- v. Juniper Research's Strategic Recommendations & Key Opportunities
- 4.2.16. Venustech
- i. Corporate
- ii. Geographical Spread
- iii. Key Clients & Strategic Partnerships
- iv. High-level View of Offerings
- Figure 4.27: USM Continuous Monitoring and Analysis
- 4.2.1. Arista
- v. Juniper Research's View: Strategic Recommendations & Key Opportunities
- 4.2.17. WatchGuard
- i. Corporate
- ii. Geographical Spread
- iii. Key Clients & Strategic Partnerships
- iv. High-level View of Offerings
- Figure 4.28: WatchGuard IntelligentAV
- v. Juniper Research's View: Strategic Recommendations & Key Opportunities
- 4.2.17. WatchGuard
- 4.3. Juniper Research Competitor Leaderboard Assessment Methodology
- 4.4. Limitations & Interpretation
- Table 4.29: Juniper Research Competitor Leaderboard Scoring Criteria - Unified Threat Management
5. Market Forecasts
- 5.1. Introduction
- 5.2. Methodology & Assumptions
- Figure 5.1: Unified Threat Management Forecast Methodology
- 5.2.1. Unified Threat Management Adoption
- Figure & Table 5.2: Total Number of Businesses Deploying UTM (m), Split by 8 Key Regions, 2023-2028
- Table 5.3: Total Number of Businesses Deploying UTM (m), Split by Business Size, 2023-2028
- 5.2.2. Unified Threat Management Spend
- Figure & Table 5.4: Total Business Spend on UTM ($m), Split by 8 Key Regions, 2023-2028
- Table 5.5: Total Business Spend on UTM ($m), Split by Business Size, 2023-2028