|
|
市場調査レポート
商品コード
1152710
精密医療:主要動向、地域別分析、市場予測 (2022年~2027年)Precision Medicine: Key Trends, Regional Analysis and Market Forecasts 2022-2027 |
||||||
|
|
|||||||


| 精密医療:主要動向、地域別分析、市場予測 (2022年~2027年) |
|
出版日: 2022年11月15日
発行: Juniper Research Ltd
ページ情報: 英文
納期: 即日から翌営業日
|
- 全表示
- 概要
- 目次
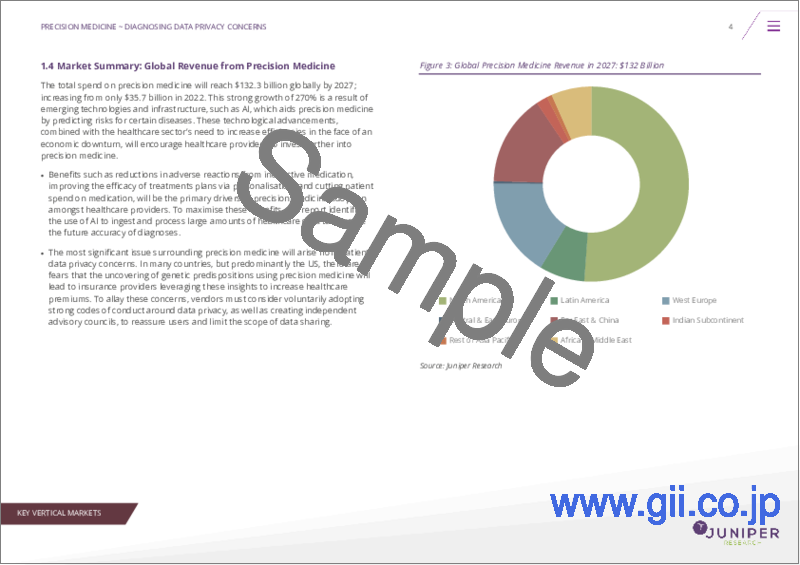
世界の精密医療への支出額は、2022年のわずか357億米ドルから増加し、2027年には1,323億米ドルに達する見込みです。この270%という力強い成長は、特定の疾患のリスクを予測することで精密医療を支援するAIなどの新たな技術やインフラがもたらした結果です。このような技術進歩と、経済不況に際して効率化を図る医療部門のニーズが相まって、医療提供者は精密医療へのさらなる投資を促すことになるでしょう。
当レポートでは、世界の精密医療の市場について分析し、システムの概略や普及状況、全体的な市場規模の動向見通し (今後5年間分)、部門別・地域別・業種別の詳細動向、市場の競争構造、今後の成長可能性と課題、主要企業のプロファイル (全15社) などを調査しております。
主要な市場統計
| 2022年の市場規模 | 357億米ドル |
| 2027年の市場規模 | 1,323億米ドル |
| 支出額の増加率 (2022年~2027年) | 270% |
分析対象企業
- Juniper Research Competitor Leaderboardの対象企業: Abbott Laboratories、Almac Group、AstraZeneca、Asuragen、Biomerieux、Bristol-Myers Squibb、Cepheid、Ge HealthCare、IBM、Illumina、LabCorp、Novartis、Qiagen、Quest Diagnostics、Thermo Fisher Scientific
- 言及された企業: DNAnexus、Dragonfly、Genomics England、GNS Healthcare、GRAIL、Interscience、Janssen、Kaiku Health、Kura Oncology、LabShares、Loxo Oncology、Lyon Civil Hospitals、Merck、Millennium Pharmaceuticals、Mirrhia、Myriad Genetics、Obsidian Therapeutics、Ono、Paige (Pathology Artificial Intelligence Guidance Engine)、Partners HealthCare、PathAI、Personal Genome Diagnostics、Pfizer、Qiagen、Roche、Shanghai Children's Medical Centre、The Max Foundation、Turning Point Therapeutics、Walmart、Wave Life Science、Wellcome Sanger Institute
目次
第1章 分析概要と戦略提言
第2章 市場の将来展望
- 精密医療のエコシステム:概要
- 精密医療の動向
- 従来型医療
- 層別化医療
- 精密医療の動向
- 精密医療の技術
- 人工知能と機械学習
- データ
- バイオマーカー
- 次世代シーケンシング
- 治療
- 免疫療法
- CAR-T細胞療法
- コンパニオン診断
- 精密医療の利点
- 消費者にとってのメリット
- 医療企業にとってのメリット
- 主要な市場促進要因の分析
- 抑制要因
第3章 地域別分析
- 地域別分析
- 北米
- 米国
- カナダ
- ラテンアメリカ
- メキシコ
- ブラジル
- 西欧
- ドイツ
- 英国
- 中東欧
- クロアチア
- トルコ
- 極東・中国
- 中国
- 韓国
- インド亜大陸
- インド
- パキスタン
- アジア太平洋
- オーストラリア
- フィリピン
- アフリカ・中東
- エジプト
- アラブ首長国連邦 (UAE)
- 北米
第4章 競合企業のリーダーボードとベンダープロファイル
- 精密医療:ベンダープロファイル
- Almac Group Ltd.
- AstraZeneca
- Asuragen
- Biomerieux
- Bristol-Myers Squibb
- Cepheid Inc
- GE HealthCare
- IBM
- Illumina
- LabCorp
- Novartis
- Qiagen
- Quest Diagnostics
- Thermo Fisher Scientific
第5章 市場予測
- イントロダクション
- 予測・調査手法
- 精密医療向け遺伝子検査の総実施件数
- 精密医療向け遺伝子検査の総費用
- 精密医療治療の総支出額
- 精密医療の総収益
REPORT OVERVIEW
Juniper Research's “Precision Medicine report” provides a detailed evaluation of the technological advancements in the field of precision medicine and demand for precision medicine, including the adoption of precision medicine within both developing markets and established markets. In addition, this report, focusing on precision medicine initiatives, covers market opportunities; providing strategic insights into the technologies and key drivers that are pushing the space forward, and the role of key market players; 15 leading precision medicine vendors across the market.
This extensive research suite covering advances in precision medicine also contains a detailed dataset; providing forecasts for 60 countries across a number of different metrics, including the number of patients being tested for precision medicine purposes, the number of genetic tests carried out for precision medicine, the total number of precision medicine patients receiving personalised treatment, the total spend on precision medicine testing and treatment and total precision medicine revenue.
This precision medicine market report research suite comprises of:
- Strategy & Forecasts (PDF)
- 5-year Market Sizing & Forecast Spreadsheet (Excel)
- 12 Months Access to harvest Online Data Platform
Key Market Statistics
| Market size in 2022: | $35.7bn |
| Market size in 2027: | $132.3bn |
| 2022 to 2027 Spend Growth: | 270% |
KEY FEATURES
- Market Dynamics: This section of the precision medicine study features strategic analysis of the major drivers, challenges, and innovations shaping the adoption and development of precision medicine, with key factors including the following market segmentation:
- COVID-19 pandemic impact on the precision medicine market
- Future strategic direction, market share and market outlook for precision medicine
- Key issues precision medicine vendors must be aware of surrounding legislation and data sharing
- Regional Analysis: A regional market-level analysis of 16 countries, spanning 8 key regions within the healthcare infrastructure; covering the current deployment level of precision medicine applications and the future outlook of precision medicine in each market.
- Key Takeaways & Strategic Recommendations: Analysis of a wide range of key development opportunities and major factors within the market for precision medicine in the healthcare industry, accompanied by key strategic recommendations for stakeholders.
- Benchmark Industry Forecasts: Investigating lucrative growth of precision medicine market size in full; including forecasts for the total number of patients taking genetic tests for precision medicine, the total number of genetic tests carried out for precision medicine, total number of precision medicine patients receiving medical treatment options and precision medicine drugs, total spend on precision medicine test and treatment, and total precision medicine revenue. This precision medicine market growth data is split by our 8 key forecast regions and 60 countries:
- North America:
- Canada, United States
- Latin America:
- Argentina, Brazil, Chile, Colombia, Ecuador, Mexico, Peru, Uruguay
- West Europe:
- Austria, Belgium, Denmark, Finland, France, Germany, Greece, Ireland, Italy, Netherlands, Norway, Portugal, Spain, Sweden, Switzerland, United Kingdom
- Central & East Europe:
- Croatia, Czech Republic, Hungary, Poland, Romania, Russia, Turkey, Ukraine
- Far East & China:
- China, Hong Kong, Japan, South Korea
- Indian Subcontinent:
- Bangladesh, India, Nepal, Pakistan
- Rest of Asia Pacific:
- Australia, Indonesia, Malaysia, New Zealand, Philippines, Singapore, Thailand, Vietnam
- Africa & Middle East:
- Algeria, Egypt, Israel, Kenya, Kuwait, Nigeria, Qatar, Saudi Arabia, South Africa, United Arab Emirates
- North America:
- Juniper Research Competitor Leaderboard: Key player capability and capacity assessment in the healthcare sector for 15 precision medicine vendors:
- Abbott Laboratories
- Almac Group Ltd
- AstraZeneca
- Asuragen Inc
- Biomérieux Sa
- Bristol-Myers Squibb
- Cepheid Inc
- Ge Healthcare
- IBM
- Illumina Inc
- Laboratory Corporation of America Holdings
- Novartis
- Qiagen
- Quest Diagnostics
- Thermo Fisher Scientific Inc.
KEY QUESTIONS ANSWERED
- 1. How will key market trends affect projected precision medicine adoption?
- 2. What technologies will accelerate precision medicine?
- 3. Who are the leading vendors in the precision medicine market?
- 4. What limitations are there holding back precision medicine?
- 5. In which regions will precision medicine be most successful?
COMPANIES REFERENCED
- Included in the Juniper Research Competitor Leaderboard: Abbott Laboratories, Almac Group, AstraZeneca, Asuragen, Biomerieux, Bristol-Myers Squibb, Cepheid, Ge HealthCare, IBM, Illumina, LabCorp, Novartis, Qiagen, Quest Diagnostics, Thermo Fisher Scientific.
- Mentioned: DNAnexus, Dragonfly, Genomics England, GNS Healthcare, GRAIL, Interscience, Janssen, Kaiku Health, Kura Oncology, LabShares, Loxo Oncology, Lyon Civil Hospitals, Merck, Millennium Pharmaceuticals, Mirrhia, Myriad Genetics, Obsidian Therapeutics, Ono, Paige (Pathology Artificial Intelligence Guidance Engine), Partners HealthCare, PathAI, Personal Genome Diagnostics, Pfizer, Qiagen, Roche, Shanghai Children's Medical Centre, The Max Foundation, Turning Point Therapeutics, Walmart, Wave Life Science, Wellcome Sanger Institute.
DATA & INTERACTIVE FORECAST
Key Market Forecast Splits
- Diagnosis
- Treatment
Metrics including the number of precision medicine patients, number of genetic tests carried out for precision medicine, total number of precision medicine patients receiving treatment, total spend on precision medicine test and treatment and total precision medicine revenue.
- Geographical splits: 60 countries
- Number of tables: Over 18 tables
- Number of datapoints: Over 12,000 datapoints
harvest: Our online data platform, harvest, contains the very latest market data and is updated throughout the year. This is a fully featured platform enabling clients to better understand key data trends and manipulate charts and tables; overlaying different forecasts within the one chart - using the comparison tool. Empower your business with our market intelligence centre, and receive alerts whenever your data is updated.
Interactive Excels (Ifxl): Our Ifxl tool enables clients to manipulate both forecast data and charts, within an Excel environment, to test their own assumptions using the interactive scenario tool and compare selected markets side by side in customised charts and tables. Ifxls greatly increase a client's ability to both understand a particular market and to integrate their own views into the model.
FORECAST SUMMARY
The total spend on precision medicine will reach $132.3 billion globally by 2027; increasing from only $35.7 billion in 2022. This strong growth of 270% is a result of emerging technologies and infrastructure, such as AI, which aids precision medicine by predicting risks for certain diseases. These technological advancements, combined with the healthcare sector's need to increase efficiencies in the face of an economic downturn, will encourage healthcare providers to invest further into precision medicine.
- Benefits such as reductions in adverse reactions from ineffective medication, improving the efficacy of treatments plans via personalisation, and cutting patient spend on medication, will be the primary drivers of precision medicine adoption amongst healthcare providers. To maximise these benefits, the report identified the use of AI to ingest and process large amounts of healthcare data to increase the future accuracy of diagnoses.
- The most significant issue surrounding precision medicine will arise from patient data privacy concerns. In many countries, but predominantly the US, there are fears that the uncovering of genetic predispositions using precision medicine will lead to insurance providers leveraging these insights to increase healthcare premiums. To allay these concerns, vendors must consider voluntarily adopting strong codes of conduct around data privacy, as well as creating independent advisory councils, to reassure users and limit the scope of data sharing.
Table of Contents
1. Key Takeaways & Strategic Recommendations
- 1.1. Key Takeaways & Strategic Recommendations
- 1.2. Strategic Recommendations
2. Future Market Outlook
- 2.1. Overview of the Precision Medicine Ecosystem
- Figure 2.1: Diagram Displaying Process of Precision Medicine
- 2.1.1. Development of Precision Medicine
- i. Traditional Medicine
- ii. Stratified Medicine
- 2.2. Technology in Precision Medicine
- Figure 2.2: Diagram Displaying Stakeholders Involved in Precision Medicine
- 2.2.1. Artificial Intelligence and Machine Learning
- 2.2.2. Data
- 2.2.3. Biomarkers
- 2.2.4. Next-generation Sequencing
- 2.3. Treatment
- 2.3.1. Immunotherapies
- 2.3.2. CAR T Cell Therapies
- 2.3.3. Companion Diagnostics
- 2.4. Benefits of Precision Medicine
- 2.4.1. Benefits for Consumers
- i. Time Saving
- ii. Prevention of Adverse Reactions
- iii. Cost Saving
- 2.4.2. Benefits for Healthcare Corporates
- i. Shift from Reaction to Prevention
- ii. Reduction in Trial-and-Error Prescribing
- iii. Increase in the Healthcare Database
- iv. Improve Patient Adherence to Treatment
- 2.4.1. Benefits for Consumers
- 2.5. Exploration of Key Market Drivers
- 2.6. Limitations
3. Regional Analysis
- 3.1. Regional Analysis
- 3.1.1. North America
- i. US
- ii. Canada
- 3.1.2. Latin America
- i. Mexico
- ii. Brazil
- 3.1.3. West Europe
- i. Germany
- ii. UK
- 3.1.4. East & Central Europe
- i. Croatia
- ii. Turkey
- 3.1.5. Far East & China
- i. China
- ii. South Korea
- 3.1.6. Indian Subcontinent
- i. India
- ii. Pakistan
- 3.1.7. Asia Pacific
- i. Australia
- ii. Philippines
- 3.1.8. Africa & Middle East
- i. Egypt
- ii. United Arab Emirates
- 3.1.1. North America
4. Competitor Leaderboard and Vendor Profiles
- Table 4.1: Juniper Research Competitor Leaderboard: Precision Medicine Vendors Included & Product Portfolio
- Figure 4.2: Juniper Research Leaderboard: Precision Medicine Vendors
- Table 4.3: Juniper Research Leaderboard: Precision Medicine Vendors & Positioning
- Table 4.4: Juniper Research Leaderboard Heatmap: Precision Medicine
- 4.1. Precision Medicine - Vendor Profiles
- 4.1.1. Abbott Laboratories
- i. Corporate
- Table 4.5: Abbott Laboratories' Financial Snapshot ($m), FY 2019-2021 (FYE 31st December)
- ii. Geographical Spread
- iii. Key Clients and Partnerships
- iv. High-level View of Offerings
- v. Juniper Research's View: Key Strengths & Strategic Development Opportunities
- i. Corporate
- 4.1.2. Almac Group Ltd.
- i. Corporate
- ii. Geographical Spread
- iii. Key Clients and Partnerships
- iv. High-level View of Offerings
- v. Juniper Research's View: Key Strengths & Strategic Development Opportunities
- 4.1.3. AstraZeneca
- i. Corporate
- Table 4.6: AstraZeneca's Financial Snapshot ($b), FY 2019-2021 (FYE 31st December)
- ii. Geographical Spread
- iii. Key Clients and Partnerships
- iv. High-level View of Offerings
- v. Juniper Research's View: Key Strengths & Strategic Development Opportunities
- i. Corporate
- 4.1.4. Asuragen
- i. Corporate
- ii. Geographical Spread
- iii. Key Clients & Partnerships
- iv. High-level View of Offerings
- v. Juniper Research's View: Key Strengths & Strategic Development Opportunities
- 4.1.5. Biomerieux
- i. Corporate
- ii. Geographical Spread
- iii. Key Clients and Partnerships
- iv. High-level View of Offerings
- v. Juniper Research's View: Key Strengths & Strategic Development Opportunities
- 4.1.6. Bristol-Myers Squibb
- i. Corporate
- Table4.7: Bristol-Myers Squibb's Financial Snapshot ($b), FY 2019-2021 (FYE 31st December)
- ii. Geographical Spread
- iii. Key Clients and Partnerships
- iv. High-level View of Offerings
- v. Juniper Research's View: Key Strengths & Strategic Development Opportunities
- i. Corporate
- 4.1.7. Cepheid Inc
- i. Corporate
- ii. Geographical Spread
- iii. Key Clients & Partnerships
- iv. High-level View of Offerings
- v. Juniper Research's View: Key Strengths & Strategic Development Opportunities
- 4.1.8. GE HealthCare
- i. Corporate
- Table 4.8: GE HealthCare's Financial Snapshot ($b), FY 2019-2021 (FYE 31st December)
- ii. Geographical Spread
- iii. Key Clients & Partnerships
- iv. High-level View of Offerings
- v. Juniper Research's View: Key Strengths & Strategic Development Opportunities
- i. Corporate
- 4.1.9. IBM
- i. Corporate
- Table 4.9: IBM's Financial Snapshot ($b), FY 2019-2021 (FYE 31st December)
- ii. Geographical Spread
- iii. Key Clients and Partnerships
- iv. High-level View of Offerings
- v. Juniper Research's View: Key Strengths & Strategic Development Opportunities
- i. Corporate
- 4.1.10. Illumina
- i. Corporate
- Table 4.10: Illumina's Financial Snapshot ($b), FY 2021-2022
- ii. Geographical Spread
- iii. Key Clients & Partnerships
- iv. High-level View of Offerings
- v. Juniper Research's View: Key Strengths & Strategic Development Opportunities
- i. Corporate
- 4.1.11. LabCorp
- i. Corporate
- Table 4.11: LabCorp's Financial Snapshot ($b), FY 2020-2021
- ii. Geographical Spread
- iii. Key Clients and Partnerships
- iv. High-level View of Offerings
- v. Juniper Research's View: Key Strengths & Strategic Development Opportunities
- i. Corporate
- 4.1.12. Novartis
- i. Corporate
- Table 4.12: Novartis' Financial Snapshot ($b), FY 2020-2021
- ii. Geographical Spread
- iii. Key Clients and Partnerships
- iv. High-level View of Offerings
- v. Juniper Research's View: Key Strengths & Strategic Development Opportunities
- i. Corporate
- 4.1.13. Qiagen
- i. Corporate
- ii. Geographical Spread
- iii. Key Clients & Partnerships
- iv. High-level View of Offerings
- v. Juniper Research's View: Key Strengths & Strategic Development Opportunities
- 4.1.14. Quest Diagnostics
- i. Corporate
- Table 4.13: Quest Diagnostics' Financial Snapshot ($b), FY 2020-2021
- ii. Geographical Spread
- iii. Key Clients and Partnerships
- iv. High-level View of Offerings
- Figure 4.14: Diagram Displaying Quest Diagnostics' Companion Diagnostics Development
- v. Juniper Research's View: Key Strengths & Strategic Development Opportunities
- i. Corporate
- 4.1.15. Thermo Fisher Scientific
- i. Corporate
- ii. Geographical Spread
- iii. Key Clients and Partnerships
- iv. High-level View of Offerings
- Figure 4.15: Thermo Fishers Scientific Pharmacogenomics
- v. Juniper Research's View: Key Strengths & Strategic Development Opportunities
- Table 4.16: Juniper Research Competitor Leaderboard Scoring Criteria
- 4.1.1. Abbott Laboratories
5. Market Forecasts
- 5.1. Introduction
- 5.1.1. Precision Medicine Forecast Methodology
- Figure 5.1: Precision Medicine Revenue Methodology
- 5.1.2. Total Number of Precision Medicine Genetic Tests
- Figure & Table 5.2: Total Precision Medicine Genetic Tests, Split by 8 Key Regions, 2022-2027
- 5.1.3. Total Spend on Genetic Testing for Precision Medicine
- Figure & Table 5.3: Total Spend on Genetic Testing for Precision Medicine ($m), Split by 8 Key Regions, 2022-2027
- 5.1.4. Total Spend on Precision Medicine Treatment
- Figure & Table 5.4: Total Spend on Precision Medicine Treatment ($m), Split by Key Regions, 2022-2027
- 5.1.5. Total Precision Medicine Revenue
- Figure 5.5: Total Precision Medicine Revenue ($m), Split by 8 Key Regions, 2022-2027
- 5.1.1. Precision Medicine Forecast Methodology