|
|
市場調査レポート
商品コード
1134406
オンライン薬局 (ePharmacy):主要動向、地域別分析、市場予測 (2022年~2027年)ePharmacy: Key Trends, Regional Analysis and Market Forecasts 2022-2027 |
||||||
|
|
|||||||


| オンライン薬局 (ePharmacy):主要動向、地域別分析、市場予測 (2022年~2027年) |
|
出版日: 2022年10月10日
発行: Juniper Research Ltd
ページ情報: 英文
納期: 即日から翌営業日
|
- 全表示
- 概要
- 目次
オンライン薬局のユーザー数は、2022年の7億9,500万人から2027年までに全世界で10億人に達し、28%の成長を遂げると予想されています。この増加は、COVID-19の大流行により、消費者が家から出られなくなり、オンライン薬局を通じて薬を受け取るようになったことから、導入が急増した結果であると考えられています。ベンダー各社は、オンライン薬局が提供する効率性と簡便性に磨きをかけ、顧客基盤の維持・拡大に注力しており、今後も成長が続くと思われます。
- 消費者は、オンライン薬局が提供する手頃な価格の薬や、実店舗の薬局と比較した幅広い選択肢などの利点を認識し、オンライン薬局の利用を継続すると思われます。
- オンライン薬局の成長は、オンライン手続きを簡素化することで維持されるでしょう。これは、電子処方箋がより広く受け入れられることで、処方箋の紙媒体をなくすことで実現できます。
- オンライン薬局サービスは、引き続きOTC (Over-the-Counter) 薬で多く利用されると思われます。2027年のOTC取引件数は世界全体で89億件に達し、世界全体の取引額の64%を占めると予想されます。一方、世界の処方箋の取引件数は50億件となっています。処方箋のデジタル化は、配達の正確さ、タイミング、配達漏れなどに関する消費者の懸念から、遅れをとることになるでしょう。こうした懸念を払拭し、違法なオンライン薬局の増加を相殺するために、オンライン薬局に対するリアルタイムの追跡と規制の強化は、将来の成長を確保するための優先事項であるべきです。
当レポートでは、世界のオンライン薬局 (ePharmacy) の市場について分析し、市場の基本構造や先進国/新興国での普及状況、主な市場促進要因、全体的な市場規模の動向見通し (ユーザー数・取引件数・取引金額、今後5年間分)、部門別 (処方薬、OTC)・地域別 (全60ヶ国) の詳細動向、市場の競争構造、今後の成長可能性と課題、主要企業のプロファイル (全15社) などを調査しております。
回答した主な質問
- 1. 主要な市場動向は、オンライン薬局にどのような影響を与えるか?
- 2. オンライン薬局は、OTC (市販薬) と処方薬でどのように違うのか?
- 3. オンライン薬局市場の主要ベンダーはどこか?
- 4. オンライン薬局を妨げている抑制要因は何か?
- 5. オンライン薬局が最も成功するのはどの地域か?
主な特徴
- ベンチマーク業界予測: 地域別 (全8地域)、国別 (全60ヶ国)
- 北米
- カナダ、米国
- ラテンアメリカ
- アルゼンチン、ブラジル、チリ、コロンビア、エクアドル、メキシコ、ペルー、ウルグアイ
- 西欧
- オーストリア、ベルギー、デンマーク、フィンランド、フランス、ドイツ、ギリシャ、アイルランド、イタリア、オランダ、ノルウェー、ポルトガル、スペイン、スウェーデン、スイス、英国
- 中東欧
- クロアチア、チェコ、ハンガリー、ポーランド、ルーマニア、ロシア、トルコ、ウクライナ
- 極東・中国
- 中国、香港、日本、韓国
- インド亜大陸
- バングラデシュ、インド、ネパール、パキスタン
- 他のアジア太平洋諸国
- オーストラリア、インドネシア、マレーシア、ニュージーランド、フィリピン、シンガポール、タイ、ベトナム
- アフリカ・中東
- アルジェリア、エジプト、イスラエル、ケニア、クウェート、ナイジェリア、カタール、サウジアラビア、南アフリカ、アラブ首長国連邦
- 北米
分析対象企業
- Juniper Research Competitor Leaderboardの対象企業:1mg、Amazon Pharmacy、Apollo Pharmacy、CVS Health、DocMorris、Express Scripts、Giant Eagle、Lloyds Pharmacy、Netmeds、Optum、Rowlands Pharmacy、The Kroger、Walgreens Boots Alliance、Walmart、Well Pharmacy
- 言及された企業:Accredo、Adipositas Care、Adobe、Aetna、Bajaj Allianz、Bakers、Berkshire Hathaway、Blue Cross Blue Shield、Braze、CareCentrix、CareContinum、CareZone、Chefaa、City Market Food and Pharmacy、Copps、CuraScriptSD、Deliveroo、Ecrebo、Epic、Evicore Healthcare、Famhealth、FredMeyer、Freedom Fertility Pharmacy、Frys、HasHealth、Haven、HDFC、Horizon、ICICI Bank、Inside Rx、JPMorgan Chase、KiviHealth、Lazada Philippines、Lyf、Mamajan Imaging、Max Bupa、MedAvail、Medbase、Mesmerize、Microsoft、MyMatrixx、NCotably、Novo Nordisk、Omnicell、Onofre、Patanjali、PathCare、PAYBACK、PillPack、Practio、Prime Therapeutics、Raia Drogasil SA、SBI、Shopee Philippines、Signify Health、Target Pharmacies、Tata Digital、TeleClinic、Thyrocare、Verizon、Willons、Yodawy、ZEE5、Zur Rose Group.
目次
第1章 分析概要と戦略提言
第2章 現状と今後の展望
- オンライン薬局のエコシステム:概要
- オンライン薬局の種類
- デジタル専用ストア
- 実店舗のデジタルツイン
- 電子処方箋
- オンライン薬局の種類
- オンライン薬局の利点
- 消費者にとってのメリット
- 時間節約
- コスト削減
- 効率
- パーソナライゼーション
- 選択の範囲
- 企業にとっての利点
- 時間の節約
- 利益の最大化
- 政府にとっての利点
- 消費者にとってのメリット
- 主要な市場促進要因の分析
- 抑制要因
第3章 地域分析
- 地域分析
- 北米
- 米国
- カナダ
- ラテンアメリカ
- メキシコ
- ブラジル
- 西欧
- ドイツ
- 英国
- 中東欧
- ポーランド
- トルコ
- 極東・中国
- 中国
- 韓国
- インド亜大陸
- インド
- パキスタン
- アジア太平洋
- オーストラリア
- フィリピン
- アフリカ・中東
- エジプト
- アラブ首長国連邦
- 北米
第4章 競合企業のリーダーボードとベンダープロファイル
- オンライン薬局:ベンダープロファイル
- 1mg
- 企業
- 進出地域
- 主要なクライアントとパートナーシップ
- 高レベルの製品/サービス
- JuniperResearchの見解:主な強みと戦略展開の機会
- Amazon Pharmacy
- Apollo Pharmacy
- CVS Pharmacy
- DocMorris
- Express Scripts
- Giant Eagle
- Lloyds Pharmacy
- Netmeds
- Optum
- Rowlands Pharmacy
- The Kroger
- Walgreens Boots Alliance
- Walmart
- Well Pharmacy
- 1mg
第5章 市場予測
- イントロダクション
- オンライン薬局の処方薬:予測調査手法
- オンライン薬局のOTC (市販薬):予測調査手法
- オンライン薬局の取引総数
- オンライン薬局の取引総額
- オンライン薬局の総収益
Juniper Research's “ePharmacy” report provides a detailed evaluation of the market, including the adoption of ePharmacy within both developing and established markets. In addition, this report covers market opportunities; providing strategic insights into the technologies and key drivers that are pushing the space forward, and the role of 15 leading ePharmacy vendors across the market.
The research suite also contains a detailed dataset; providing forecasts for 60 countries across a number of different metrics, including the number of ePharmacy users, number of ePharmacy transactions, number of OTC (Over the Counter) and prescription transactions through ePharmacy and total ePharmacy revenue.
This research suite comprises of:
- Strategy & Forecasts (PDF)
- 5-year Market Sizing & Forecast Spreadsheet (Excel)
- 12 Months Access to harvest Online Data Platform
KEY FEATURES
- Market Dynamics: A strategic analysis of the major drivers, challenges, and innovations shaping the adoption and development of ePharmacy technologies, including the following:
- COVID-19 impact on the ePharmacy market
- Future strategic direction and market outlook for ePharmacy
- Key issues ePharmacy vendors must be aware of surrounding legislation and data sharing
- Regional Analysis: A regional-level analysis of 16 countries, spanning 8 key regions; covering the current deployment level and future outlook of ePharmacy in each market.
- Key Takeaways & Strategic Recommendations: Analysis of key development opportunities within ePharmacies, accompanied by key strategic recommendations for stakeholders.
- Benchmark Industry Forecasts: Includes forecasts for total number of ePharmacy users, total annual spend on ePharmacy, total fee revenue from ePharmacy, total transaction value from ePharmacy. Total number of transactions and revenue split by OTC and prescription medication. This data is split by our 8 key forecast regions and 60 countries:
- North America:
- Canada, US
- Latin America:
- Argentina, Brazil, Chile, Colombia, Ecuador, Mexico, Peru, Uruguay
- West Europe:
- Austria, Belgium, Denmark, Finland, France, Germany, Greece, Ireland, Italy, Netherlands, Norway, Portugal, Spain, Sweden, Switzerland, UK
- Central & East Europe:
- Croatia, Czech Republic, Hungary, Poland, Romania, Russia, Turkey, Ukraine
- Far East & China:
- China, Hong Kong, Japan, South Korea
- Indian Subcontinent:
- Bangladesh, India, Nepal, Pakistan
- Rest of Asia Pacific:
- Australia, Indonesia, Malaysia, New Zealand, Philippines, Singapore, Thailand, Vietnam
- Africa & Middle East:
- Algeria, Egypt, Israel, Kenya, Kuwait, Nigeria, Qatar, Saudi Arabia, South Africa, United Arab Emirates
- North America:
- Juniper Research Competitor Leaderboard: Key player capability and capacity assessment for 15 ePharmacy vendors:
- 1mg
- Amazon Pharmacy
- Apollo Pharmacy
- CVS Health
- DocMorris
- Express Scripts
- Giant Eagle Pharmacy
- Kroger
- Lloyds Pharmacy
- Netmeds
- Optum
- Rowlands Pharmacy
- Walgreens Boots Alliance
- Walmart
- Well Pharmacy
KEY QUESTIONS ANSWERED
- 1. How will key market trends affect ePharmacy?
- 2. How will ePharmacy differ for over-the-counter and prescription medication?
- 3. Who are the leading vendors in the ePharmacy market?
- 4. What limitations are holding back ePharmacy?
- 5. What regions will ePharmacy be most successful in?
COMPANIES REFERENCED
- Included in the Juniper Research Competitor Leaderboard: 1mg, Amazon Pharmacy, Apollo Pharmacy, CVS Health, DocMorris, Express Scripts, Giant Eagle, Lloyds Pharmacy, Netmeds, Optum, Rowlands Pharmacy, The Kroger, Walgreens Boots Alliance, Walmart, Well Pharmacy.
- Mentioned: Accredo, Adipositas Care, Adobe, Aetna, Bajaj Allianz, Bakers, Berkshire Hathaway, Blue Cross Blue Shield, Braze, CareCentrix, CareContinum, CareZone, Chefaa, City Market Food and Pharmacy, Copps, CuraScriptSD, Deliveroo, Ecrebo, Epic, Evicore Healthcare, Famhealth, FredMeyer, Freedom Fertility Pharmacy, Frys, HasHealth, Haven, HDFC, Horizon, ICICI Bank, Inside Rx, JPMorgan Chase, KiviHealth, Lazada Philippines, Lyf, Mamajan Imaging, Max Bupa, MedAvail, Medbase, Mesmerize, Microsoft, MyMatrixx, NCotably, Novo Nordisk, Omnicell, Onofre, Patanjali, PathCare, PAYBACK, PillPack, Practio, Prime Therapeutics, Raia Drogasil SA, SBI, Shopee Philippines, Signify Health, Target Pharmacies, Tata Digital, TeleClinic, Thyrocare, Verizon, Willons, Yodawy, ZEE5, Zur Rose Group.
DATA & INTERACTIVE FORECAST
Juniper Research's “ePharmacy” forecast suite includes:
- Prescription Medication
- Over-the-Counter Medication
Metrics including total number of transactions completed through ePharmacy, total annual spend on ePharmacy, total revenue through ePharmacy transactions, total revenue through ePharmacy fees, split by OTC and prescription medication.
- Geographical splits: 60 countries
- Number of tables: Over 31 tables
- Number of datapoints: Over 23,500 datapoints
- harvest: Our online data platform, harvest, contains the very latest market data and is updated throughout the year. This is a fully featured platform enabling clients to better understand key data trends and manipulate charts and tables; overlaying different forecasts within the one chart - using the comparison tool. Empower your business with our market intelligence centre, and receive alerts whenever your data is updated.
- Interactive Excels (IFxl): Our IFxl tool enables clients to manipulate both forecast data and charts, within an Excel environment, to test their own assumptions using the interactive scenario tool and compare selected markets side by side in customised charts and tables. IFxls greatly increase a client's ability to both understand a particular market and to integrate their own views into the model.
FORECAST SUMMARY
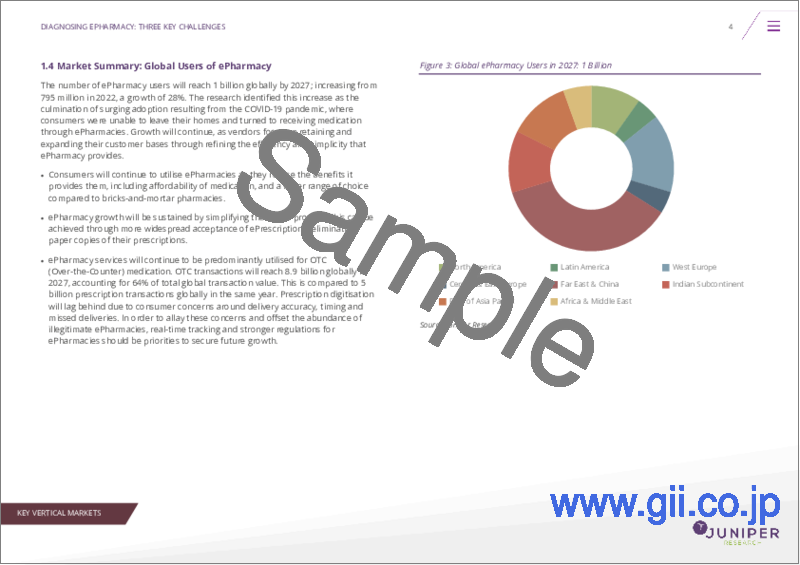
The number of ePharmacy users will reach 1 billion globally by 2027; increasing from 795 million in 2022, a growth of 28%. The research identified this increase as the culmination of surging adoption resulting from the COVID-19 pandemic, where consumers were unable to leave their homes and turned to receiving medication through ePharmacies. Growth will continue, as vendors focus on retaining and expanding their customer bases through refining the efficiency and simplicity that ePharmacy provides.
- Consumers will continue to utilise ePharmacies as they realise the benefits it provides them, including affordability of medication, and a wider range of choice compared to bricks-and-mortar pharmacies.
- ePharmacy growth will be sustained by simplifying the online process. This can be achieved through more widespread acceptance of ePrescriptions; eliminating paper copies of their prescriptions.
- ePharmacy services will continue to be predominantly utilised for OTC (Over-the-Counter) medication. OTC transactions will reach 8.9 billion globally in 2027, accounting for 64% of total global transaction value. This is compared to 5 billion prescription transactions globally in the same year. Prescription digitisation will lag behind due to consumer concerns around delivery accuracy, timing and missed deliveries. In order to allay these concerns and offset the abundance of illegitimate ePharmacies, real-time tracking and stronger regulations for ePharmacies should be priorities to secure future growth.
Table of Contents
1. Key Takeaways & Strategic Recommendations
- 1.1. Key Takeaways & Strategic Recommendations
- 1.2. Strategic Recommendations
2. Current Status & Future Outlook
- 2.1. Overview of ePharmacy Ecosystem
- Figure 2.1: Visualisation Showing ePharmacy Stages
- 2.1.1. Types of ePharmacy
- i. Digital-only Stores
- ii. Digital Twin of Bricks-and-Mortar
- 2.1.2. ePrescribing
- Figure 2.2: Visualisation of ePrescribing
- 2.2. Benefits of ePharmacy
- 2.2.1. Benefits for Consumers
- i. Time Saving
- ii. Cost Savings
- iii. Efficiency
- iv. Personalisation
- v. Range of Choice
- 2.2.2. Benefits for Corporations
- i. Time Saving
- ii. Maximise Profit Margin
- Figure 2.3: Visualisation Showing Benefits for Corporates
- iii. Benefits for Governments
- 2.2.1. Benefits for Consumers
- 2.3. Exploration of Key Market Drivers
- 2.4. Limitations
3. Regional Analysis
- 3.1. Regional Analysis
- 3.1.1. North America
- i. US
- ii. Canada
- 3.1.2. Latin America
- i. Mexico
- ii. Brazil
- 3.1.3. West Europe
- i. Germany
- ii. UK
- 3.1.4. East & Central Europe
- i. Poland
- ii. Turkey
- 3.1.5. Far East & China
- i. China
- ii. South Korea
- 3.1.6. Indian Subcontinent
- i. India
- ii. Pakistan
- 3.1.7. Asia Pacific
- i. Australia
- ii. Philippines
- 3.1.8. Africa & Middle East
- i. Egypt
- ii. United Arab Emirates
- 3.1.1. North America
4. Competitor Leaderboard and Vendor Profiles
- Table 4.1: Juniper Research Competitor Leaderboard: ePharmacy Vendors Included & Product Portfolio
- Figure 4.2: Juniper Research Leaderboard: ePharmacy Vendors
- Table 4.3: Juniper Research Leaderboard: ePharmacy Vendors & Positioning
- Table 4.4: Juniper Research Leaderboard Heatmap: ePharmacy Vendors
- 4.1. ePharmacy - Vendor Profiles
- 4.1.1. 1mg
- i. Corporate Information
- ii. Geographical Spread
- iii. Key Clients and Partnerships
- iv. High-Level of Offerings
- v. Juniper Research's View: Key Strengths & Strategic Development Opportunities
- 4.1.2. Amazon Pharmacy
- i. Corporate Information
- Table 4.5: Amazon's Select Financial Information ($bn), FY2019-2021 (FYE 31st December)
- ii. Geographical Spread
- iii. Key Clients and Partnerships
- iv. High-Level of Offerings
- v. Juniper Research's View: Key Strengths & Strategic Development Opportunities
- i. Corporate Information
- 4.1.3. Apollo Pharmacy
- i. Corporate Information
- ii. Geographical Spread
- iii. Key Clients and Partnerships
- iv. High-Level of Offerings
- v. Juniper Research's View: Key Strengths & Strategic Development Opportunities
- 4.1.4. CVS Pharmacy
- i. Corporate Information
- Table 4.6: CVS Health Corporation's Select Financial Information ($bn), FY 2019-2021 (FYE 31st December)
- ii. Geographical Spread
- iii. Key Clients and Partnerships
- iv. High-level of Offerings
- v. Juniper Research's View: Key Strengths & Strategic Development Opportunities
- i. Corporate Information
- 4.1.5. DocMorris
- i. Corporate Information
- Table 4.7: Zur Rose's Select Financial Information ($bn), FY 2019-2021 (FYE 31st December)
- ii. Geographical Spread
- iii. Key Clients and Partnerships
- iv. High-Level View of Offerings
- v. Juniper Research's View: Key Strengths & Strategic Development Opportunities
- i. Corporate Information
- 4.1.6. Express Scripts
- i. Corporate Information
- ii. Geographical Spread
- iii. Key Clients and Partnerships
- iv. High-level of Offerings
- v. Juniper Research's View: Key Strengths & Strategic Development Opportunities
- 4.1.7. Giant Eagle
- i. Corporate Information
- ii. Geographical Spread
- iii. Key Clients and Partnerships
- iv. High-Level of Offerings
- v. Juniper Research's View: Key Strengths & Strategic Development Opportunities
- 4.1.8. Lloyds Pharmacy
- i. Corporate Information
- ii. Geographical Spread
- iii. Key Clients and Partnerships
- iv. High-level of Offerings
- Figure 4.8: Visualisation of Lloyds Direct App
- v. Juniper Research's View: Key Strengths & Strategic Development Opportunities
- 4.1.9. Netmeds
- i. Corporate Information
- ii. Geographical Spread
- iii. Key Clients and Partnerships
- iv. High-level of Offerings
- v. Juniper Research's View: Key Strengths & Strategic Development Opportunities
- 4.1.10. Optum
- i. Corporate Information
- ii. Geographical Spread
- iii. Key Clients and Partnerships
- iv. High-Level of Offerings
- v. Juniper Research's View: Key Strengths & Strategic Development Opportunities
- 4.1.11. Rowlands Pharmacy
- i. Corporate Information
- ii. Geographical Spread
- iii. Key Clients and Partnerships
- iv. High-Level of Offerings
- Figure 4.9: Rowlands Pharmacy Hey Pharmacist
- v. Juniper Research's View: Key Strengths & Strategic Development Opportunities
- 4.1.12. The Kroger
- i. Corporate Information
- Table 4.10: Kroger's Select Financial Information ($bn), FY2020-2022 (FYE 31st January)
- ii. Geographical Spread
- iii. Key Clients and Partnerships
- iv. High-Level of Offerings
- v. Juniper Research's View: Key Strengths & Strategic Development Opportunities
- i. Corporate Information
- 4.1.13. Walgreens Boots Alliance
- i. Corporate Information
- Table 4.11: Walgreens Boots Alliance's Select Financial Information ($bn), FY2019-2021 (FYE 30th August)
- ii. Geographical Spread
- iii. Key Clients and Partnerships
- iv. High-level of Offerings
- v. Juniper Research's View: Key Strengths & Strategic Development Opportunities
- i. Corporate Information
- 4.1.14. Walmart
- i. Corporate Information
- Table 4.12: Walmart's Select Financial Information ($bn), FY 2020-2022 (FYE 31st January)
- ii. Geographical Spread
- iii. Key Clients and Partnerships
- iv. High-level of Offerings
- v. Juniper Research's View: Key Strengths & Strategic Development Opportunities
- i. Corporate Information
- 4.1.15. Well Pharmacy
- i. Corporate Information
- ii. Geographical Spread
- iii. Key Clients and Partnerships
- iv. High-level of Offerings
- v. Juniper Research's View: Key Strengths & Strategic Development Opportunities
- Table 4.13: Juniper Research Competitor Leaderboard Scoring Criteria
- 4.1.1. 1mg
5. Market Forecasts
- 5.1. Introduction
- 5.1.1. ePharmacy Prescription Forecast Methodology
- 5.1.2. ePharmacy OTC Forecast Methodology
- Figure 5.1: ePharmacy Prescription Revenue Methodology
- Figure 5.2: ePharmacy OTC Revenue Methodology
- 5.1.3. Total ePharmacy Transactions
- Figure & Table 5.3: Total ePharmacy Transactions (m), Split by 8 Key Regions, 2022-2027
- Table 5.4: Total ePharmacy Transactions, Split by Prescription and OTC Medication
- 5.1.4. Total ePharmacy Transaction Value
- Figure & Table 5.5: Total ePharmacy Transaction Value ($m), Split by 8 Key Regions, 2022-2027
- Table 5.6: Total ePharmacy Transaction Value, Split by Prescription and OTC Medication
- 5.1.5. Total ePharmacy Revenue
- Figure & Table 5.7: Total ePharmacy Revenue ($m), Split by 8 Key Regions, 2022-2027
- Table 5.8: Total ePharmacy Revenue ($m), Split by Prescription and OTC Medication