|
|
市場調査レポート
商品コード
1118066
NFTの世界市場:将来の機会、セグメント分析、市場予測(2022年~2027年)NFTs: Future Opportunities, Segment Analysis & Market Forecasts 2022-2027 |
||||||
|
|
|||||||


| NFTの世界市場:将来の機会、セグメント分析、市場予測(2022年~2027年) |
|
出版日: 2022年08月22日
発行: Juniper Research Ltd
ページ情報: 英文
納期: 即日から翌営業日
|
- 全表示
- 概要
- 目次
当レポートでは、世界のNFT市場について調査分析し、市場情勢、セグメント分析、ベンダーケーススタディ、市場予測などを提供しています。
目次
第1章 重要事項と戦略的推奨事項
- 重要事項
- 戦略的推奨事項
第2章 市場情勢
- イントロダクション
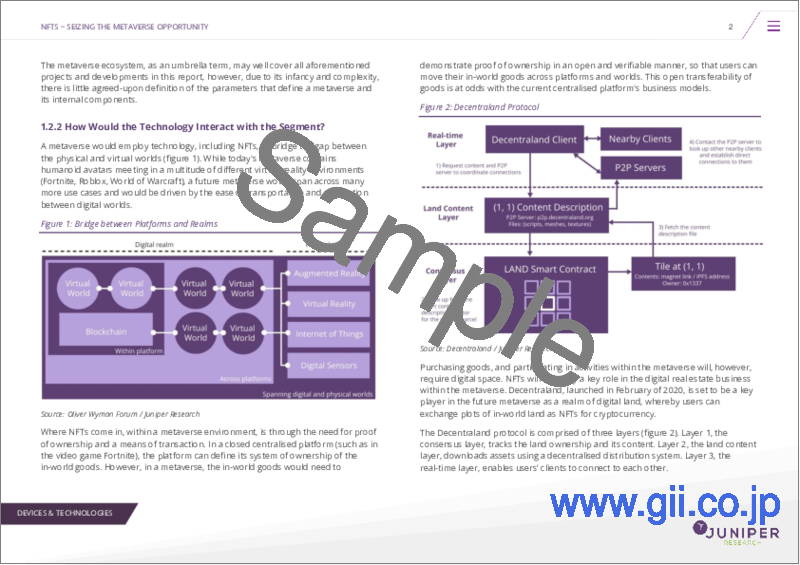
- NFTとは
- NFTの歴史
- NFTインターネット
- NFTの作成
- NFT空間に関与する技術
- ブロックチェーン
- スマートコントラクト
- DAO(分散型自律組織)
- Web3.0
- プロトコル
- トークン基準
- イーサリアム2.0
- 市場促進要因と機会
- 促進要因
- i. 有名人の文化と支援
- ii. 大馬鹿理論
- iii. P2E(Play-to-Earn)
- iv. パートナーシップとブランディング
- 機会
- i. ゲーム業界の増補
- ii. 仮想イベントへの価値の付加
- iii. デジタル収集品の保護
- iv. メタバースの構築
- 促進要因
- 市場の課題と懸念
- 課題
- i. 環境問題
- ii. 高いガス価格
- iii. ビットコインの影響
- 懸念
- i. 資金洗浄
- ii. 詐欺
- iii. 所有権と著作権
- iv. 規制
- 課題
第3章 セグメント分析と将来の動向
- 主要セグメントと将来の動向
- 美術
- 収集品
- ファッション
- ゲーム
- メタバース
- 音楽
- 不動産
第4章 ベンダーのケーススタディ
第5章 市場予測と重要事項
- NFT:市場予測
- クロスインパクトシナリオ
- 低影響シナリオ
- 中影響シナリオ
- 高影響シナリオ
Juniper Research's “NFTs (Non-fungible Tokens) ” research provides a highly detailed evaluation of current industry developments, including emerging Web 3.0 use cases, and analyses the most influential drivers and challenges that stakeholders may face over the coming years.
The research also outlines the technical mechanics behind the implementation of NFTs across 7 key segments - outlining the business cases, revenue models, and target audiences that are driving the market using models and case studies. These segments are:
- Art
- Collectables
- Fashion
- Gaming
- Metaverse
- Music
- Real Estate
It also includes 5-year scenario-based forecasts that model the total number of NFT users and transactions across these segments via three different outcome-based scenarios. Each of these scenarios accounts for a multitude of factors and potential outcomes, evaluates the likelihood of their occurrence, and delivers an output based on the underlying assumptions.
This research suite comprises:
- Strategy & Forecasts (PDF)
- 5-year Market Sizing & Forecast Spreadsheet (Excel)
- 12 Months' Access to harvest Online Data Platform
KEY FEATURES
- Market Landscape: Detailed assessment of how key NFT technologies function and interact with differing industry requirements. It also includes an analysis of trends that stand to influence the future NFT market, including environmental concerns, regulatory action, and celebrity and brand endorsements.
- Segment Analysis: In-depth evaluation of how 7 key market segments are implementing NFT technologies, including the effectiveness of these implementations, the revenue streams being unlocked, and any potential roadblocks and opportunities:
- Art
- Collectables
- Fashion
- Gaming
- Metaverse
- Music
- Real Estate
- Vendor Case Studies: Selected case studies that demonstrate the influence of NFTs within the aforementioned segments, alongside an assessment of the long-term prospects of each vendor's ability to successfully incorporate NFTs into their respective industries.
- Benchmark Industry Forecasts: Benchmark 5-year forecasts for the total number of NFT users and transactions, split by 7 key market segments and conducted across three scenarios: low impact, medium impact, and high impact. Each of these scenarios accounts for a multitude of factors; influencing the outcome and long-term stability of NFTs. These forecasts are also split by our 8 key regions and the 60 countries listed below:
- North America:
- Canada, US
- Latin America:
- Argentina, Brazil, Chile, Colombia, Ecuador, Mexico, Peru, Uruguay
- West Europe:
- Austria, Belgium, Denmark, Finland, France, Germany, Greece, Ireland, Italy, Netherlands, Norway, Portugal, Spain, Sweden, Switzerland, UK
- Central & East Europe:
- Croatia, Czech Republic, Hungary, Poland, Romania, Russia, Turkey, Ukraine
- Far East & China:
- China, Hong Kong, Japan, South Korea
- Indian Subcontinent:
- Bangladesh, India, Nepal, Pakistan
- Rest of Asia Pacific:
- Australia, Indonesia, Malaysia, New Zealand, Philippines, Singapore, Thailand, Vietnam
- Africa & Middle East
- Algeria, Egypt, Israel, Kenya, Kuwait, Nigeria, Qatar, Saudi Arabia, South Africa, United Arab Emirates
- North America:
KEY QUESTIONS ANSWERED
- 1. What technologies are key to the implementation of NFTs?
- 2. How vulnerable are NFT market stakeholders to the cyclical nature of the macro-crypto environment?
- 3. What market segments will NFTs benefit the most from, in terms of innovation?
- 4. What trends in NFTs are expected to emerge in the coming years?
- 5. How many NFT transactions will occur in 2027?
COMPANIES REFERENCED
- Case Studied: Audius, Dapper Labs, Decentraland, Nifty Gateway, RTFKT, Sky Mavis.
- Mentioned: Adidas, Amazon, Animoca Brands, Ante, Apple, Atari, Balenciaga, Chainalysis, Coinbase, CryptoFighters Alliance, Digimarc, Duchamp's, eBay, Epic Games, ESMA (European Securities and Markets Authority), ETH-MEN, Etsy, Federal Reserve, Formula 1, Google, GSC Game World, Gucci, Hot Wheels, Kering, Lucid Sight, Mattel, McDonald's, Meta, MetaMask, Mintable, MLB, National Basketball Association, Nike, OMI (Open Music Initiative), OpenSea, Pinterest, PricewaterhouseCoopers, Propy, Rainbow, Rarible, Rolex, Samsung, Skys Mavis, SmartRealty, SoundCloud, Spotify, Tesla, Twitch, Twitter, Ubisoft, UnionPay, Viberate, YouTube, Yves Saint Laurent.
DATA & INTERACTIVE FORECAST
- 5-year benchmark forecasts for:
- Total Number of NFT Transactions
- Total Number of NFT Transactions in the Art Segment
- Total Number of NFT Transactions in the Collectables Segment
- Total Number of NFT Transactions in the Gaming Segment
- Total Number of NFT Transactions in the Metaverse Segment
- Total Number of NFT Transactions in the Service Segment
- Total Number of NFT Transactions in the Other Segment
- Total Number of NFT Users
- Access to the full set of forecast data of 51 tables and more than 25,000 datapoints.
- Interactive scenario tool allowing users to manipulate Juniper Research's data over different metrics.
- Geographical Splits: 60 countries
- harvest: Our online data platform, harvest, contains the very latest market data and is updated throughout the year. This is a fully featured platform enabling clients to better understand key data trends and manipulate charts and tables, overlaying different forecasts within the one chart - using the comparison tool. Empower your business with our market intelligence centre and get alerted whenever your data is updated.
- Interactive Excels (IFxl): Our IFxl tool enables clients to manipulate both forecast data and charts, within an Excel environment, to test their own assumptions using the Interactive Scenario Tool and compare selected markets side by side in customised charts and tables. IFxls greatly increase a clients' ability to both understand a particular market and to integrate their own views into the model.
FORECAST SUMMARY
Juniper Research has found that the global number of NFT transactions will rise from 24 million in 2022 to 40 million by 2027. This is based on our medium scenario for adoption, with brands leveraging the metaverse to boost digital growth. It cautioned that although NFTs present a new channel for growth, vendors must be cognisant to the risks of operating in an unregulated environment home to fraudulent activities and scams.
- Vendors who partake in the NFT space may risk brand damage by association due to the role NFT have had in illegal activities, such as money laundering, scams and fraud. Environmental issues were also raised as a major concern, with the current way transactions are facilitated on the blockchain creating massive energy usage.
- There is a need for regulators to work with industry bodies to standardise processes with reduced environmental impact and built-in consumer protections to enable vendors to utilise it as a medium to further engage with consumers.
- We predict that metaverse-linked NFTs will be the fastest-growing NFT segment over the next five years; growing from 600,000 transactions in 2022 to 9.8 million by 2027. This will be largely attributable to a rising demand for immersive experiences.
- To capitalise on this growth, we urge consumer-facing businesses to create NFT-based content to meet changing demands from a younger, tech-savvy demographic, who are more ready to purchase novel forms of online and digital content.
Table of Contents
1. Key Takeaways & Strategic Recommendations
- 1.1. Key Takeaways
- 1.2. Strategic Recommendations
2. Market Landscape
- 2.1. Introduction
- 2.1.1. What Is an NFT?
- 2.1.2. NFT History
- 2.1.3. An NFT Internet
- Table 2.1: Comparison between the Internet Today and an NFT Internet
- Figure 2.2: Google Trend Data for the Search Term 'NFT' (As of June 2022)
- 2.1.4. NFT Creation
- Figure 2.3: NFT Minting Process
- 2.2. Technology Involved in the NFT Space
- 2.2.1. Blockchain
- Figure 2.4: Blockchain Transaction Process
- i. Proof of Work
- ii. Proof of Stake
- Table 2.5: Comparison between Proof of Work and Proof of Stake
- 2.2.2. Smart Contracts
- 2.2.3. Decentralised Autonomous Organisations
- 2.2.4. Web 3.0
- Figure 2.6: Evolution of the Web
- i. Decentralisation
- Figure 2.7: Decentralisation Under Web 3.0
- ii. Transparency
- iii. Code Is Law
- iv. Web 3.0 Wallet
- 2.2.5. Protocols
- i. Top to Bottom
- ii. Bottom to Top
- 2.2.6. Token Standards
- i. Ethereum Token Standards
- Table 2.8: Ethereum Token Standards
- ii. Tezos Token Standards
- i. Ethereum Token Standards
- 2.2.7. Ethereum 2.0
- 2.2.1. Blockchain
- 2.3. Market Drivers & Opportunities
- 2.3.1. Drivers
- i. Celebrity Culture & Endorsement
- ii. 'Greater Fool' Theory
- Figure 2.9: Ethereum to USD, Year to Date (August 2022)
- iii. P2E (Play-to-Earn)
- Table 2.10: Emergence of Play-to-Earn
- iv. Partnership & Branding
- 2.3.2. Opportunities
- i. Supplementing the Gaming Industry
- ii. Adding Value to Virtual Events
- iii. Protecting Digital Collectables
- iv. Building a Metaverse
- 2.3.1. Drivers
- 2.4. Market Challenges & Concerns
- 2.4.1. Challenges
- i. Environmental Issues
- ii. High Gas Prices
- iii. Influence of Bitcoin
- 2.4.2. Concerns
- i. Money Laundering
- ii. Scams
- iii. Ownership & Copyright
- iv. Regulation
- 2.4.1. Challenges
3. Segment Analysis & Future Trends
- 3.1. Key Segments & Future Trends
- 3.2. Art
- 3.2.1. How Would the Technology Interact with the Segment?
- 3.2.2. What Does the Business Case Look Like?
- 3.3. Collectables
- 3.3.1. How Would the Technology Interact with the Segment?
- 3.3.2. What Does the Business Case Look Like?
- 3.4. Fashion
- 3.4.1. How Would the Technology Interact with the Segment?
- 3.4.2. What Does the Business Case Look Like?
- 3.5. Gaming
- 3.5.1. How Would the Technology Interact with the Segment?
- Figure 3.1: Avenues for Gaming Innovation
- Table 3.2: Non-blockchain Games Versus Blockchain Games
- 3.5.2. What Does the Business Case Look Like?
- Figure 3.3: Example of a Play-to-Earn Business Model Structure
- Table 3.4: Axie Infinity Currency Types
- Figure 3.5: SLP & ETH 180-Day Price Activity (December 2021 to June 2022)
- 3.5.1. How Would the Technology Interact with the Segment?
- 3.6. Metaverse
- 3.6.1. How Would the Technology Interact with the Segment?
- Figure 3.6: Bridge between Platforms and Realms
- Figure 3.7: Decentraland Protocol
- 3.6.2. What Does the Business Case Look Like?
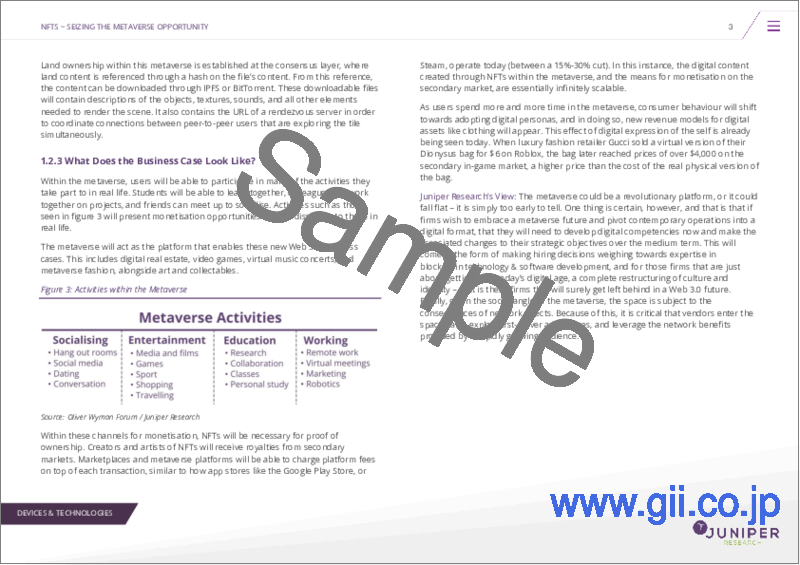
- Figure 3.8: Activities within the Metaverse
- 3.6.1. How Would the Technology Interact with the Segment?
- 3.7. Music
- 3.7.1. How Would the Technology Interact with the Segment?
- 3.7.2. What Does the Business Case Look Like?
- Table 3.9: Some Instances of Blockchain and NFT use in the Music Segment
- Figure 3.10: Audius Content Lifecycle
- 3.8. Real Estate
- 3.8.1. How Would the Technology Interact with the Segment?
- 3.8.2. What Does the Business Case Look Like?
4. Vendor Case Studies
5. Market Forecasts & Key Takeaways
- 5.1. NFT: Market Forecasts
- 5.1.1. Methodology & Assumptions
- i. Low-impact Scenario
- Table 5.1: Low-impact Scenario - Segment Distribution of Transactions
- ii. Medium-impact Scenario
- Table 5.2: Medium-impact Scenario - Average Segment Distribution of Transactions
- iii. High-impact Scenario
- Table 5.3: High-impact Scenario - Average Segment Distribution of Transactions
- Figure 5.4: NFT Methodology
- i. Low-impact Scenario
- 5.1.1. Methodology & Assumptions
- 5.2. Cross Impact Scenario
- 5.2.1. Total Number of NFT Transactions by Scenario
- Figure & Table 5.5: Total Number of NFT Transactions (m), Split by the Three Scenarios, 2022-2027
- 5.2.2. Total Number of Retail NFT Users by Scenario
- Figure & Table 5.6: Total Number of Retail NFT Users (m), Split by Three Scenarios, 2022-2027
- 5.2.1. Total Number of NFT Transactions by Scenario
- 5.3. Low-impact Scenario
- 5.3.1. Total Number of NFT Transactions by Segment
- Figure & Table 5.7: Total Number of NFT Transaction (m), Split by 6 Key Segments, 2022-2027
- 5.3.2. Total Number of NFT Transactions by Region
- Figure & Table 5.8: Total Number of NFT Transactions (m), Split by 8 Key Regions, 2022-2027
- 5.3.1. Total Number of NFT Transactions by Segment
- 5.4. Medium-impact Scenario
- 5.4.1. Total Number of NFT Transactions by Segment
- Figure & Table 5.9: Total Number of NFT Transaction (m), Split by 6 Key Segments, 2022-2027
- 5.4.2. Total Number of NFT Transactions by Region
- Figure & Table 5.10: Total Number of NFT Transactions (m), Split by 8 Key Regions, 2022-2027
- 5.4.1. Total Number of NFT Transactions by Segment
- 5.5. High-impact Scenario
- 5.5.1. Total Number of NFT Transactions by Segment
- Figure & Table 5.11: Total Number of NFT Transaction (m), Split by 6 Key Segments, 2022-2027
- 5.5.2. Total Number of NFT Transactions by Region
- Figure & Table 5.12: Total Number of NFT Transactions (m), Split by 8 Key Regions, 2022-2027
- 5.5.1. Total Number of NFT Transactions by Segment