|
|
市場調査レポート
商品コード
1804485
UV硬化型コーティング市場:製品タイプ、形態、樹脂タイプ、技術、基材、用途、最終用途産業別-2025-2030年世界予測UV Cure Coatings Market by Product Type, Form, Resin Type, Technology, Substrate, Application, End-Use Industry - Global Forecast 2025-2030 |
||||||
|
|||||||
カスタマイズ可能
適宜更新あり
|
|||||||

| UV硬化型コーティング市場:製品タイプ、形態、樹脂タイプ、技術、基材、用途、最終用途産業別-2025-2030年世界予測 |
|
出版日: 2025年08月28日
発行: 360iResearch
ページ情報: 英文 195 Pages
納期: 即日から翌営業日
|

全表示
- 概要
- 図表
- 目次
UV硬化型コーティング市場の2024年の市場規模は56億6,000万米ドルで、2025年にはCAGR 6.34%で60億米ドルに成長し、2030年には81億9,000万米ドルに達すると予測されています。
| 主な市場の統計 | |
|---|---|
| 基準年2024 | 56億6,000万米ドル |
| 推定年2025 | 60億米ドル |
| 予測年2030 | 81億9,000万米ドル |
| CAGR(%) | 6.34% |
UV硬化型コーティング市場情勢に火をつける基礎的背景、イノベーションの定義、将来の業界軌道を形成する中核要因
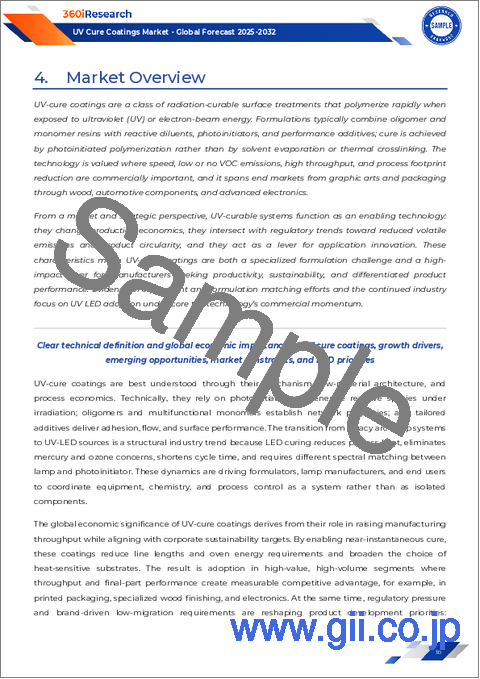
UV硬化型コーティングは、従来の溶剤系塗料に比べて硬化時間が短く、表面特性に優れ、持続可能性が高いことから、エレクトロニクスから自動車まで幅広い産業で不可欠なものとなっています。メーカーが性能要件や規制基準の厳格化に対応するため、耐久性、耐薬品性、低環境負荷を実現するUV硬化型製剤の需要が急増しています。これらのコーティング剤は、光重合開始剤を利用して紫外線下で重合を誘発するため、生産サイクルの高速化とエネルギー消費の削減が可能になります。その結果、最終用途部門は合理化された操業と総所有コストの削減という恩恵を受けることになります。
破壊的な技術の進歩、持続可能性の動向、デジタル統合別UV硬化型コーティングの革命市場力学の再定義
UV硬化型コーティングの分野では現在、技術革新と持続可能性への要求の進化による変革の波が押し寄せています。最近のUV LED硬化技術のブレークスルーは、従来の水銀アークシステムと比較してランプ寿命の延長、熱出力の低減、エネルギー消費の低減を実現し、採用を加速しています。メーカーがデジタル制御と自動化を統合するにつれ、生産ラインはより効率的になり、硬化パラメーターの正確な制御とリアルタイムの品質モニタリングが可能になっています。
2025年における米国のUV硬化型コーティングに対する関税措置の累積効果とグローバルサプライチェーンへの影響の評価
2025年、UV硬化型コーティングと主要原材料に対する米国の関税措置の継続と拡大は、世界のサプライチェーンとコスト構造に複合的な影響を及ぼしています。最初の関税は光重合開始剤と特殊モノマーの輸入業者にストレスを与え、上流での反応的な価格調整を促しました。これらの関税が累積するにつれて、メーカーはマージン圧力に直面し、調達戦略や製造フットプリントの再評価が必要となりました。
製品タイプ、配合、樹脂カテゴリー、技術、基材、用途、最終用途産業にわたるセグメンテーションパターンの解明
UV硬化型コーティング市場は、複雑なエンドユーザー要件と技術の多様性を反映した多面的なセグメンテーションを示します。製品タイプ別では、添加剤、モノマー、オリゴマー、光重合開始剤があり、それぞれ特定の重合経路と性能特性を持つi型とII型に分類されます。配合の領域では、液体システムが引き続き高速工業用途で優位を占める一方、粉体塗料は無溶剤プロファイルと最小限の排出量により、環境に優しい分野で地歩を固めつつあります。
南北アメリカ、中東・アフリカ、アジア太平洋におけるUV硬化型コーティング市場の地域的特徴と需要促進要因のマッピング
UV硬化型コーティング市場の地域力学は、様々な成長軌道と需要促進要因を示しています。南北アメリカでは、自動車製造と先端エレクトロニクス組立の堅調な活動が、高性能エポキシとポリアクリレートシステムへの関心を高めています。また、持続可能性の義務化と循環型経済への取り組みにより、特に包装・印刷用途では、無溶剤パウダー技術と再生可能資源樹脂の採用が加速しています。
UV硬化型コーティングの主要メーカー、イノベーター、技術パートナーに関する戦略的情報別競合情勢の把握
UV硬化型コーティング業界の競合勢力は、世界的な化学コングロマリットと専門技術のイノベーターによって形成されています。大手コーティング剤メーカーは、広範な配合ネットワークと統合生産能力を活用してエンドツーエンドのソリューションを提供する一方、光重合開始剤のスペシャリストは、より速い硬化速度と深い浸透を可能にする高度な化学物質に焦点を当てています。最適化されたランプとLEDシステムを設計する装置プロバイダーは、原材料サプライヤーと密接に協力し、互換性と性能の一貫性を確保しています。
UV硬化型コーティングの成長、卓越したオペレーション、持続可能なイノベーションを推進する業界リーダーのための戦略的課題
進化するUV硬化型コーティング市場で成功するために、業界リーダーはエネルギー効率の改善とメンテナンスコストの削減を実現する次世代硬化技術への投資を優先すべきです。UV LEDプラットフォームへの移行を加速することで、持続可能性の目標に対応するだけでなく、操業のアップタイムとスループットの柔軟性を高めることができます。同時に、企業は原料イノベーターとの協力関係を深め、規制基準の厳格化を見越したバイオベースのモノマーや低移行性の光重合開始剤を共同開発する必要があります。
1次インタビュー、2次データの検証、信頼性のための厳格な分析フレームワークを統合した包括的調査手法
本分析は、1次データと2次データの両方の流れを統合した厳密な調査フレームワークに基づいて構築されています。市場動向、技術導入、戦略的優先事項に関する生の視点を把握するため、コーティングメーカー、装置サプライヤー、エンドユーザー業界の経営幹部、研究開発リーダー、工場長に対して広範なインタビューを実施しました。これらの定性的洞察に加え、主要な調査結果を検証するため、査読付きジャーナル、業界白書、規制関連出版物などの2次調査を実施しました。
進化するUV硬化型コーティング市場エコシステムを通じて利害関係者を導くための中核的知見と戦略的示唆の統合
UV硬化コーティング業界は、技術革新、規制の変化、最終用途の需要の進化が市場のダイナミクスを再構築する重要な岐路に立っています。UV LED硬化、持続可能な化学物質、デジタル統合の進歩は、新たな性能のフロンティアを切り開き、コスト構造を再定義しています。同時に、関税に起因するサプライチェーンの再編成と地域的な成長格差は、戦略的な回復力と地域的な機敏性の重要性を強調しています。
目次
第1章 序文
第2章 調査手法
第3章 エグゼクティブサマリー
第4章 市場の概要
第5章 市場力学
- UV LED硬化システムの統合によりエネルギー消費とメンテナンスコストを削減
- 食品包装用途向け低移行性UV硬化インクの開発
- 低揮発性有機化合物コンプライアンスのための水性UV硬化型コーティングの配合
- UVコーティングの耐傷性と表面硬度を向上させるナノ粒子添加剤の採用
- 可変データパッケージングワークフローに最適化されたデジタルUVインクジェット印刷フォーミュレーション
- 自動車用複合材およびプラスチック部品製造向け高速UV硬化ラインの拡張
- スマートコーティングソリューションのための特定の波長によって引き起こされる自己修復UV硬化の調査
第6章 市場洞察
- ポーターのファイブフォース分析
- PESTEL分析
第7章 米国の関税の累積的な影響2025
第8章 UV硬化型コーティング市場:製品タイプ別
- 添加剤
- モノマー
- オリゴマー
- 光開始剤
- タイプI
- タイプII
第9章 UV硬化型コーティング市場:形態別
- 液体
- 粉
第10章 UV硬化型コーティング市場:樹脂タイプ別
- エポキシ
- ポリアクリレート
- ポリエステル
- シリコーン
- ウレタン
第11章 UV硬化型コーティング市場:技術別
- アークランプ硬化
- 電子ビーム(EB)硬化
- エキシマランプ硬化
- UV LED硬化
第12章 UV硬化型コーティング市場基質別
- セラミック
- 金属
- 紙
- プラスチック
- 繊維
- 木材
第13章 UV硬化型コーティング市場:用途別
- 電子コーティング
- 金属コーティング
- 光ファイバーコーティング
- プラスチックコーティング
- 木材コーティング
第14章 UV硬化型コーティング市場:最終用途産業別
- 自動車
- 電子・電気
- 家具と木工品
- パッケージ
- 印刷とグラフィックアート
第15章 南北アメリカのUV硬化型コーティング市場
- 米国
- カナダ
- メキシコ
- ブラジル
- アルゼンチン
第16章 欧州・中東・アフリカのUV硬化型コーティング市場
- 英国
- ドイツ
- フランス
- ロシア
- イタリア
- スペイン
- アラブ首長国連邦
- サウジアラビア
- 南アフリカ
- デンマーク
- オランダ
- カタール
- フィンランド
- スウェーデン
- ナイジェリア
- エジプト
- トルコ
- イスラエル
- ノルウェー
- ポーランド
- スイス
第17章 アジア太平洋地域のUV硬化型コーティング市場
- 中国
- インド
- 日本
- オーストラリア
- 韓国
- インドネシア
- タイ
- フィリピン
- マレーシア
- シンガポール
- ベトナム
- 台湾
第18章 競合情勢
- 市場シェア分析, 2024
- FPNVポジショニングマトリックス, 2024
- 競合分析
- 3M Company
- Akzo Nobel N.V.
- Allnex N.V.
- Ashland Global Holdings Inc.
- Axalta Coating Systems Ltd.
- BASF SE
- DIC Corporation
- Dow Inc.
- DuPont de Nemours, Inc.
- Henkel AG & Co. KGaA
- Kansai Paint Co., Ltd.
- Kuraray Co., Ltd.
- Polyweave International LLC
- PPG Industries, Inc.
- Royal DSM N.V.
- RPM International Inc.
- Sun Chemical Corporation
- The Sherwin-Williams Company
- Dymax Corporation
- Miwon Specialty Chemical Co., Ltd.
第19章 リサーチAI
第20章 リサーチ統計
第21章 リサーチコンタクト
第22章 リサーチ記事
第23章 付録
LIST OF FIGURES
- FIGURE 1. UV CURE COATINGS MARKET RESEARCH PROCESS
- FIGURE 2. GLOBAL UV CURE COATINGS MARKET SIZE, 2018-2030 (USD MILLION)
- FIGURE 3. GLOBAL UV CURE COATINGS MARKET SIZE, BY REGION, 2024 VS 2025 VS 2030 (USD MILLION)
- FIGURE 4. GLOBAL UV CURE COATINGS MARKET SIZE, BY COUNTRY, 2024 VS 2025 VS 2030 (USD MILLION)
- FIGURE 5. GLOBAL UV CURE COATINGS MARKET SIZE, BY PRODUCT TYPE, 2024 VS 2030 (%)
- FIGURE 6. GLOBAL UV CURE COATINGS MARKET SIZE, BY PRODUCT TYPE, 2024 VS 2025 VS 2030 (USD MILLION)
- FIGURE 7. GLOBAL UV CURE COATINGS MARKET SIZE, BY FORM, 2024 VS 2030 (%)
- FIGURE 8. GLOBAL UV CURE COATINGS MARKET SIZE, BY FORM, 2024 VS 2025 VS 2030 (USD MILLION)
- FIGURE 9. GLOBAL UV CURE COATINGS MARKET SIZE, BY RESIN TYPE, 2024 VS 2030 (%)
- FIGURE 10. GLOBAL UV CURE COATINGS MARKET SIZE, BY RESIN TYPE, 2024 VS 2025 VS 2030 (USD MILLION)
- FIGURE 11. GLOBAL UV CURE COATINGS MARKET SIZE, BY TECHNOLOGY, 2024 VS 2030 (%)
- FIGURE 12. GLOBAL UV CURE COATINGS MARKET SIZE, BY TECHNOLOGY, 2024 VS 2025 VS 2030 (USD MILLION)
- FIGURE 13. GLOBAL UV CURE COATINGS MARKET SIZE, BY SUBSTRATE, 2024 VS 2030 (%)
- FIGURE 14. GLOBAL UV CURE COATINGS MARKET SIZE, BY SUBSTRATE, 2024 VS 2025 VS 2030 (USD MILLION)
- FIGURE 15. GLOBAL UV CURE COATINGS MARKET SIZE, BY APPLICATION, 2024 VS 2030 (%)
- FIGURE 16. GLOBAL UV CURE COATINGS MARKET SIZE, BY APPLICATION, 2024 VS 2025 VS 2030 (USD MILLION)
- FIGURE 17. GLOBAL UV CURE COATINGS MARKET SIZE, BY END-USE INDUSTRY, 2024 VS 2030 (%)
- FIGURE 18. GLOBAL UV CURE COATINGS MARKET SIZE, BY END-USE INDUSTRY, 2024 VS 2025 VS 2030 (USD MILLION)
- FIGURE 19. AMERICAS UV CURE COATINGS MARKET SIZE, BY COUNTRY, 2024 VS 2030 (%)
- FIGURE 20. AMERICAS UV CURE COATINGS MARKET SIZE, BY COUNTRY, 2024 VS 2025 VS 2030 (USD MILLION)
- FIGURE 21. UNITED STATES UV CURE COATINGS MARKET SIZE, BY STATE, 2024 VS 2030 (%)
- FIGURE 22. UNITED STATES UV CURE COATINGS MARKET SIZE, BY STATE, 2024 VS 2025 VS 2030 (USD MILLION)
- FIGURE 23. EUROPE, MIDDLE EAST & AFRICA UV CURE COATINGS MARKET SIZE, BY COUNTRY, 2024 VS 2030 (%)
- FIGURE 24. EUROPE, MIDDLE EAST & AFRICA UV CURE COATINGS MARKET SIZE, BY COUNTRY, 2024 VS 2025 VS 2030 (USD MILLION)
- FIGURE 25. ASIA-PACIFIC UV CURE COATINGS MARKET SIZE, BY COUNTRY, 2024 VS 2030 (%)
- FIGURE 26. ASIA-PACIFIC UV CURE COATINGS MARKET SIZE, BY COUNTRY, 2024 VS 2025 VS 2030 (USD MILLION)
- FIGURE 27. UV CURE COATINGS MARKET SHARE, BY KEY PLAYER, 2024
- FIGURE 28. UV CURE COATINGS MARKET, FPNV POSITIONING MATRIX, 2024
- FIGURE 29. UV CURE COATINGS MARKET: RESEARCHAI
- FIGURE 30. UV CURE COATINGS MARKET: RESEARCHSTATISTICS
- FIGURE 31. UV CURE COATINGS MARKET: RESEARCHCONTACTS
- FIGURE 32. UV CURE COATINGS MARKET: RESEARCHARTICLES
LIST OF TABLES
- TABLE 1. UV CURE COATINGS MARKET SEGMENTATION & COVERAGE
- TABLE 2. UNITED STATES DOLLAR EXCHANGE RATE, 2018-2024
- TABLE 3. GLOBAL UV CURE COATINGS MARKET SIZE, 2018-2024 (USD MILLION)
- TABLE 4. GLOBAL UV CURE COATINGS MARKET SIZE, 2025-2030 (USD MILLION)
- TABLE 5. GLOBAL UV CURE COATINGS MARKET SIZE, BY REGION, 2018-2024 (USD MILLION)
- TABLE 6. GLOBAL UV CURE COATINGS MARKET SIZE, BY REGION, 2025-2030 (USD MILLION)
- TABLE 7. GLOBAL UV CURE COATINGS MARKET SIZE, BY COUNTRY, 2018-2024 (USD MILLION)
- TABLE 8. GLOBAL UV CURE COATINGS MARKET SIZE, BY COUNTRY, 2025-2030 (USD MILLION)
- TABLE 9. GLOBAL UV CURE COATINGS MARKET SIZE, BY PRODUCT TYPE, 2018-2024 (USD MILLION)
- TABLE 10. GLOBAL UV CURE COATINGS MARKET SIZE, BY PRODUCT TYPE, 2025-2030 (USD MILLION)
- TABLE 11. GLOBAL UV CURE COATINGS MARKET SIZE, BY ADDITIVES, BY REGION, 2018-2024 (USD MILLION)
- TABLE 12. GLOBAL UV CURE COATINGS MARKET SIZE, BY ADDITIVES, BY REGION, 2025-2030 (USD MILLION)
- TABLE 13. GLOBAL UV CURE COATINGS MARKET SIZE, BY MONOMERS, BY REGION, 2018-2024 (USD MILLION)
- TABLE 14. GLOBAL UV CURE COATINGS MARKET SIZE, BY MONOMERS, BY REGION, 2025-2030 (USD MILLION)
- TABLE 15. GLOBAL UV CURE COATINGS MARKET SIZE, BY OLIGOMERS, BY REGION, 2018-2024 (USD MILLION)
- TABLE 16. GLOBAL UV CURE COATINGS MARKET SIZE, BY OLIGOMERS, BY REGION, 2025-2030 (USD MILLION)
- TABLE 17. GLOBAL UV CURE COATINGS MARKET SIZE, BY PHOTOINITIATORS, BY REGION, 2018-2024 (USD MILLION)
- TABLE 18. GLOBAL UV CURE COATINGS MARKET SIZE, BY PHOTOINITIATORS, BY REGION, 2025-2030 (USD MILLION)
- TABLE 19. GLOBAL UV CURE COATINGS MARKET SIZE, BY TYPE I, BY REGION, 2018-2024 (USD MILLION)
- TABLE 20. GLOBAL UV CURE COATINGS MARKET SIZE, BY TYPE I, BY REGION, 2025-2030 (USD MILLION)
- TABLE 21. GLOBAL UV CURE COATINGS MARKET SIZE, BY TYPE II, BY REGION, 2018-2024 (USD MILLION)
- TABLE 22. GLOBAL UV CURE COATINGS MARKET SIZE, BY TYPE II, BY REGION, 2025-2030 (USD MILLION)
- TABLE 23. GLOBAL UV CURE COATINGS MARKET SIZE, BY PHOTOINITIATORS, 2018-2024 (USD MILLION)
- TABLE 24. GLOBAL UV CURE COATINGS MARKET SIZE, BY PHOTOINITIATORS, 2025-2030 (USD MILLION)
- TABLE 25. GLOBAL UV CURE COATINGS MARKET SIZE, BY FORM, 2018-2024 (USD MILLION)
- TABLE 26. GLOBAL UV CURE COATINGS MARKET SIZE, BY FORM, 2025-2030 (USD MILLION)
- TABLE 27. GLOBAL UV CURE COATINGS MARKET SIZE, BY LIQUID, BY REGION, 2018-2024 (USD MILLION)
- TABLE 28. GLOBAL UV CURE COATINGS MARKET SIZE, BY LIQUID, BY REGION, 2025-2030 (USD MILLION)
- TABLE 29. GLOBAL UV CURE COATINGS MARKET SIZE, BY POWDER, BY REGION, 2018-2024 (USD MILLION)
- TABLE 30. GLOBAL UV CURE COATINGS MARKET SIZE, BY POWDER, BY REGION, 2025-2030 (USD MILLION)
- TABLE 31. GLOBAL UV CURE COATINGS MARKET SIZE, BY RESIN TYPE, 2018-2024 (USD MILLION)
- TABLE 32. GLOBAL UV CURE COATINGS MARKET SIZE, BY RESIN TYPE, 2025-2030 (USD MILLION)
- TABLE 33. GLOBAL UV CURE COATINGS MARKET SIZE, BY EPOXY, BY REGION, 2018-2024 (USD MILLION)
- TABLE 34. GLOBAL UV CURE COATINGS MARKET SIZE, BY EPOXY, BY REGION, 2025-2030 (USD MILLION)
- TABLE 35. GLOBAL UV CURE COATINGS MARKET SIZE, BY POLYACRYLATE, BY REGION, 2018-2024 (USD MILLION)
- TABLE 36. GLOBAL UV CURE COATINGS MARKET SIZE, BY POLYACRYLATE, BY REGION, 2025-2030 (USD MILLION)
- TABLE 37. GLOBAL UV CURE COATINGS MARKET SIZE, BY POLYESTER, BY REGION, 2018-2024 (USD MILLION)
- TABLE 38. GLOBAL UV CURE COATINGS MARKET SIZE, BY POLYESTER, BY REGION, 2025-2030 (USD MILLION)
- TABLE 39. GLOBAL UV CURE COATINGS MARKET SIZE, BY SILICONE, BY REGION, 2018-2024 (USD MILLION)
- TABLE 40. GLOBAL UV CURE COATINGS MARKET SIZE, BY SILICONE, BY REGION, 2025-2030 (USD MILLION)
- TABLE 41. GLOBAL UV CURE COATINGS MARKET SIZE, BY URETHANE, BY REGION, 2018-2024 (USD MILLION)
- TABLE 42. GLOBAL UV CURE COATINGS MARKET SIZE, BY URETHANE, BY REGION, 2025-2030 (USD MILLION)
- TABLE 43. GLOBAL UV CURE COATINGS MARKET SIZE, BY TECHNOLOGY, 2018-2024 (USD MILLION)
- TABLE 44. GLOBAL UV CURE COATINGS MARKET SIZE, BY TECHNOLOGY, 2025-2030 (USD MILLION)
- TABLE 45. GLOBAL UV CURE COATINGS MARKET SIZE, BY ARC LAMP CURING, BY REGION, 2018-2024 (USD MILLION)
- TABLE 46. GLOBAL UV CURE COATINGS MARKET SIZE, BY ARC LAMP CURING, BY REGION, 2025-2030 (USD MILLION)
- TABLE 47. GLOBAL UV CURE COATINGS MARKET SIZE, BY ELECTRON BEAM (EB) CURING, BY REGION, 2018-2024 (USD MILLION)
- TABLE 48. GLOBAL UV CURE COATINGS MARKET SIZE, BY ELECTRON BEAM (EB) CURING, BY REGION, 2025-2030 (USD MILLION)
- TABLE 49. GLOBAL UV CURE COATINGS MARKET SIZE, BY EXCIMER LAMP CURING, BY REGION, 2018-2024 (USD MILLION)
- TABLE 50. GLOBAL UV CURE COATINGS MARKET SIZE, BY EXCIMER LAMP CURING, BY REGION, 2025-2030 (USD MILLION)
- TABLE 51. GLOBAL UV CURE COATINGS MARKET SIZE, BY UV LED CURING, BY REGION, 2018-2024 (USD MILLION)
- TABLE 52. GLOBAL UV CURE COATINGS MARKET SIZE, BY UV LED CURING, BY REGION, 2025-2030 (USD MILLION)
- TABLE 53. GLOBAL UV CURE COATINGS MARKET SIZE, BY SUBSTRATE, 2018-2024 (USD MILLION)
- TABLE 54. GLOBAL UV CURE COATINGS MARKET SIZE, BY SUBSTRATE, 2025-2030 (USD MILLION)
- TABLE 55. GLOBAL UV CURE COATINGS MARKET SIZE, BY CERAMIC, BY REGION, 2018-2024 (USD MILLION)
- TABLE 56. GLOBAL UV CURE COATINGS MARKET SIZE, BY CERAMIC, BY REGION, 2025-2030 (USD MILLION)
- TABLE 57. GLOBAL UV CURE COATINGS MARKET SIZE, BY METAL, BY REGION, 2018-2024 (USD MILLION)
- TABLE 58. GLOBAL UV CURE COATINGS MARKET SIZE, BY METAL, BY REGION, 2025-2030 (USD MILLION)
- TABLE 59. GLOBAL UV CURE COATINGS MARKET SIZE, BY PAPER, BY REGION, 2018-2024 (USD MILLION)
- TABLE 60. GLOBAL UV CURE COATINGS MARKET SIZE, BY PAPER, BY REGION, 2025-2030 (USD MILLION)
- TABLE 61. GLOBAL UV CURE COATINGS MARKET SIZE, BY PLASTIC, BY REGION, 2018-2024 (USD MILLION)
- TABLE 62. GLOBAL UV CURE COATINGS MARKET SIZE, BY PLASTIC, BY REGION, 2025-2030 (USD MILLION)
- TABLE 63. GLOBAL UV CURE COATINGS MARKET SIZE, BY TEXTILE, BY REGION, 2018-2024 (USD MILLION)
- TABLE 64. GLOBAL UV CURE COATINGS MARKET SIZE, BY TEXTILE, BY REGION, 2025-2030 (USD MILLION)
- TABLE 65. GLOBAL UV CURE COATINGS MARKET SIZE, BY WOOD, BY REGION, 2018-2024 (USD MILLION)
- TABLE 66. GLOBAL UV CURE COATINGS MARKET SIZE, BY WOOD, BY REGION, 2025-2030 (USD MILLION)
- TABLE 67. GLOBAL UV CURE COATINGS MARKET SIZE, BY APPLICATION, 2018-2024 (USD MILLION)
- TABLE 68. GLOBAL UV CURE COATINGS MARKET SIZE, BY APPLICATION, 2025-2030 (USD MILLION)
- TABLE 69. GLOBAL UV CURE COATINGS MARKET SIZE, BY ELECTRONIC COATINGS, BY REGION, 2018-2024 (USD MILLION)
- TABLE 70. GLOBAL UV CURE COATINGS MARKET SIZE, BY ELECTRONIC COATINGS, BY REGION, 2025-2030 (USD MILLION)
- TABLE 71. GLOBAL UV CURE COATINGS MARKET SIZE, BY METAL COATINGS, BY REGION, 2018-2024 (USD MILLION)
- TABLE 72. GLOBAL UV CURE COATINGS MARKET SIZE, BY METAL COATINGS, BY REGION, 2025-2030 (USD MILLION)
- TABLE 73. GLOBAL UV CURE COATINGS MARKET SIZE, BY OPTICAL FIBER COATINGS, BY REGION, 2018-2024 (USD MILLION)
- TABLE 74. GLOBAL UV CURE COATINGS MARKET SIZE, BY OPTICAL FIBER COATINGS, BY REGION, 2025-2030 (USD MILLION)
- TABLE 75. GLOBAL UV CURE COATINGS MARKET SIZE, BY PLASTIC COATINGS, BY REGION, 2018-2024 (USD MILLION)
- TABLE 76. GLOBAL UV CURE COATINGS MARKET SIZE, BY PLASTIC COATINGS, BY REGION, 2025-2030 (USD MILLION)
- TABLE 77. GLOBAL UV CURE COATINGS MARKET SIZE, BY WOOD COATINGS, BY REGION, 2018-2024 (USD MILLION)
- TABLE 78. GLOBAL UV CURE COATINGS MARKET SIZE, BY WOOD COATINGS, BY REGION, 2025-2030 (USD MILLION)
- TABLE 79. GLOBAL UV CURE COATINGS MARKET SIZE, BY END-USE INDUSTRY, 2018-2024 (USD MILLION)
- TABLE 80. GLOBAL UV CURE COATINGS MARKET SIZE, BY END-USE INDUSTRY, 2025-2030 (USD MILLION)
- TABLE 81. GLOBAL UV CURE COATINGS MARKET SIZE, BY AUTOMOTIVE, BY REGION, 2018-2024 (USD MILLION)
- TABLE 82. GLOBAL UV CURE COATINGS MARKET SIZE, BY AUTOMOTIVE, BY REGION, 2025-2030 (USD MILLION)
- TABLE 83. GLOBAL UV CURE COATINGS MARKET SIZE, BY ELECTRONICS & ELECTRICAL, BY REGION, 2018-2024 (USD MILLION)
- TABLE 84. GLOBAL UV CURE COATINGS MARKET SIZE, BY ELECTRONICS & ELECTRICAL, BY REGION, 2025-2030 (USD MILLION)
- TABLE 85. GLOBAL UV CURE COATINGS MARKET SIZE, BY FURNITURE & WOODWORKING, BY REGION, 2018-2024 (USD MILLION)
- TABLE 86. GLOBAL UV CURE COATINGS MARKET SIZE, BY FURNITURE & WOODWORKING, BY REGION, 2025-2030 (USD MILLION)
- TABLE 87. GLOBAL UV CURE COATINGS MARKET SIZE, BY PACKAGING, BY REGION, 2018-2024 (USD MILLION)
- TABLE 88. GLOBAL UV CURE COATINGS MARKET SIZE, BY PACKAGING, BY REGION, 2025-2030 (USD MILLION)
- TABLE 89. GLOBAL UV CURE COATINGS MARKET SIZE, BY PRINTING & GRAPHIC ARTS, BY REGION, 2018-2024 (USD MILLION)
- TABLE 90. GLOBAL UV CURE COATINGS MARKET SIZE, BY PRINTING & GRAPHIC ARTS, BY REGION, 2025-2030 (USD MILLION)
- TABLE 91. AMERICAS UV CURE COATINGS MARKET SIZE, BY PRODUCT TYPE, 2018-2024 (USD MILLION)
- TABLE 92. AMERICAS UV CURE COATINGS MARKET SIZE, BY PRODUCT TYPE, 2025-2030 (USD MILLION)
- TABLE 93. AMERICAS UV CURE COATINGS MARKET SIZE, BY PHOTOINITIATORS, 2018-2024 (USD MILLION)
- TABLE 94. AMERICAS UV CURE COATINGS MARKET SIZE, BY PHOTOINITIATORS, 2025-2030 (USD MILLION)
- TABLE 95. AMERICAS UV CURE COATINGS MARKET SIZE, BY FORM, 2018-2024 (USD MILLION)
- TABLE 96. AMERICAS UV CURE COATINGS MARKET SIZE, BY FORM, 2025-2030 (USD MILLION)
- TABLE 97. AMERICAS UV CURE COATINGS MARKET SIZE, BY RESIN TYPE, 2018-2024 (USD MILLION)
- TABLE 98. AMERICAS UV CURE COATINGS MARKET SIZE, BY RESIN TYPE, 2025-2030 (USD MILLION)
- TABLE 99. AMERICAS UV CURE COATINGS MARKET SIZE, BY TECHNOLOGY, 2018-2024 (USD MILLION)
- TABLE 100. AMERICAS UV CURE COATINGS MARKET SIZE, BY TECHNOLOGY, 2025-2030 (USD MILLION)
- TABLE 101. AMERICAS UV CURE COATINGS MARKET SIZE, BY SUBSTRATE, 2018-2024 (USD MILLION)
- TABLE 102. AMERICAS UV CURE COATINGS MARKET SIZE, BY SUBSTRATE, 2025-2030 (USD MILLION)
- TABLE 103. AMERICAS UV CURE COATINGS MARKET SIZE, BY APPLICATION, 2018-2024 (USD MILLION)
- TABLE 104. AMERICAS UV CURE COATINGS MARKET SIZE, BY APPLICATION, 2025-2030 (USD MILLION)
- TABLE 105. AMERICAS UV CURE COATINGS MARKET SIZE, BY END-USE INDUSTRY, 2018-2024 (USD MILLION)
- TABLE 106. AMERICAS UV CURE COATINGS MARKET SIZE, BY END-USE INDUSTRY, 2025-2030 (USD MILLION)
- TABLE 107. AMERICAS UV CURE COATINGS MARKET SIZE, BY COUNTRY, 2018-2024 (USD MILLION)
- TABLE 108. AMERICAS UV CURE COATINGS MARKET SIZE, BY COUNTRY, 2025-2030 (USD MILLION)
- TABLE 109. UNITED STATES UV CURE COATINGS MARKET SIZE, BY PRODUCT TYPE, 2018-2024 (USD MILLION)
- TABLE 110. UNITED STATES UV CURE COATINGS MARKET SIZE, BY PRODUCT TYPE, 2025-2030 (USD MILLION)
- TABLE 111. UNITED STATES UV CURE COATINGS MARKET SIZE, BY PHOTOINITIATORS, 2018-2024 (USD MILLION)
- TABLE 112. UNITED STATES UV CURE COATINGS MARKET SIZE, BY PHOTOINITIATORS, 2025-2030 (USD MILLION)
- TABLE 113. UNITED STATES UV CURE COATINGS MARKET SIZE, BY FORM, 2018-2024 (USD MILLION)
- TABLE 114. UNITED STATES UV CURE COATINGS MARKET SIZE, BY FORM, 2025-2030 (USD MILLION)
- TABLE 115. UNITED STATES UV CURE COATINGS MARKET SIZE, BY RESIN TYPE, 2018-2024 (USD MILLION)
- TABLE 116. UNITED STATES UV CURE COATINGS MARKET SIZE, BY RESIN TYPE, 2025-2030 (USD MILLION)
- TABLE 117. UNITED STATES UV CURE COATINGS MARKET SIZE, BY TECHNOLOGY, 2018-2024 (USD MILLION)
- TABLE 118. UNITED STATES UV CURE COATINGS MARKET SIZE, BY TECHNOLOGY, 2025-2030 (USD MILLION)
- TABLE 119. UNITED STATES UV CURE COATINGS MARKET SIZE, BY SUBSTRATE, 2018-2024 (USD MILLION)
- TABLE 120. UNITED STATES UV CURE COATINGS MARKET SIZE, BY SUBSTRATE, 2025-2030 (USD MILLION)
- TABLE 121. UNITED STATES UV CURE COATINGS MARKET SIZE, BY APPLICATION, 2018-2024 (USD MILLION)
- TABLE 122. UNITED STATES UV CURE COATINGS MARKET SIZE, BY APPLICATION, 2025-2030 (USD MILLION)
- TABLE 123. UNITED STATES UV CURE COATINGS MARKET SIZE, BY END-USE INDUSTRY, 2018-2024 (USD MILLION)
- TABLE 124. UNITED STATES UV CURE COATINGS MARKET SIZE, BY END-USE INDUSTRY, 2025-2030 (USD MILLION)
- TABLE 125. UNITED STATES UV CURE COATINGS MARKET SIZE, BY STATE, 2018-2024 (USD MILLION)
- TABLE 126. UNITED STATES UV CURE COATINGS MARKET SIZE, BY STATE, 2025-2030 (USD MILLION)
- TABLE 127. CANADA UV CURE COATINGS MARKET SIZE, BY PRODUCT TYPE, 2018-2024 (USD MILLION)
- TABLE 128. CANADA UV CURE COATINGS MARKET SIZE, BY PRODUCT TYPE, 2025-2030 (USD MILLION)
- TABLE 129. CANADA UV CURE COATINGS MARKET SIZE, BY PHOTOINITIATORS, 2018-2024 (USD MILLION)
- TABLE 130. CANADA UV CURE COATINGS MARKET SIZE, BY PHOTOINITIATORS, 2025-2030 (USD MILLION)
- TABLE 131. CANADA UV CURE COATINGS MARKET SIZE, BY FORM, 2018-2024 (USD MILLION)
- TABLE 132. CANADA UV CURE COATINGS MARKET SIZE, BY FORM, 2025-2030 (USD MILLION)
- TABLE 133. CANADA UV CURE COATINGS MARKET SIZE, BY RESIN TYPE, 2018-2024 (USD MILLION)
- TABLE 134. CANADA UV CURE COATINGS MARKET SIZE, BY RESIN TYPE, 2025-2030 (USD MILLION)
- TABLE 135. CANADA UV CURE COATINGS MARKET SIZE, BY TECHNOLOGY, 2018-2024 (USD MILLION)
- TABLE 136. CANADA UV CURE COATINGS MARKET SIZE, BY TECHNOLOGY, 2025-2030 (USD MILLION)
- TABLE 137. CANADA UV CURE COATINGS MARKET SIZE, BY SUBSTRATE, 2018-2024 (USD MILLION)
- TABLE 138. CANADA UV CURE COATINGS MARKET SIZE, BY SUBSTRATE, 2025-2030 (USD MILLION)
- TABLE 139. CANADA UV CURE COATINGS MARKET SIZE, BY APPLICATION, 2018-2024 (USD MILLION)
- TABLE 140. CANADA UV CURE COATINGS MARKET SIZE, BY APPLICATION, 2025-2030 (USD MILLION)
- TABLE 141. CANADA UV CURE COATINGS MARKET SIZE, BY END-USE INDUSTRY, 2018-2024 (USD MILLION)
- TABLE 142. CANADA UV CURE COATINGS MARKET SIZE, BY END-USE INDUSTRY, 2025-2030 (USD MILLION)
- TABLE 143. MEXICO UV CURE COATINGS MARKET SIZE, BY PRODUCT TYPE, 2018-2024 (USD MILLION)
- TABLE 144. MEXICO UV CURE COATINGS MARKET SIZE, BY PRODUCT TYPE, 2025-2030 (USD MILLION)
- TABLE 145. MEXICO UV CURE COATINGS MARKET SIZE, BY PHOTOINITIATORS, 2018-2024 (USD MILLION)
- TABLE 146. MEXICO UV CURE COATINGS MARKET SIZE, BY PHOTOINITIATORS, 2025-2030 (USD MILLION)
- TABLE 147. MEXICO UV CURE COATINGS MARKET SIZE, BY FORM, 2018-2024 (USD MILLION)
- TABLE 148. MEXICO UV CURE COATINGS MARKET SIZE, BY FORM, 2025-2030 (USD MILLION)
- TABLE 149. MEXICO UV CURE COATINGS MARKET SIZE, BY RESIN TYPE, 2018-2024 (USD MILLION)
- TABLE 150. MEXICO UV CURE COATINGS MARKET SIZE, BY RESIN TYPE, 2025-2030 (USD MILLION)
- TABLE 151. MEXICO UV CURE COATINGS MARKET SIZE, BY TECHNOLOGY, 2018-2024 (USD MILLION)
- TABLE 152. MEXICO UV CURE COATINGS MARKET SIZE, BY TECHNOLOGY, 2025-2030 (USD MILLION)
- TABLE 153. MEXICO UV CURE COATINGS MARKET SIZE, BY SUBSTRATE, 2018-2024 (USD MILLION)
- TABLE 154. MEXICO UV CURE COATINGS MARKET SIZE, BY SUBSTRATE, 2025-2030 (USD MILLION)
- TABLE 155. MEXICO UV CURE COATINGS MARKET SIZE, BY APPLICATION, 2018-2024 (USD MILLION)
- TABLE 156. MEXICO UV CURE COATINGS MARKET SIZE, BY APPLICATION, 2025-2030 (USD MILLION)
- TABLE 157. MEXICO UV CURE COATINGS MARKET SIZE, BY END-USE INDUSTRY, 2018-2024 (USD MILLION)
- TABLE 158. MEXICO UV CURE COATINGS MARKET SIZE, BY END-USE INDUSTRY, 2025-2030 (USD MILLION)
- TABLE 159. BRAZIL UV CURE COATINGS MARKET SIZE, BY PRODUCT TYPE, 2018-2024 (USD MILLION)
- TABLE 160. BRAZIL UV CURE COATINGS MARKET SIZE, BY PRODUCT TYPE, 2025-2030 (USD MILLION)
- TABLE 161. BRAZIL UV CURE COATINGS MARKET SIZE, BY PHOTOINITIATORS, 2018-2024 (USD MILLION)
- TABLE 162. BRAZIL UV CURE COATINGS MARKET SIZE, BY PHOTOINITIATORS, 2025-2030 (USD MILLION)
- TABLE 163. BRAZIL UV CURE COATINGS MARKET SIZE, BY FORM, 2018-2024 (USD MILLION)
- TABLE 164. BRAZIL UV CURE COATINGS MARKET SIZE, BY FORM, 2025-2030 (USD MILLION)
- TABLE 165. BRAZIL UV CURE COATINGS MARKET SIZE, BY RESIN TYPE, 2018-2024 (USD MILLION)
- TABLE 166. BRAZIL UV CURE COATINGS MARKET SIZE, BY RESIN TYPE, 2025-2030 (USD MILLION)
- TABLE 167. BRAZIL UV CURE COATINGS MARKET SIZE, BY TECHNOLOGY, 2018-2024 (USD MILLION)
- TABLE 168. BRAZIL UV CURE COATINGS MARKET SIZE, BY TECHNOLOGY, 2025-2030 (USD MILLION)
- TABLE 169. BRAZIL UV CURE COATINGS MARKET SIZE, BY SUBSTRATE, 2018-2024 (USD MILLION)
- TABLE 170. BRAZIL UV CURE COATINGS MARKET SIZE, BY SUBSTRATE, 2025-2030 (USD MILLION)
- TABLE 171. BRAZIL UV CURE COATINGS MARKET SIZE, BY APPLICATION, 2018-2024 (USD MILLION)
- TABLE 172. BRAZIL UV CURE COATINGS MARKET SIZE, BY APPLICATION, 2025-2030 (USD MILLION)
- TABLE 173. BRAZIL UV CURE COATINGS MARKET SIZE, BY END-USE INDUSTRY, 2018-2024 (USD MILLION)
- TABLE 174. BRAZIL UV CURE COATINGS MARKET SIZE, BY END-USE INDUSTRY, 2025-2030 (USD MILLION)
- TABLE 175. ARGENTINA UV CURE COATINGS MARKET SIZE, BY PRODUCT TYPE, 2018-2024 (USD MILLION)
- TABLE 176. ARGENTINA UV CURE COATINGS MARKET SIZE, BY PRODUCT TYPE, 2025-2030 (USD MILLION)
- TABLE 177. ARGENTINA UV CURE COATINGS MARKET SIZE, BY PHOTOINITIATORS, 2018-2024 (USD MILLION)
- TABLE 178. ARGENTINA UV CURE COATINGS MARKET SIZE, BY PHOTOINITIATORS, 2025-2030 (USD MILLION)
- TABLE 179. ARGENTINA UV CURE COATINGS MARKET SIZE, BY FORM, 2018-2024 (USD MILLION)
- TABLE 180. ARGENTINA UV CURE COATINGS MARKET SIZE, BY FORM, 2025-2030 (USD MILLION)
- TABLE 181. ARGENTINA UV CURE COATINGS MARKET SIZE, BY RESIN TYPE, 2018-2024 (USD MILLION)
- TABLE 182. ARGENTINA UV CURE COATINGS MARKET SIZE, BY RESIN TYPE, 2025-2030 (USD MILLION)
- TABLE 183. ARGENTINA UV CURE COATINGS MARKET SIZE, BY TECHNOLOGY, 2018-2024 (USD MILLION)
- TABLE 184. ARGENTINA UV CURE COATINGS MARKET SIZE, BY TECHNOLOGY, 2025-2030 (USD MILLION)
- TABLE 185. ARGENTINA UV CURE COATINGS MARKET SIZE, BY SUBSTRATE, 2018-2024 (USD MILLION)
- TABLE 186. ARGENTINA UV CURE COATINGS MARKET SIZE, BY SUBSTRATE, 2025-2030 (USD MILLION)
- TABLE 187. ARGENTINA UV CURE COATINGS MARKET SIZE, BY APPLICATION, 2018-2024 (USD MILLION)
- TABLE 188. ARGENTINA UV CURE COATINGS MARKET SIZE, BY APPLICATION, 2025-2030 (USD MILLION)
- TABLE 189. ARGENTINA UV CURE COATINGS MARKET SIZE, BY END-USE INDUSTRY, 2018-2024 (USD MILLION)
- TABLE 190. ARGENTINA UV CURE COATINGS MARKET SIZE, BY END-USE INDUSTRY, 2025-2030 (USD MILLION)
- TABLE 191. EUROPE, MIDDLE EAST & AFRICA UV CURE COATINGS MARKET SIZE, BY PRODUCT TYPE, 2018-2024 (USD MILLION)
- TABLE 192. EUROPE, MIDDLE EAST & AFRICA UV CURE COATINGS MARKET SIZE, BY PRODUCT TYPE, 2025-2030 (USD MILLION)
- TABLE 193. EUROPE, MIDDLE EAST & AFRICA UV CURE COATINGS MARKET SIZE, BY PHOTOINITIATORS, 2018-2024 (USD MILLION)
- TABLE 194. EUROPE, MIDDLE EAST & AFRICA UV CURE COATINGS MARKET SIZE, BY PHOTOINITIATORS, 2025-2030 (USD MILLION)
- TABLE 195. EUROPE, MIDDLE EAST & AFRICA UV CURE COATINGS MARKET SIZE, BY FORM, 2018-2024 (USD MILLION)
- TABLE 196. EUROPE, MIDDLE EAST & AFRICA UV CURE COATINGS MARKET SIZE, BY FORM, 2025-2030 (USD MILLION)
- TABLE 197. EUROPE, MIDDLE EAST & AFRICA UV CURE COATINGS MARKET SIZE, BY RESIN TYPE, 2018-2024 (USD MILLION)
- TABLE 198. EUROPE, MIDDLE EAST & AFRICA UV CURE COATINGS MARKET SIZE, BY RESIN TYPE, 2025-2030 (USD MILLION)
- TABLE 199. EUROPE, MIDDLE EAST & AFRICA UV CURE COATINGS MARKET SIZE, BY TECHNOLOGY, 2018-2024 (USD MILLION)
- TABLE 200. EUROPE, MIDDLE EAST & AFRICA UV CURE COATINGS MARKET SIZE, BY TECHNOLOGY, 2025-2030 (USD MILLION)
- TABLE 201. EUROPE, MIDDLE EAST & AFRICA UV CURE COATINGS MARKET SIZE, BY SUBSTRATE, 2018-2024 (USD MILLION)
- TABLE 202. EUROPE, MIDDLE EAST & AFRICA UV CURE COATINGS MARKET SIZE, BY SUBSTRATE, 2025-2030 (USD MILLION)
- TABLE 203. EUROPE, MIDDLE EAST & AFRICA UV CURE COATINGS MARKET SIZE, BY APPLICATION, 2018-2024 (USD MILLION)
- TABLE 204. EUROPE, MIDDLE EAST & AFRICA UV CURE COATINGS MARKET SIZE, BY APPLICATION, 2025-2030 (USD MILLION)
- TABLE 205. EUROPE, MIDDLE EAST & AFRICA UV CURE COATINGS MARKET SIZE, BY END-USE INDUSTRY, 2018-2024 (USD MILLION)
- TABLE 206. EUROPE, MIDDLE EAST & AFRICA UV CURE COATINGS MARKET SIZE, BY END-USE INDUSTRY, 2025-2030 (USD MILLION)
- TABLE 207. EUROPE, MIDDLE EAST & AFRICA UV CURE COATINGS MARKET SIZE, BY COUNTRY, 2018-2024 (USD MILLION)
- TABLE 208. EUROPE, MIDDLE EAST & AFRICA UV CURE COATINGS MARKET SIZE, BY COUNTRY, 2025-2030 (USD MILLION)
- TABLE 209. UNITED KINGDOM UV CURE COATINGS MARKET SIZE, BY PRODUCT TYPE, 2018-2024 (USD MILLION)
- TABLE 210. UNITED KINGDOM UV CURE COATINGS MARKET SIZE, BY PRODUCT TYPE, 2025-2030 (USD MILLION)
- TABLE 211. UNITED KINGDOM UV CURE COATINGS MARKET SIZE, BY PHOTOINITIATORS, 2018-2024 (USD MILLION)
- TABLE 212. UNITED KINGDOM UV CURE COATINGS MARKET SIZE, BY PHOTOINITIATORS, 2025-2030 (USD MILLION)
- TABLE 213. UNITED KINGDOM UV CURE COATINGS MARKET SIZE, BY FORM, 2018-2024 (USD MILLION)
- TABLE 214. UNITED KINGDOM UV CURE COATINGS MARKET SIZE, BY FORM, 2025-2030 (USD MILLION)
- TABLE 215. UNITED KINGDOM UV CURE COATINGS MARKET SIZE, BY RESIN TYPE, 2018-2024 (USD MILLION)
- TABLE 216. UNITED KINGDOM UV CURE COATINGS MARKET SIZE, BY RESIN TYPE, 2025-2030 (USD MILLION)
- TABLE 217. UNITED KINGDOM UV CURE COATINGS MARKET SIZE, BY TECHNOLOGY, 2018-2024 (USD MILLION)
- TABLE 218. UNITED KINGDOM UV CURE COATINGS MARKET SIZE, BY TECHNOLOGY, 2025-2030 (USD MILLION)
- TABLE 219. UNITED KINGDOM UV CURE COATINGS MARKET SIZE, BY SUBSTRATE, 2018-2024 (USD MILLION)
- TABLE 220. UNITED KINGDOM UV CURE COATINGS MARKET SIZE, BY SUBSTRATE, 2025-2030 (USD MILLION)
- TABLE 221. UNITED KINGDOM UV CURE COATINGS MARKET SIZE, BY APPLICATION, 2018-2024 (USD MILLION)
- TABLE 222. UNITED KINGDOM UV CURE COATINGS MARKET SIZE, BY APPLICATION, 2025-2030 (USD MILLION)
- TABLE 223. UNITED KINGDOM UV CURE COATINGS MARKET SIZE, BY END-USE INDUSTRY, 2018-2024 (USD MILLION)
- TABLE 224. UNITED KINGDOM UV CURE COATINGS MARKET SIZE, BY END-USE INDUSTRY, 2025-2030 (USD MILLION)
- TABLE 225. GERMANY UV CURE COATINGS MARKET SIZE, BY PRODUCT TYPE, 2018-2024 (USD MILLION)
- TABLE 226. GERMANY UV CURE COATINGS MARKET SIZE, BY PRODUCT TYPE, 2025-2030 (USD MILLION)
- TABLE 227. GERMANY UV CURE COATINGS MARKET SIZE, BY PHOTOINITIATORS, 2018-2024 (USD MILLION)
- TABLE 228. GERMANY UV CURE COATINGS MARKET SIZE, BY PHOTOINITIATORS, 2025-2030 (USD MILLION)
- TABLE 229. GERMANY UV CURE COATINGS MARKET SIZE, BY FORM, 2018-2024 (USD MILLION)
- TABLE 230. GERMANY UV CURE COATINGS MARKET SIZE, BY FORM, 2025-2030 (USD MILLION)
- TABLE 231. GERMANY UV CURE COATINGS MARKET SIZE, BY RESIN TYPE, 2018-2024 (USD MILLION)
- TABLE 232. GERMANY UV CURE COATINGS MARKET SIZE, BY RESIN TYPE, 2025-2030 (USD MILLION)
- TABLE 233. GERMANY UV CURE COATINGS MARKET SIZE, BY TECHNOLOGY, 2018-2024 (USD MILLION)
- TABLE 234. GERMANY UV CURE COATINGS MARKET SIZE, BY TECHNOLOGY, 2025-2030 (USD MILLION)
- TABLE 235. GERMANY UV CURE COATINGS MARKET SIZE, BY SUBSTRATE, 2018-2024 (USD MILLION)
- TABLE 236. GERMANY UV CURE COATINGS MARKET SIZE, BY SUBSTRATE, 2025-2030 (USD MILLION)
- TABLE 237. GERMANY UV CURE COATINGS MARKET SIZE, BY APPLICATION, 2018-2024 (USD MILLION)
- TABLE 238. GERMANY UV CURE COATINGS MARKET SIZE, BY APPLICATION, 2025-2030 (USD MILLION)
- TABLE 239. GERMANY UV CURE COATINGS MARKET SIZE, BY END-USE INDUSTRY, 2018-2024 (USD MILLION)
- TABLE 240. GERMANY UV CURE COATINGS MARKET SIZE, BY END-USE INDUSTRY, 2025-2030 (USD MILLION)
- TABLE 241. FRANCE UV CURE COATINGS MARKET SIZE, BY PRODUCT TYPE, 2018-2024 (USD MILLION)
- TABLE 242. FRANCE UV CURE COATINGS MARKET SIZE, BY PRODUCT TYPE, 2025-2030 (USD MILLION)
- TABLE 243. FRANCE UV CURE COATINGS MARKET SIZE, BY PHOTOINITIATORS, 2018-2024 (USD MILLION)
- TABLE 244. FRANCE UV CURE COATINGS MARKET SIZE, BY PHOTOINITIATORS, 2025-2030 (USD MILLION)
- TABLE 245. FRANCE UV CURE COATINGS MARKET SIZE, BY FORM, 2018-2024 (USD MILLION)
- TABLE 246. FRANCE UV CURE COATINGS MARKET SIZE, BY FORM, 2025-2030 (USD MILLION)
- TABLE 247. FRANCE UV CURE COATINGS MARKET SIZE, BY RESIN TYPE, 2018-2024 (USD MILLION)
- TABLE 248. FRANCE UV CURE COATINGS MARKET SIZE, BY RESIN TYPE, 2025-2030 (USD MILLION)
- TABLE 249. FRANCE UV CURE COATINGS MARKET SIZE, BY TECHNOLOGY, 2018-2024 (USD MILLION)
- TABLE 250. FRANCE UV CURE COATINGS MARKET SIZE, BY TECHNOLOGY, 2025-2030 (USD MILLION)
- TABLE 251. FRANCE UV CURE COATINGS MARKET SIZE, BY SUBSTRATE, 2018-2024 (USD MILLION)
- TABLE 252. FRANCE UV CURE COATINGS MARKET SIZE, BY SUBSTRATE, 2025-2030 (USD MILLION)
- TABLE 253. FRANCE UV CURE COATINGS MARKET SIZE, BY APPLICATION, 2018-2024 (USD MILLION)
- TABLE 254. FRANCE UV CURE COATINGS MARKET SIZE, BY APPLICATION, 2025-2030 (USD MILLION)
- TABLE 255. FRANCE UV CURE COATINGS MARKET SIZE, BY END-USE INDUSTRY, 2018-2024 (USD MILLION)
- TABLE 256. FRANCE UV CURE COATINGS MARKET SIZE, BY END-USE INDUSTRY, 2025-2030 (USD MILLION)
- TABLE 257. RUSSIA UV CURE COATINGS MARKET SIZE, BY PRODUCT TYPE, 2018-2024 (USD MILLION)
- TABLE 258. RUSSIA UV CURE COATINGS MARKET SIZE, BY PRODUCT TYPE, 2025-2030 (USD MILLION)
- TABLE 259. RUSSIA UV CURE COATINGS MARKET SIZE, BY PHOTOINITIATORS, 2018-2024 (USD MILLION)
- TABLE 260. RUSSIA UV CURE COATINGS MARKET SIZE, BY PHOTOINITIATORS, 2025-2030 (USD MILLION)
- TABLE 261. RUSSIA UV CURE COATINGS MARKET SIZE, BY FORM, 2018-2024 (USD MILLION)
- TABLE 262. RUSSIA UV CURE COATINGS MARKET SIZE, BY FORM, 2025-2030 (USD MILLION)
- TABLE 263. RUSSIA UV CURE COATINGS MARKET SIZE, BY RESIN TYPE, 2018-2024 (USD MILLION)
- TABLE 264. RUSSIA UV CURE COATINGS MARKET SIZE, BY RESIN TYPE, 2025-2030 (USD MILLION)
- TABLE 265. RUSSIA UV CURE COATINGS MARKET SIZE, BY TECHNOLOGY, 2018-2024 (USD MILLION)
- TABLE 266. RUSSIA UV CURE COATINGS MARKET SIZE, BY TECHNOLOGY, 2025-2030 (USD MILLION)
- TABLE 267. RUSSIA UV CURE COATINGS MARKET SIZE, BY SUBSTRATE, 2018-2024 (USD MILLION)
- TABLE 268. RUSSIA UV CURE COATINGS MARKET SIZE, BY SUBSTRATE, 2025-2030 (USD MILLION)
- TABLE 269. RUSSIA UV CURE COATINGS MARKET SIZE, BY APPLICATION, 2018-2024 (USD MILLION)
- TABLE 270. RUSSIA UV CURE COATINGS MARKET SIZE, BY APPLICATION, 2025-2030 (USD MILLION)
- TABLE 271. RUSSIA UV CURE COATINGS MARKET SIZE, BY END-USE INDUSTRY, 2018-2024 (USD MILLION)
- TABLE 272. RUSSIA UV CURE COATINGS MARKET SIZE, BY END-USE INDUSTRY, 2025-2030 (USD MILLION)
- TABLE 273. ITALY UV CURE COATINGS MARKET SIZE, BY PRODUCT TYPE, 2018-2024 (USD MILLION)
- TABLE 274. ITALY UV CURE COATINGS MARKET SIZE, BY PRODUCT TYPE, 2025-2030 (USD MILLION)
- TABLE 275. ITALY UV CURE COATINGS MARKET SIZE, BY PHOTOINITIATORS, 2018-2024 (USD MILLION)
- TABLE 276. ITALY UV CURE COATINGS MARKET SIZE, BY PHOTOINITIATORS, 2025-2030 (USD MILLION)
- TABLE 277. ITALY UV CURE COATINGS MARKET SIZE, BY FORM, 2018-2024 (USD MILLION)
- TABLE 278. ITALY UV CURE COATINGS MARKET SIZE, BY FORM, 2025-2030 (USD MILLION)
- TABLE 279. ITALY UV CURE COATINGS MARKET SIZE, BY RESIN TYPE, 2018-2024 (USD MILLION)
- TABLE 280. ITALY UV CURE COATINGS MARKET SIZE, BY RESIN TYPE, 2025-2030 (USD MILLION)
- TABLE 281. ITALY UV CURE COATINGS MARKET SIZE, BY TECHNOLOGY, 2018-2024 (USD MILLION)
- TABLE 282. ITALY UV CURE COATINGS MARKET SIZE, BY TECHNOLOGY, 2025-2030 (USD MILLION)
- TABLE 283. ITALY UV CURE COATINGS MARKET SIZE, BY SUBSTRATE, 2018-2024 (USD MILLION)
- TABLE 284. ITALY UV CURE COATINGS MARKET SIZE, BY SUBSTRATE, 2025-2030 (USD MILLION)
- TABLE 285. ITALY UV CURE COATINGS MARKET SIZE, BY APPLICATION, 2018-2024 (USD MILLION)
- TABLE 286. ITALY UV CURE COATINGS MARKET SIZE, BY APPLICATION, 2025-2030 (USD MILLION)
- TABLE 287. ITALY UV CURE COATINGS MARKET SIZE, BY END-USE INDUSTRY, 2018-2024 (USD MILLION)
- TABLE 288. ITALY UV CURE COATINGS MARKET SIZE, BY END-USE INDUSTRY, 2025-2030 (USD MILLION)
- TABLE 289. SPAIN UV CURE COATINGS MARKET SIZE, BY PRODUCT TYPE, 2018-2024 (USD MILLION)
- TABLE 290. SPAIN UV CURE COATINGS MARKET SIZE, BY PRODUCT TYPE, 2025-2030 (USD MILLION)
- TABLE 291. SPAIN UV CURE COATINGS MARKET SIZE, BY PHOTOINITIATORS, 2018-2024 (USD MILLION)
- TABLE 292. SPAIN UV CURE COATINGS MARKET SIZE, BY PHOTOINITIATORS, 2025-2030 (USD MILLION)
- TABLE 293. SPAIN UV CURE COATINGS MARKET SIZE, BY FORM, 2018-2024 (USD MILLION)
- TABLE 294. SPAIN UV CURE COATINGS MARKET SIZE, BY FORM, 2025-2030 (USD MILLION)
- TABLE 295. SPAIN UV CURE COATINGS MARKET SIZE, BY RESIN TYPE, 2018-2024 (USD MILLION)
- TABLE 296. SPAIN UV CURE COATINGS MARKET SIZE, BY RESIN TYPE, 2025-2030 (USD MILLION)
- TABLE 297. SPAIN UV CURE COATINGS MARKET SIZE, BY TECHNOLOGY, 2018-2024 (USD MILLION)
- TABLE 298. SPAIN UV CURE COATINGS MARKET SIZE, BY TECHNOLOGY, 2025-2030 (USD MILLION)
- TABLE 299. SPAIN UV CURE COATINGS MARKET SIZE, BY SUBSTRATE, 2018-2024 (USD MILLION)
- TABLE 300. SPAIN UV CURE COATINGS MARKET SIZE, BY SUBSTRATE, 2025-2030 (USD MILLION)
- TABLE 301. SPAIN UV CURE COATINGS MARKET SIZE, BY APPLICATION, 2018-2024 (USD MILLION)
- TABLE 302. SPAIN UV CURE COATINGS MARKET SIZE, BY APPLICATION, 2025-2030 (USD MILLION)
- TABLE 303. SPAIN UV CURE COATINGS MARKET SIZE, BY END-USE INDUSTRY, 2018-2024 (USD MILLION)
- TABLE 304. SPAIN UV CURE COATINGS MARKET SIZE, BY END-USE INDUSTRY, 2025-2030 (USD MILLION)
- TABLE 305. UNITED ARAB EMIRATES UV CURE COATINGS MARKET SIZE, BY PRODUCT TYPE, 2018-2024 (USD MILLION)
- TABLE 306. UNITED ARAB EMIRATES UV CURE COATINGS MARKET SIZE, BY PRODUCT TYPE, 2025-2030 (USD MILLION)
- TABLE 307. UNITED ARAB EMIRATES UV CURE COATINGS MARKET SIZE, BY PHOTOINITIATORS, 2018-2024 (USD MILLION)
- TABLE 308. UNITED ARAB EMIRATES UV CURE COATINGS MARKET SIZE, BY PHOTOINITIATORS, 2025-2030 (USD MILLION)
- TABLE 309. UNITED ARAB EMIRATES UV CURE COATINGS MARKET SIZE, BY FORM, 2018-2024 (USD MILLION)
- TABLE 310. UNITED ARAB EMIRATES UV CURE COATINGS MARKET SIZE, BY FORM, 2025-2030 (USD MILLION)
- TABLE 311. UNITED ARAB EMIRATES UV CURE COATINGS MARKET SIZE, BY RESIN TYPE, 2018-2024 (USD MILLION)
- TABLE 312. UNITED ARAB EMIRATES UV CURE COATINGS MARKET SIZE, BY RESIN TYPE, 2025-2030 (USD MILLION)
- TABLE 313. UNITED ARAB EMIRATES UV CURE COATINGS MARKET SIZE, BY TECHNOLOGY, 2018-2024 (USD MILLION)
- TABLE 314. UNITED ARAB EMIRATES UV CURE COATINGS MARKET SIZE, BY TECHNOLOGY, 2025-2030 (USD MILLION)
- TABLE 315. UNITED ARAB EMIRATES UV CURE COATINGS MARKET SIZE, BY SUBSTRATE, 2018-2024 (USD MILLION)
- TABLE 316. UNITED ARAB EMIRATES UV CURE COATINGS MARKET SIZE, BY SUBSTRATE, 2025-2030 (USD MILLION)
- TABLE 317. UNITED ARAB EMIRATES UV CURE COATINGS MARKET SIZE, BY APPLICATION, 2018-2024 (USD MILLION)
- TABLE 318. UNITED ARAB EMIRATES UV CURE COATINGS MARKET SIZE, BY APPLICATION, 2025-2030 (USD MILLION)
- TABLE 319. UNITED ARAB EMIRATES UV CURE COATINGS MARKET SIZE, BY END-USE INDUSTRY, 2018-2024 (USD MILLION)
- TABLE 320. UNITED ARAB EMIRATES UV CURE COATINGS MARKET SIZE, BY END-USE INDUSTRY, 2025-2030 (USD MILLION)
- TABLE 321. SAUDI ARABIA UV CURE COATINGS MARKET SIZE, BY PRODUCT TYPE, 2018-2024 (USD MILLION)
- TABLE 322. SAUDI ARABIA UV CURE COATINGS MARKET SIZE, BY PRODUCT TYPE, 2025-2030 (USD MILLION)
- TABLE 323. SAUDI ARABIA UV CURE COATINGS MARKET SIZE, BY PHOTOINITIATORS, 2018-2024 (USD MILLION)
- TABLE 324. SAUDI ARABIA UV CURE COATINGS MARKET SIZE, BY PHOTOINITIATORS, 2025-2030 (USD MILLION)
- TABLE 325. SAUDI ARABIA UV CURE COATINGS MARKET SIZE, BY FORM, 2018-2024 (USD MILLION)
- TABLE 326. SAUDI ARABIA UV CURE COATINGS MARKET SIZE, BY FORM, 2025-2030 (USD MILLION)
- TABLE 327. SAUDI ARABIA UV CURE COATINGS MARKET SIZE, BY RESIN TYPE, 2018-2024 (USD MILLION)
- TABLE 328. SAUDI ARABIA UV CURE COATINGS MARKET SIZE, BY RESIN TYPE, 2025-2030 (USD MILLION)
- TABLE 329. SAUDI ARABIA UV CURE COATINGS MARKET SIZE, BY TECHNOLOGY, 2018-2024 (USD MILLION)
- TABLE 330. SAUDI ARABIA UV CURE COATINGS MARKET SIZE, BY TECHNOLOGY, 2025-2030 (USD MILLION)
- TABLE 331. SAUDI ARABIA UV CURE COATINGS MARKET SIZE, BY SUBSTRATE, 2018-2024 (USD MILLION)
- TABLE 332. SAUDI ARABIA UV CURE COATINGS MARKET SIZE, BY SUBSTRATE, 2025-2030 (USD MILLION)
- TABLE 333. SAUDI ARABIA UV CURE COATINGS MARKET SIZE, BY APPLICATION, 2018-2024 (USD MILLION)
- TABLE 334. SAUDI ARABIA UV CURE COATINGS MARKET SIZE, BY APPLICATION, 2025-2030 (USD MILLION)
- TABLE 335. SAUDI ARABIA UV CURE COATINGS MARKET SIZE, BY END-USE INDUSTRY, 2018-2024 (USD MILLION)
- TABLE 336. SAUDI ARABIA UV CURE COATINGS MARKET SIZE, BY END-USE INDUSTRY, 2025-2030 (USD MILLION)
- TABLE 337. SOUTH AFRICA UV CURE COATINGS MARKET SIZE, BY PRODUCT TYPE, 2018-2024 (USD MILLION)
- TABLE 338. SOUTH AFRICA UV CURE COATINGS MARKET SIZE, BY PRODUCT TYPE, 2025-2030 (USD MILLION)
- TABLE 339. SOUTH AFRICA UV CURE COATINGS MARKET SIZE, BY PHOTOINITIATORS, 2018-2024 (USD MILLION)
- TABLE 340. SOUTH AFRICA UV CURE COATINGS MARKET SIZE, BY PHOTOINITIATORS, 2025-2030 (USD MILLION)
- TABLE 341. SOUTH AFRICA UV CURE COATINGS MARKET SIZE, BY FORM, 2018-2024 (USD MILLION)
- TABLE 342. SOUTH AFRICA UV CURE COATINGS MARKET SIZE, BY FORM, 2025-2030 (USD MILLION)
- TABLE 343. SOUTH AFRICA UV CURE COATINGS MARKET SIZE, BY RESIN TYPE, 2018-2024 (USD MILLION)
- TABLE 344. SOUTH AFRICA UV CURE COATINGS MARKET SIZE, BY RESIN TYPE, 2025-2030 (USD MILLION)
- TABLE 345. SOUTH AFRICA UV CURE COATINGS MARKET SIZE, BY TECHNOLOGY, 2018-2024 (USD MILLION)
- TABLE 346. SOUTH AFRICA UV CURE COATINGS MARKET SIZE, BY TECHNOLOGY, 2025-2030 (USD MILLION)
- TABLE 347. SOUTH AFRICA UV CURE COATINGS MARKET SIZE, BY SUBSTRATE, 2018-2024 (USD MILLION)
- TABLE 348. SOUTH AFRICA UV CURE COATINGS MARKET SIZE, BY SUBSTRATE, 2025-2030 (USD MILLION)
- TABLE 349. SOUTH AFRICA UV CURE COATINGS MARKET SIZE, BY APPLICATION, 2018-2024 (USD MILLION)
- TABLE 350. SOUTH AFRICA UV CURE COATINGS MARKET SIZE, BY APPLICATION, 2025-2030 (USD MILLION)
- TABLE 351. SOUTH AFRICA UV CURE COATINGS MARKET SIZE, BY END-USE INDUSTRY, 2018-2024 (USD MILLION)
- TABLE 352. SOUTH AFRICA UV CURE COATINGS MARKET SIZE, BY END-USE INDUSTRY, 2025-2030 (USD MILLION)
- TABLE 353. DENMARK UV CURE COATINGS MARKET SIZE, BY PRODUCT TYPE, 2018-2024 (USD MILLION)
- TABLE 354. DENMARK UV CURE COATINGS MARKET SIZE, BY PRODUCT TYPE, 202
The UV Cure Coatings Market was valued at USD 5.66 billion in 2024 and is projected to grow to USD 6.00 billion in 2025, with a CAGR of 6.34%, reaching USD 8.19 billion by 2030.
| KEY MARKET STATISTICS | |
|---|---|
| Base Year [2024] | USD 5.66 billion |
| Estimated Year [2025] | USD 6.00 billion |
| Forecast Year [2030] | USD 8.19 billion |
| CAGR (%) | 6.34% |
Igniting the UV Cure Coatings Market Landscape with Foundational Context, Defining Innovations, and Core Drivers Shaping Future Industry Trajectories
UV cure coatings have become indispensable in industries ranging from electronics to automotive, offering rapid curing times, superior surface properties, and enhanced sustainability compared with conventional solvent-based systems. As manufacturers strive to meet escalating performance requirements and regulatory standards, the demand for UV cure formulations that offer durability, chemical resistance, and low environmental impact has surged. These coatings leverage photoinitiators to trigger polymerization under ultraviolet light, enabling faster production cycles and reduced energy consumption. In turn, end-use sectors benefit from streamlined operations and lower total cost of ownership.
This executive summary introduces a holistic analysis of the UV cure coatings market, focusing on transformative trends, policy influences, and segmentation dynamics. It outlines emerging technological breakthroughs, evaluates the cumulative effects of recent regulatory measures, and delivers strategic insights across regional markets. Through rigorous research methods, this report synthesizes expert viewpoints, empirical data, and case examples to equip stakeholders with actionable intelligence. Decision-makers will find clarity on the competitive landscape, growth drivers, and potential challenges that lie ahead. As market conditions evolve, this comprehensive overview sets the stage for informed strategic planning and competitive differentiation within the UV cure coatings sector.
Revolutionizing UV Cure Coatings Through Disruptive Technological Advances, Sustainability Trends, and Digital Integration Redefining Market Dynamics
The UV cure coatings sector is currently experiencing a wave of transformative change driven by technological innovation and evolving sustainability demands. Recent breakthroughs in UV LED curing technology have accelerated adoption by offering longer lamp lifespans, reduced heat output, and lower energy consumption compared to traditional mercury-arc systems. As manufacturers integrate digital controls and automation, production lines are becoming more efficient, allowing precise control over curing parameters and real-time quality monitoring.
Concurrently, regulatory frameworks and customer expectations around environmental impact have prompted a shift toward low-migration formulations and bio-based raw materials. Photoinitiator chemistries are being reformulated to minimize potential toxicity, while oligomers and monomers derived from renewable resources are gaining traction. These shifts are compelling suppliers to innovate collaboratively with end-users, fostering co-development partnerships that accelerate new product introductions.
Moreover, the convergence of Industry 4.0 principles with traditional coatings manufacturing is reshaping operational models. Data analytics and predictive maintenance are enhancing equipment uptime and yield, while digital supply chain solutions are improving traceability. As the industry navigates these transformative shifts, the competitive landscape is defined by those who can marry technical excellence with sustainable practices and agile business processes.
Assessing the Cumulative Effects of United States Tariff Measures on UV Cure Coatings in 2025 and Their Implications for Global Supply Chains
In 2025, the continuation and expansion of United States tariffs on UV cure coatings and key raw materials have exerted a compound impact on global supply chains and cost structures. Initial levies introduced stress on importers of photoinitiators and specialty monomers, prompting reactive price adjustments upstream. As these duties accumulated, manufacturers faced margin pressures that necessitated the reassessment of sourcing strategies and manufacturing footprints.
Consequently, supply chain resilience has become a strategic priority. Companies have diversified procurement bases by seeking alternative suppliers in regions unaffected by U.S. tariff measures, while others have explored backward integration initiatives to secure critical raw materials. These adaptations have introduced complexity and overhead but have also unlocked opportunities to renegotiate long-term contracts and engage local partners.
Furthermore, the pass-through of tariff-induced costs to end-users has varied by application segment, with high-value electronics coatings bearing a greater share of price inflation compared to commoditized wood and paper coatings. In response, some end-use companies have accelerated product reformulations to optimize performance-to-cost ratios, while others are turning to in-house curing technologies to mitigate dependency on imported solutions. Collectively, these measures illustrate how cumulative tariff effects have reshaped competitive dynamics and driven industry participants toward more strategic supply chain alignment.
Unveiling Segmentation Patterns Across Product Types, Formulations, Resin Categories, Technologies, Substrates, Applications, and End-Use Industries
The UV cure coatings market exhibits multifaceted segmentation that reflects its complex end-user requirements and technological diversity. By product type, the landscape encompasses additives, monomers, oligomers, and photoinitiators further divided into Type I and Type II categories, each facilitating specific polymerization pathways and performance characteristics. In the realm of formulation, liquid systems continue to dominate high-speed industrial applications, while powder coatings are gaining ground in eco-friendly segments due to their solvent-free profiles and minimal emissions.
When considering resin types, epoxy, polyacrylate, polyester, silicone, and urethane variants each deliver distinct mechanical, chemical, and optical properties, enabling tailor-made solutions for diverse substrate interactions. Technological segmentation uncovers the varied curing platforms in use-arc lamp, electron beam, excimer lamp, and UV LED-where throughput, energy utilization, and spectral specificity guide selection criteria. Substrates ranging from ceramic and metal to paper, plastic, textile, and wood highlight the versatility of UV cure coatings across sectors, while applications in electronic, metal, optical fiber, plastic, and wood coatings showcase how specialized formulation requirements address adhesion, flexibility, and protective performance.
Finally, the end-use industry perspective spans automotive, electronics & electrical, furniture & woodworking, packaging, and printing & graphic arts, each demanding unique property matrices. This nuanced segmentation reveals opportunities for suppliers to align R&D investments, channel strategies, and customer support models with the precise needs of each submarket.
Mapping Regional Nuances and Demand Drivers in the UV Cure Coatings Market Across Americas, Europe Middle East and Africa, and Asia-Pacific
Regional dynamics in the UV cure coatings market demonstrate varied growth trajectories and demand drivers. In the Americas, robust activity in automotive manufacturing and advanced electronics assembly fuels interest in high-performance epoxy and polyacrylate systems. Sustainability mandates and circular economy initiatives have also amplified the adoption of solvent-free powder technologies and renewable-source resins, particularly in packaging and printing applications.
Meanwhile, Europe, the Middle East, and Africa exhibit a pronounced regulatory focus on chemical safety and emissions control, leading to accelerated reformulation efforts and a push toward low-migration photoinitiators. The presence of major OEMs in automotive, aerospace, and industrial equipment has created a demand for specialized coatings that meet stringent performance and environmental standards, while emerging markets in the Middle East show early signs of growth in infrastructure and construction applications.
In the Asia-Pacific region, rapid industrialization and expanding consumer electronics production underpin substantial demand for UV LED curing platforms, driven by their energy efficiency and compact footprint. Additionally, the rise of furniture, textile, and woodworking industries has created a parallel surge in decorative and protective coatings. As regional players invest in local manufacturing and R&D, they are also collaborating globally to leverage best-in-class technologies and address evolving customer requirements across diverse market segments.
Navigating Competitive Landscapes with Strategic Intelligence on Leading UV Cure Coatings Manufacturers, Innovators, and Technology Partners
Competitive dynamics in the UV cure coatings industry are shaped by both global chemical conglomerates and specialized technology innovators. Major coatings manufacturers leverage extensive formulator networks and integrated production capabilities to deliver end-to-end solutions, while photoinitiator specialists focus on advanced chemistries that enable faster cure speeds and deeper penetration. Equipment providers that design optimized lamp and LED systems collaborate closely with raw material suppliers to ensure compatibility and performance consistency.
Strategic partnerships and mergers have become prevalent as companies seek to expand their product portfolios, scale manufacturing capacities, and enter high-growth segments. Joint development agreements between formulators and end-users have accelerated time to market for customized solutions in electronics assembly and industrial finishing. At the same time, niche players are differentiating through rapid prototyping services, digital application tools, and sustainability certifications that address specific regulatory and customer requirements.
Furthermore, competitive positioning is increasingly influenced by geographic presence. Firms with local production and technical service centers in key regions are better equipped to respond swiftly to demand fluctuations and regulatory changes. As the market matures, the ability to integrate supply chain transparency, digital support tools, and value-added services will be a critical driver of differentiation among leading and emerging companies alike.
Actionable Strategic Imperatives for Industry Leaders to Drive Growth, Operational Excellence, and Sustainable Innovation in UV Cure Coatings
To succeed in the evolving UV cure coatings market, industry leaders should prioritize investment in next-generation curing technologies that deliver improved energy efficiency and reduced maintenance costs. Accelerating the transition to UV LED platforms will not only address sustainability targets but also enhance operational uptime and throughput flexibility. Simultaneously, companies must deepen collaborations with raw material innovators to co-develop bio-based monomers and low-migration photoinitiators that anticipate tightening regulatory standards.
Strengthening supply chain resilience through diversified sourcing and strategic inventory management will mitigate the impact of geopolitical disruptions and tariff volatility. Organizations should conduct thorough supplier audits, establish alternative procurement channels, and consider localized manufacturing hubs to reduce lead times and currency exposure. Additionally, integrating digital supply chain platforms can provide real-time visibility and predictive analytics that inform proactive decision-making.
Finally, fostering a culture of continuous innovation and customer engagement will differentiate market participants. By offering tailored technical support, application training, and digital formulation tools, suppliers can reinforce value-added partnerships. Equally important is investing in workforce upskilling to ensure teams possess the knowledge and agility needed to deploy complex UV cure solutions across diverse industrial environments.
Comprehensive Research Methodology Integrating Primary Interviews, Secondary Data Verification, and Rigorous Analytical Frameworks for Reliability
This analysis is built upon a rigorous research framework that integrates both primary and secondary data streams. Extensive interviews were conducted with C-suite executives, R&D leaders, and plant managers across coatings manufacturers, equipment suppliers, and end-user industries to capture firsthand perspectives on market trends, technology adoption, and strategic priorities. These qualitative insights were supplemented by secondary research encompassing peer-reviewed journals, industry white papers, and regulatory publications to validate key findings.
Data triangulation methodologies ensured the consistency and reliability of information, with cross-referencing across multiple sources to identify convergent themes and outliers. Quantitative data points were subject to statistical checks and variance analysis to ascertain accuracy. Furthermore, scenario planning models were employed to test the implications of tariff changes, raw material disruptions, and technology adoption rates under a range of plausible market conditions.
Throughout the research process, quality assurance protocols, including expert review panels and iterative feedback loops, were implemented to refine assumptions and enhance analytical rigor. The resulting intelligence offers a comprehensive, balanced, and actionable view of the UV cure coatings market landscape.
Synthesizing Core Findings and Strategic Implications to Guide Stakeholders Through the Evolving UV Cure Coatings Market Ecosystem
The UV cure coatings industry stands at a pivotal juncture, where technological innovation, regulatory shifts, and evolving end-use demands converge to reshape market dynamics. Advancements in UV LED curing, sustainable chemistries, and digital integration are unlocking new performance frontiers and redefining cost structures. At the same time, tariff-induced supply chain realignments and regional growth disparities underscore the importance of strategic resilience and localized agility.
Segmentation insights reveal that success lies in aligning product development with precise application and end-user requirements, from automotive and electronics to furniture and packaging. Regional analysis highlights the need for tailored approaches that account for regulatory landscapes, infrastructure maturity, and industrial priorities across the Americas, EMEA, and Asia-Pacific.
As competition intensifies, companies that cultivate strategic partnerships, invest in R&D for eco-friendly solutions, and leverage digital tools will be best positioned to capture value. By proactively addressing cost pressures, supply chain vulnerabilities, and sustainability mandates, stakeholders can navigate complexity and drive profitable growth in this rapidly evolving market environment.
Table of Contents
1. Preface
- 1.1. Objectives of the Study
- 1.2. Market Segmentation & Coverage
- 1.3. Years Considered for the Study
- 1.4. Currency & Pricing
- 1.5. Language
- 1.6. Stakeholders
2. Research Methodology
- 2.1. Define: Research Objective
- 2.2. Determine: Research Design
- 2.3. Prepare: Research Instrument
- 2.4. Collect: Data Source
- 2.5. Analyze: Data Interpretation
- 2.6. Formulate: Data Verification
- 2.7. Publish: Research Report
- 2.8. Repeat: Report Update
3. Executive Summary
4. Market Overview
- 4.1. Introduction
- 4.2. Market Sizing & Forecasting
5. Market Dynamics
- 5.1. Integration of UV LED curing systems to reduce energy consumption and maintenance costs
- 5.2. Development of low-migration UV curing inks for food packaging applications
- 5.3. Formulation of waterborne UV cure coatings for low volatile organic compound compliance
- 5.4. Adoption of nanoparticle additives to enhance scratch resistance and surface hardness in UV coatings
- 5.5. Digital UV inkjet printing formulations optimized for variable data packaging workflows
- 5.6. Expansion of high-speed UV curing lines for automotive composite and plastic part production
- 5.7. Research into self-healing UV cures triggered by specific wavelengths for smart coating solutions
6. Market Insights
- 6.1. Porter's Five Forces Analysis
- 6.2. PESTLE Analysis
7. Cumulative Impact of United States Tariffs 2025
8. UV Cure Coatings Market, by Product Type
- 8.1. Introduction
- 8.2. Additives
- 8.3. Monomers
- 8.4. Oligomers
- 8.5. Photoinitiators
- 8.5.1. Type I
- 8.5.2. Type II
9. UV Cure Coatings Market, by Form
- 9.1. Introduction
- 9.2. Liquid
- 9.3. Powder
10. UV Cure Coatings Market, by Resin Type
- 10.1. Introduction
- 10.2. Epoxy
- 10.3. Polyacrylate
- 10.4. Polyester
- 10.5. Silicone
- 10.6. Urethane
11. UV Cure Coatings Market, by Technology
- 11.1. Introduction
- 11.2. Arc Lamp Curing
- 11.3. Electron Beam (EB) Curing
- 11.4. Excimer Lamp Curing
- 11.5. UV LED Curing
12. UV Cure Coatings Market, by Substrate
- 12.1. Introduction
- 12.2. Ceramic
- 12.3. Metal
- 12.4. Paper
- 12.5. Plastic
- 12.6. Textile
- 12.7. Wood
13. UV Cure Coatings Market, by Application
- 13.1. Introduction
- 13.2. Electronic Coatings
- 13.3. Metal Coatings
- 13.4. Optical Fiber Coatings
- 13.5. Plastic Coatings
- 13.6. Wood Coatings
14. UV Cure Coatings Market, by End-Use Industry
- 14.1. Introduction
- 14.2. Automotive
- 14.3. Electronics & Electrical
- 14.4. Furniture & Woodworking
- 14.5. Packaging
- 14.6. Printing & Graphic Arts
15. Americas UV Cure Coatings Market
- 15.1. Introduction
- 15.2. United States
- 15.3. Canada
- 15.4. Mexico
- 15.5. Brazil
- 15.6. Argentina
16. Europe, Middle East & Africa UV Cure Coatings Market
- 16.1. Introduction
- 16.2. United Kingdom
- 16.3. Germany
- 16.4. France
- 16.5. Russia
- 16.6. Italy
- 16.7. Spain
- 16.8. United Arab Emirates
- 16.9. Saudi Arabia
- 16.10. South Africa
- 16.11. Denmark
- 16.12. Netherlands
- 16.13. Qatar
- 16.14. Finland
- 16.15. Sweden
- 16.16. Nigeria
- 16.17. Egypt
- 16.18. Turkey
- 16.19. Israel
- 16.20. Norway
- 16.21. Poland
- 16.22. Switzerland
17. Asia-Pacific UV Cure Coatings Market
- 17.1. Introduction
- 17.2. China
- 17.3. India
- 17.4. Japan
- 17.5. Australia
- 17.6. South Korea
- 17.7. Indonesia
- 17.8. Thailand
- 17.9. Philippines
- 17.10. Malaysia
- 17.11. Singapore
- 17.12. Vietnam
- 17.13. Taiwan
18. Competitive Landscape
- 18.1. Market Share Analysis, 2024
- 18.2. FPNV Positioning Matrix, 2024
- 18.3. Competitive Analysis
- 18.3.1. 3M Company
- 18.3.2. Akzo Nobel N.V.
- 18.3.3. Allnex N.V.
- 18.3.4. Ashland Global Holdings Inc.
- 18.3.5. Axalta Coating Systems Ltd.
- 18.3.6. BASF SE
- 18.3.7. DIC Corporation
- 18.3.8. Dow Inc.
- 18.3.9. DuPont de Nemours, Inc.
- 18.3.10. Henkel AG & Co. KGaA
- 18.3.11. Kansai Paint Co., Ltd.
- 18.3.12. Kuraray Co., Ltd.
- 18.3.13. Polyweave International LLC
- 18.3.14. PPG Industries, Inc.
- 18.3.15. Royal DSM N.V.
- 18.3.16. RPM International Inc.
- 18.3.17. Sun Chemical Corporation
- 18.3.18. The Sherwin-Williams Company
- 18.3.19. Dymax Corporation
- 18.3.20. Miwon Specialty Chemical Co., Ltd.
