|
|
市場調査レポート
商品コード
1808470
ServiceNowビジネス市場:サービス別、組織規模別、エンドユーザー別、展開モデル別-2025-2030年の世界予測ServiceNow Business Market by Services, Organization Size, End-User, Deployment Model - Global Forecast 2025-2030 |
||||||

|
|||||||
カスタマイズ可能
適宜更新あり
|
|||||||

| ServiceNowビジネス市場:サービス別、組織規模別、エンドユーザー別、展開モデル別-2025-2030年の世界予測 |
|
出版日: 2025年08月28日
発行: 360iResearch
ページ情報: 英文 186 Pages
納期: 即日から翌営業日
|

概要
ServiceNowビジネス市場は、2024年には464億米ドルとなり、2025年には528億6,000万米ドル、CAGR14.26%で成長し、2030年には1,032億7,000万米ドルに達すると予測されています。
| 主な市場の統計 | |
|---|---|
| 基準年2024 | 464億米ドル |
| 推定年2025 | 528億6,000万米ドル |
| 予測年2030 | 1,032億7,000万米ドル |
| CAGR(%) | 14.26% |
ServiceNowソリューションが現代企業のオペレーショナル・エクセレンスと戦略的価値をどのように促進するか、包括的なイントロダクションを確立します
サービス提供の最適化、ワークフローの迅速化、シームレスなユーザーエクスペリエンスの実現を目指し、世界中の組織が大きなデジタルトランスフォーメーションを進めています。このような状況において、複雑なプロセスを自動化し、エンドツーエンドの可視性を提供できる堅牢なエンタープライズ・プラットフォームは、もはやオプションではなく、戦略上の必須要件となっています。ServiceNowは、統合されたサービス管理モジュールと直感的なローコード開発、インテリジェントな自動化を組み合わせることで、IT運用、カスタマーサポート、HRサービス提供、セキュリティ監視にまたがる課題に対応し、他社と一線を画しています。その結果、利害関係者はサイロ化されたシステムを統一アーキテクチャに置き換えることができ、運用上の摩擦やオーバーヘッドを削減しながら、価値実現までの時間を短縮することができます。
ServiceNowの採用を再構築し、業界全体で次世代デジタルワークフローを推進する重要な転換期を探る
企業の優先事項の急速な進化は、組織がサービス管理プラットフォームをどのように採用し、展開するかに直接影響する一連の変革的シフトに火をつけました。第一に、デジタル・ファーストの業務が重視されるようになり、リモート・ワーク・モデルによって、クラウドネイティブなソリューションとローコード開発が、俊敏性を実現する中核的な存在として注目されています。企業は現在、迅速なデプロイサイクル、シームレスなユーザー体験、予測不可能な需要パターンに合わせて拡張できる適応型アーキテクチャを優先しています。このシフトは、リアルタイムのコラボレーション、セルフサービスポータル、セキュアなリモートアクセスをサポートするプラットフォームコンポーネントの重要性を強調しています。
2025年米国関税のServiceNowオペレーション、サプライチェーン、グローバルサービスデリバリー戦略への広範な累積的影響の分析
2025年の新関税スケジュールが発表されて以来、ハードウェア・コンポーネントと付帯サービスに依存している企業は、コスト構造とデリバリー・モデルを見直す必要に迫られています。プラットフォーム自体は主にソフトウエアベースのままだが、オンプレミスの導入をサポートする多くの組織は、調達やインフラ戦略全体に波及効果を経験しています。例えば、ネットワーク機器、サーバー・シャーシ、ストレージ・アレイに課された関税は、取得コストの上昇とリードタイムの長期化をもたらし、ハードウェアの更新サイクルと設備投資計画の見直しを促しています。
サービス、組織規模、エンドユーザー業種、ServiceNowソリューションの導入形態にまたがるセグメンテーション別重要な洞察の発見
詳細なセグメンテーション分析により、プラットフォームのモジュール式アーキテクチャは、顧客サービス管理や人事サービスデリバリから、ITビジネス管理、IT運用管理、ITサービス管理、セキュリティ運用まで、幅広い機能ドメインに対応していることが明らかになりました。ITサービス管理は多くの企業にとって最初の導入ポイントとなることが多いが、より成熟したデジタルトランスフォーメーション・イニシアチブは、統合データモデルを活用して部門間のサイロを排除しながら、セキュリティや人事のワークフローにまで広がっています。その結果、戦略的に導入を進める企業は、価値の実現を加速させ、より幅広い組織の賛同を得ることができます。
南北アメリカ、欧州・中東・アフリカ、アジア太平洋市場におけるServiceNowの導入と成長パターンに影響を与える重要な地域力学の解明
最新のサービス管理プラットフォームの導入および実装戦略を形成する上で、地域のダイナミクスは極めて重要な役割を果たします。南北アメリカでは、堅牢なクラウドインフラと確立されたプロフェッショナルサービスネットワークを特徴とする成熟したテクノロジエコシステムの恩恵を受けています。特に北米の企業は、迅速なイノベーション・サイクルと高度なアナリティクスを優先し、中南米市場はレガシー・システムのギャップを埋め、顧客エンゲージメントを強化することに重点を置いています。その結果、これらの地域のサービス提供モデルは、競争上の差別化を維持するために、俊敏性、パフォーマンスの最適化、シームレスなユーザー体験を重視しています。
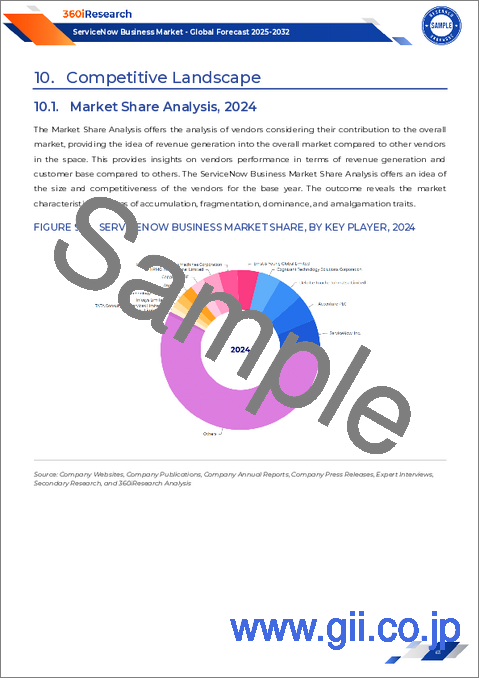
市場をリードする主要なServiceNowパートナーとインテグレータの戦略的動きと競合差別化要因の浮き彫り
主要なエコシステム・プレイヤーの競争力を検証すると、グローバルな大手コンサルタント会社やシステム・インテグレーターが、成長する市場機会を獲得するために、プラットフォーム周辺のサービス・ポートフォリオを積極的に拡大していることがわかります。アクセンチュア(Accenture)やデロイト(Deloitte)などの企業は、専用のセンター・オブ・エクセレンスへの投資を強化し、エンドツーエンドのマイグレーション、マネージドサービス、業界固有のアクセラレーターを提供しています。確立された手法のフレームワークと独自のツールキットを組み合わせることで、これらのインテグレーターは、導入期間を短縮し、複雑な企業ランドスケープに一貫した成果を提供することができます。
ServiceNowの価値を最大化し、運用を最適化し、デジタルトランスフォーメーションのイニシアチブを加速するための、業界リーダー向けの実用的な戦略的推奨事項を提示します
プラットフォームの可能性を最大限に活用し、持続可能なビジネス成果を推進するために、経営幹部は利害関係者を調整し、成功指標を定義する明確なガバナンスフレームワークの確立を優先する必要があります。部門横断的な運営委員会を設置し、継続的な改善に焦点を当てたセンター・オブ・エクセレンスを組み込むことで、組織はロードマップの実行を組織化し、重要なイニシアチブに対する説明責任を確保することができます。この構造には、定期的なパフォーマンスレビュー、エンドユーザーからのフィードバックループ、透明性の高い報告メカニズムを組み込むべきです。
ServiceNow市場分析における堅牢性、信頼性、調査の妥当性を確保するために採用された厳格な調査手法の詳細
本分析は、定性的調査と定量的調査の両方の手法を組み合わせた方法論に基づいています。一次データ収集では、多様な業界のITおよびビジネス変革のシニアリーダーとの構造化インタビューを実施し、導入の課題、価値の実現、および要件の進化に関する直接的な視点を得ることができました。また、ベストプラクティスを検証し、新たな機能の採用動向を把握するために、ソリューションアーキテクト、プラットフォーム管理者、テクニカルコンサルタントとの綿密な協議を行いました。
企業の持続的な成功に向けたServiceNowの戦略的有望性、統合の重要性、および将来を見据えたアプローチを強調する結論の視点
結論として、サービス管理プラットフォームの進化は、従来の部門の境界を超えた、プラットフォーム主導のデジタルエコシステムへの幅広いシフトを反映しています。ServiceNowの統合スイートは、異種のワークフローを統合し、データリポジトリを統合し、サービスライフサイクル全体にインテリジェンスを組み込むことで、魅力的な提案を提供します。企業は規制の圧力、経済の不確実性、急速に変化する顧客の期待に対応するため、一貫性のある自動化された透明性の高いプロセスを提供する能力が競争優位性の重要な源泉となります。
目次
第1章 序文
第2章 調査手法
第3章 エグゼクティブサマリー
第4章 市場の概要
第5章 市場力学
- ServiceNowモジュール全体で生成AIワークフローを統合し、よりスマートなインシデント解決を実現
- ローコードおよびノーコード開発を活用してカスタムServiceNowアプリの配信を加速
- ServiceNow ITSMにAI駆動型予測分析を組み込み、ダウンタイムリスクを軽減
- 透明性のある持続可能性報告のためのServiceNowのESG管理機能を拡張
- ServiceNowで従業員エクスペリエンスプラットフォームを統合し、従業員のエンゲージメントを向上
- 自動化された脅威インテリジェンスと対応オーケストレーションによるServiceNowのセキュリティ運用の強化
- ServiceNowと主要なクラウドネイティブサービス間のクロスプラットフォーム統合を最適化し、シームレスな運用を実現します。
第6章 市場洞察
- ポーターのファイブフォース分析
- PESTEL分析
第7章 米国の関税の累積的な影響2025
第8章 ServiceNowビジネス市場:サービス別
- 顧客サービス管理
- HRサービス提供
- ITビジネスマネジメント
- IT運用管理
- ITサービス管理
- セキュリティオペレーション
第9章 ServiceNowビジネス市場:組織規模別
- 大企業
- 中小企業
第10章 ServiceNowビジネス市場:エンドユーザー別
- 金融サービス
- 政府
- ヘルスケア
- 製造業
- 通信
第11章 ServiceNowビジネス市場展開モデル別
- クラウドベース
- オンプレミス
第12章 南北アメリカのServiceNowビジネス市場
- 米国
- カナダ
- メキシコ
- ブラジル
- アルゼンチン
第13章 欧州・中東・アフリカのServiceNowビジネス市場
- 英国
- ドイツ
- フランス
- ロシア
- イタリア
- スペイン
- アラブ首長国連邦
- サウジアラビア
- 南アフリカ
- デンマーク
- オランダ
- カタール
- フィンランド
- スウェーデン
- ナイジェリア
- エジプト
- トルコ
- イスラエル
- ノルウェー
- オーストリア
- ポーランド
- スイス
第14章 アジア太平洋地域のServiceNowビジネス市場
- 中国
- インド
- 日本
- オーストラリア
- 韓国
- インドネシア
- タイ
- フィリピン
- マレーシア
- シンガポール
- ベトナム
- 台湾
第15章 競合情勢
- 市場シェア分析, 2024
- FPNVポジショニングマトリックス, 2024
- 競合分析
- Accenture PLC
- Atos SE
- Birlasoft Limited
- Capgemini SE
- Cask NX, LLC
- CDW LLC
- CGI Inc.
- Cognizant Technology Solutions Corporation
- Deloitte Touche Tohmatsu Limited
- DXC Technology Company
- Ernst & Young Global Limited
- Fujitsu Limited
- GlideFast Consulting LLC by ASGN Inc.
- HCL Technologies Limited
- Hexaware Technologies Limited
- Hitachi, Ltd.
- Infosys Limited
- International Business Machines Corporation
- KPMG International Limited
- Kyndryl Holdings, Inc.
- LTIMindtree Limited
- Microsoft Corporation
- Nagarro SE
- NTT Corporation
- Samsung SDS Co., Ltd.
- T-Systems International GmbH by Deutsche Telekom AG
- TATA Consultancy Services Limited
- Tech Mahindra Limited
- TEKsystems Global Services, LLC
- Unisys Corporation
- Virtusa Corporation
- Wipro Limited
- World Wide Technology, LLC
- ServiceNow, Inc.

