|
|
市場調査レポート
商品コード
1835318
産業用Vベルト市場:ベルトタイプ別、最終用途産業別、用途別、素材別、流通チャネル別-2025-2032年世界予測Industrial V-belt Market by Belt Type, End-Use Industry, Application, Material, Distribution Channel - Global Forecast 2025-2032 |
||||||
|
|||||||
カスタマイズ可能
適宜更新あり
|
|||||||

| 産業用Vベルト市場:ベルトタイプ別、最終用途産業別、用途別、素材別、流通チャネル別-2025-2032年世界予測 |
|
出版日: 2025年09月30日
発行: 360iResearch
ページ情報: 英文 185 Pages
納期: 即日から翌営業日
|

概要
産業用Vベルト市場は、2032年までにCAGR 5.34%で20億7,000万米ドルの成長が予測されています。
| 主な市場の統計 | |
|---|---|
| 基準年2024 | 13億7,000万米ドル |
| 推定年2025 | 14億4,000万米ドル |
| 予測年2032 | 20億7,000万米ドル |
| CAGR(%) | 5.34% |
産業用Vベルトの情勢を、技術的基盤、業務上の重要性、現代機械における産業横断的関連性に重点を置いて説明します
工業用Vベルトは、幅広い産業において機械的動力伝達の基礎的要素であり続けています。その設計の単純さは、耐久性、効率、ライフサイクルコストを決定する材料科学、プロファイル形状、システム設計の考慮事項の複雑な相互作用を覆い隠しています。近年、ポリマーの配合、コードの補強、歯とコグの形状が少しずつ進歩し、性能が向上していますが、製品は依然として、従来のエンジニアリング手法と新たな産業界の要求が交差する場所にあります。
システム設計者とメンテナンスチームにとって、Vベルトはコスト、交換の容易さ、運転信頼性の実用的なバランスを提供します。Vベルトは、農業用ドライブやマテリアルハンドリングコンベアから、HVAC送風機やヘビーデューティー鉱山機械まで、幅広い環境で使用されています。そのため、製品の決定は、耐摩耗性、耐薬品性、熱安定性、動的負荷の許容性など、さまざまな要因の融合によって左右されます。これらの技術的要因は、さらに調達チャネルやアフターセールス・サポートの取り決めにも影響され、総所有コストを大きく変える可能性があります。
このレビューでは、技術と素材の選択、多様な最終使用条件への適合性、現代のサプライ・チェーンのロジスティクスの現実など、実用的なレンズを通して業界を構成しています。この土台を確立することで、後続のセクションでは、規制、流通、顧客の期待におけるシフトが、サプライヤーの戦略と製品ロードマップをどのように再構築しているかを検証します。
素材の革新、デジタル・モニタリング、サプライチェーンの再編成、持続可能性の要請別Vベルト市場を形成する変革的シフト
Vベルトの仕様、製造、調達方法を再定義するために、いくつかの変革的シフトが収束しつつあります。熱可塑性エラストマーと最適化されたゴムコンパウンドの進歩により、ベルトの寿命が延びると同時に、幅の狭いプロファイルとスリップロスの低減が可能になりました。同時に、メンテナンス手法のデジタル化が価値提案を変えています。予測的状態監視と統合資産管理ツールは、サービス主導の販売を促進し、アフターマーケット情報の重要性を高めています。
サプライチェーンの再編成も大きなテーマです。企業は、地政学的リスクを軽減し、リードタイムを短縮するために、グローバルな調達戦略を再評価しており、地域の製造拠点と販売代理店とのパートナーシップの重要性を高めています。持続可能性への配慮は、今や研究開発投資とサプライヤー評価を同様に推進し、メーカーに、より低影響の処方を追求し、原料調達におけるトレーサビリティを実証するよう促しています。これと並行して、OEMとエンドユーザーは、部品設計とシステムレベルの効率性との緊密な統合をますます要求するようになり、サプライヤーは製品開発ライフサイクルの早い段階で協力するよう求められています。
これらのシフトを総合すると、サプライヤーは従来よりも機敏で、技術的能力が高く、サービス志向であることが求められます。購買担当者が単純な単価よりもトータル・ライフサイクル・パフォーマンスを優先する中、素材の専門知識、デジタル・サービス、弾力性のあるロジスティクスを統合した企業は競争力を持つことになります。
2025年における米国の新たな関税措置がVベルトのサプライチェーン、調達戦略、各産業のコスト構造に与える累積的影響の予測
2025年の政策環境は、Vベルトを調達、輸入、販売する企業にとって新たな考慮事項を導入しました。関税措置は国際貿易のコストと管理負担を増大させ、調達チームはサプライヤーのポートフォリオを再評価し、より広範な調達戦略を検討するよう促されました。これを受けて、多くの企業は、突然の関税引き上げのリスクを抑えつつ供給の継続性を維持するために、ニアショアリング、地域調達、マルチソーシングのアプローチを評価し始めています。
経営上の対応としては、重要なSKUの在庫バッファーを増やしたり、関税保護条項を盛り込んだ長期契約の再交渉を行ったり、クロスボーダー・フローが制約される期間中の配分を確保するためにサプライヤーとの関係管理を重視するようになったりしています。同時に、製造業者と販売業者は、主要なベルトコンパウンドとコード補強材の生産を現地化する努力を急ぎ、輸送時間を短縮し、国境を越えた関税の対象となる商品の割合を減らしています。このような変化は、価格決定力にも影響します。調達チームは、関税による当面のコストへの影響と、サプライチェーンの弾力性やリードタイムの短縮による長期的な利益とのバランスを取っています。
コンプライアンスの観点から、企業は通関の遅れを減らし、正しい関税治療を確実にするために、関税分類の専門知識と出荷書類に投資しています。その正味の効果は、戦略的トレードオフの変化です。企業は、供給保証、応答性、サプライヤーの透明性に高い価値を置き、オペレーショナル・リスクの低減とリードタイムの予測可能性の向上と引き換えに、多少のコスト上昇を容認するようになっています。
ベルトの種類、産業、用途、材料、流通チャネルにまたがるVベルトバリエーションの性能を明らかにする戦略的セグメンテーションの洞察
セグメンテーション分析により、サプライヤーとバイヤーが理解すべき重要な差別化されたダイナミクスが明らかになります。ダブルVベルトは一般的に高トルク、低速駆動用に選択されるのに対し、ナローVベルトと生刃コグ付きベルトはスペースの制約、柔軟性、放熱性の改善が重要な場合に支持されます。標準的なVベルトは引き続き汎用交換チャネルに使用されていますが、長いサービス間隔を必要とする用途では設計されたベルトが好まれています。
最終用途の産業区分では、農業用途では耐摩耗性と油や土壌にさらされることによる耐薬品性が好まれ、自動車アフターマーケットとOEMの顧客は寸法の一貫性と騒音、振動、ハーシュネス(NVH)性能を重視しています。エネルギーと電力設備は熱安定性と耐油性、耐オゾン性を優先し、製造業と鉱業・建設業は引張強度と耐衝撃性を重視します。HVACシステム、マテリアルハンドリング、パワートランスミッションは、用途によって異なるデューティサイクルとサービスに対する期待があり、仕様の選択と推奨メンテナンス間隔を形成しています。
熱可塑性ポリウレタンを含むポリウレタン系ベルトは耐摩耗性と低伸びが優先される場合に優れている一方、ゴム系ベルト(EPDM、ネオプレン、ニトリル)は幅広い熱的・化学的領域で実証済みの性能を発揮します。材料の選択は、耐用年数、保管上の考慮事項、プーリーやシーブとの相互作用に影響するため、在庫方針を決定します。販売チャネルのセグメンテーションは、チャネルの適合性の重要性を浮き彫りにしています。直販は、技術的なプロジェクトベースの契約には好まれ、代理店は、交換と地域的なカバレッジをサポートします。これらの相互に関連するセグメントを理解することで、製品ポートフォリオを顧客のニーズやサプライチェーンの能力に合わせてより正確に調整することができます。
アメリカ、欧州、中東・アフリカ、アジア太平洋の電力・製造市場におけるVベルト需要を形成する地域力学と市場促進要因
地域力学は競合のポジショニングと調達の選択に重大な影響を与えます。南北アメリカでは、確立された製造クラスターと強力なアフターマーケットネットワークの組み合わせが、交換や改造プロジェクトの迅速な対応を支えています。一方、この地域の需要は、保守性と現地在庫の入手を優先する農業、自動車、マテリアルハンドリング部門によって牽引されています。この地域で生産施設や仕上げ施設を運営するメーカーは、リードタイムの短縮とOEMや販売業者との緊密な協力関係を活用することができます。
欧州・中東・アフリカは、排出ガスや持続可能性に関する規制状況が厳しく、製品のトレーサビリティや原材料の情報開示が重視されがちな異質な地域です。この地域では、ハイスペックな産業用途と厳しい環境配慮が、より高性能なコンパウンドと文書化されたサプライチェーンへとサプライヤーを押し上げています。さらに、重工業から精密製造まで、最終市場が多様であるため、さまざまな商業的・技術的要件に対応できる柔軟な生産能力と地域の流通パートナーが好まれます。
アジア太平洋は、特に製造業とエネルギー・インフラストラクチャーにおいて、部品生産と急成長する最終用途需要の両方の中核拠点であり続けています。同地域の規模は、コスト競争力のある製造と迅速なプロトタイピングを支えているが、物流の複雑さと規制体制の変化により、強固な品質保証とサプライヤー管理プロセスが必要となります。どの地域でも、競争優位性は、現地での事業展開、技術サポート、製品仕様を地域のサービス環境に適合させる能力を兼ね備えた組織にもたらされます。
メーカーとサプライヤーの競合戦略と製品イノベーションが、Vベルトセクター全体のパフォーマンス、サービスモデル、パートナーシップを再構築しています
主要サプライヤーの競合戦略は、素材とデザインによる製品の差別化、サービス主導の収益モデル、原材料の川上パートナーシップの強化という、いくつかの明確なテーマに集約されつつあります。先進的なエラストマーブレンドとコード技術を開発するための研究開発への投資により、サプライヤーはより高い耐熱性、伸びの低減、油やオゾンに対する耐性の改善を実現したベルトを提供できるようになりました。これらの技術的差別化要因は、性能とライフサイクル全体の信頼性へと購買決定をシフトさせるフィールドテストや延長保証の提供を通じて、ますます検証されるようになっています。
サービス・モデルも進化しています。企業は、予知保全ツール、コンディション・モニタリング、迅速な交換サービスをバンドルして、継続的な収益源と顧客とのより深い関係を構築しています。ディストリビューターや地域ファブリケーターとの戦略的提携は、迅速なアフターセールス・サポートを提供しながら、リーチを拡大しています。商業面では、企業は、二重調達、地域在庫ハブ、バリューチェーン全体でリスクを共有する契約メカニズムを通じて、サプライチェーンの強靭性を追求しています。
これらの行動を総合すると、技術的信頼性と物流対応力が商業的成功を左右する市場を反映しています。強固な製品ポートフォリオと、実証可能なサービス能力、透明性の高いサプライチェーン慣行を併せ持つサプライヤーは、OEMや大規模エンドユーザーとの戦略的パートナーシップを獲得する立場にあります。
製造業者と販売業者がVベルト市場の回復力を高め、オペレーションを最適化し、成長を引き出すための実践的な戦略提言
業界のリーダーは、競争力を強化し、短期的な混乱を緩和するために、一連の実際的な行動を優先すべきです。第一に、アプリケーションに特化した試験と稼働中の検証に投資することで、製品開発を実際のデューティサイクルに合わせる。第二に、コンディション・ベース・メンテナンスと遠隔診断を可能にするデジタル・サービス機能を拡大します。テレメトリーを統合したり、資産管理プラットフォームと提携したりすることで、顧客エンゲージメントを深め、継続的な収益機会を創出します。
第三に、コストと弾力性のバランスをとるために、調達戦略を再構築します。重要なSKUの地域生産または仕上げ能力を確立し、戦略的原材料の代替サプライヤーを開発し、貿易政策の変動に対応する契約上の保護を交渉します。第四に、流通アプローチを製品の複雑性に適合させることで、チャネル戦略を最適化します。エンジニアリング・ソリューションは、テクニカル・セールスや流通のスペシャリストによる直接販売が有効である一方、標準化されたSKUは、効率的なeコマース・フルフィルメントやリバース・ロジスティクスが必要です。
最後に、顧客の要求が高まっているサプライチェーンの透明性と持続可能性対策に取り組むことです。エラストマーのトレーサブルな調達と製造における無駄の削減は、規制の期待に応えるだけでなく、調達の対話における差別化要因にもなります。これらの推奨事項を実施することで、信頼性を向上させ、利幅を確保し、購買基準が進化し続ける中で価値を獲得することができます。
Vベルトエコシステムの調査に使用した一次情報と二次情報、検証プロセス、分析フレームワークの概要を示す透明性の高い調査手法
本レポートを支える分析は、構造化された1次調査と厳密な2次検証および技術ベンチマークを組み合わせたものです。一次調査には、複数の最終用途部門のエンジニア、調達リーダー、アフターマーケットマネージャーとの綿密なインタビューが含まれ、業務上の疼痛ポイント、仕様の促進要因、チャネルの嗜好を把握しました。これらの定性的洞察は、サプライヤー独自の情報開示、取引文書、および性能主張と期待される耐久性の確実な解釈を保証するためのテストデータと三角比較されました。
2次調査には、業界標準、エラストマーとコードの技術革新に関する技術論文、リードタイムと物流フットプリントを反映した物流データなどが含まれます。該当する場合は、代表的な負荷サイクルの下での材料性能を評価するために、実験室での試験結果と加速老化データを参照した。すべてのインプットは、独立した材料科学者やフィールドサービスエンジニアとの協議を通じて専門家による検証を受け、結論を検証し、推奨されるアクションを改良しました。
調査手法とデータソースは文書化され、感度テストは主要な運転シナリオに適用されました。このようなアプローチにより、得られた知見が実務経験と技術的根拠の双方に裏打ちされたものとなり、意思決定者がその洞察を調達、製品開発、サービス計画に直接適用することが可能となります。
Vベルト産業の方向性を左右する技術的、商業的、地政学的要因を総合した結論的戦略展望
技術的、商業的、地政学的要因の総合は、製品性能だけでは競争優位をもはや決定できない未来を指し示しています。サプライヤーは、実証可能なサービス能力、サプライチェーンの透明性、地域対応力など、提供するもの幅を広げなければならないです。素材の技術的改良は測定可能な耐久性の向上をもたらすが、その商業的価値は、ダウンタイムと総ライフサイクル・コストを削減する強固な流通・メンテナンス・モデルと組み合わされて初めて解き放たれます。
地政学的なシフトと貿易政策の開発により、調達の俊敏性と在庫管理の戦略的重要性が高まり、多くの組織が地域製造と多様なサプライヤー・ネットワークを好むようになっています。同時に、エンドユーザーは持続可能性とトレーサビリティをより重視するようになっており、これは材料の選択とサプライヤーの評価に影響を与えると思われます。つまり、コモディティ代替チャネルはコストと納品スピードを優先し、エンジニアリング・アプリケーションとミッション・クリティカル・アプリケーションは技術的差別化と統合されたサービス提供に報いるということです。
今後は、素材の専門知識、デジタルサービス、弾力性のあるロジスティクスを首尾一貫した商業的提案に統合する能力によって、リーダーシップが決定されます。このような次元で実行する企業は、より強固な顧客関係とより強いマージン・プロファイルを生み出すと同時に、業務上の混乱や政策転換のリスクを軽減することができると思われます。
目次
第1章 序文
第2章 調査手法
第3章 エグゼクティブサマリー
第4章 市場の概要
第5章 市場洞察
- リアルタイムの設備監視と予測メンテナンスのためのスマートセンサー搭載産業用Vベルトの採用が増加
- ダウンタイムとメンテナンスコストを削減するために、重機における耐油性ネオプレンVベルトの需要が高まっています。
- リサイクルゴムと持続可能な生産プロセスを使用した環境に優しいVベルト製造への移行
- 産業用駆動装置の高負荷容量を支えるVベルトにおける高強度アラミド繊維強化材の出現
- HVACおよびコンプレッサーシステムに可変速Vベルトドライブを統合し、エネルギー消費と効率を最適化します。
- 過酷な産業環境に耐える優れた耐摩耗性を備えたポリウレタンコーティングVベルトの開発
第6章 米国の関税の累積的な影響, 2025
第7章 AIの累積的影響, 2025
第8章 産業用Vベルト市場ベルトタイプ別
- ダブルVベルト
- ナローVベルト
- 生エッジコグドベルト
- 標準Vベルト
第9章 産業用Vベルト市場:最終用途産業別
- 農業
- 自動車
- エネルギーと電力
- 製造業
- 鉱業と建設
第10章 産業用Vベルト市場:用途別
- 空調設備
- マテリアルハンドリング
- 動力伝達
第11章 産業用Vベルト市場:素材別
- ポリウレタン
- 熱可塑性ポリウレタン
- ゴム
- EPDM
- ネオプレン
- ニトリル
第12章 産業用Vベルト市場:流通チャネル別
- 直接販売
- 卸売業者
- オンラインチャンネル
第13章 産業用Vベルト市場:地域別
- 南北アメリカ
- 北米
- ラテンアメリカ
- 欧州・中東・アフリカ
- 欧州
- 中東
- アフリカ
- アジア太平洋地域
第14章 産業用Vベルト市場:グループ別
- ASEAN
- GCC
- EU
- BRICS
- G7
- NATO
第15章 産業用Vベルト市場:国別
- 米国
- カナダ
- メキシコ
- ブラジル
- 英国
- ドイツ
- フランス
- ロシア
- イタリア
- スペイン
- 中国
- インド
- 日本
- オーストラリア
- 韓国
第16章 競合情勢
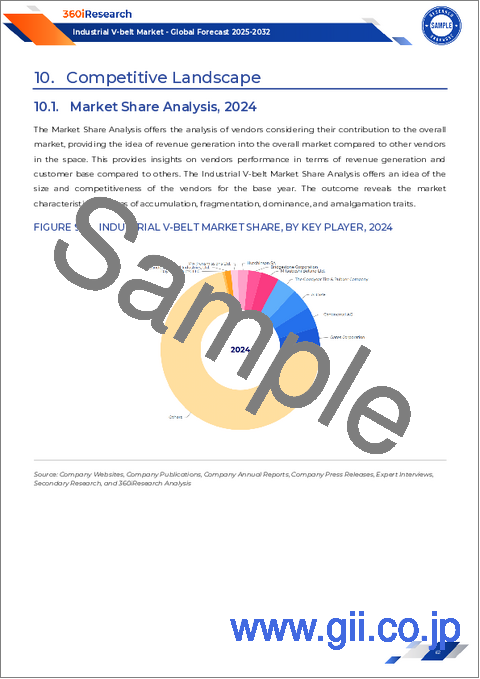
- 市場シェア分析, 2024
- FPNVポジショニングマトリックス, 2024
- 競合分析
- Gates Corporation
- Continental AG
- The Goodyear Tire & Rubber Company
- Bando Chemical Industries, Ltd.
- Mitsuboshi Belting Ltd.
- OPTIBELT GmbH
- Fenner PLC
- Carlisle Companies, Inc.
- Bridgestone Corporation
- Dayco Products, LLC

