 |
市場調査レポート
商品コード
1413912
デジタル電力計市場:相別、用途別-2024~2030年の世界予測Digital Power Meters Market by Phase (Single Phase, Three Phase), Application (Commercial, Industrial, Residential) - Global Forecast 2024-2030 |
||||||
● お客様のご希望に応じて、既存データの加工や未掲載情報(例:国別セグメント)の追加などの対応が可能です。 詳細はお問い合わせください。

| デジタル電力計市場:相別、用途別-2024~2030年の世界予測 |
|
出版日: 2024年01月15日
発行: 360iResearch
ページ情報: 英文 189 Pages
納期: 即日から翌営業日
|
- 全表示
- 概要
- 図表
- 目次
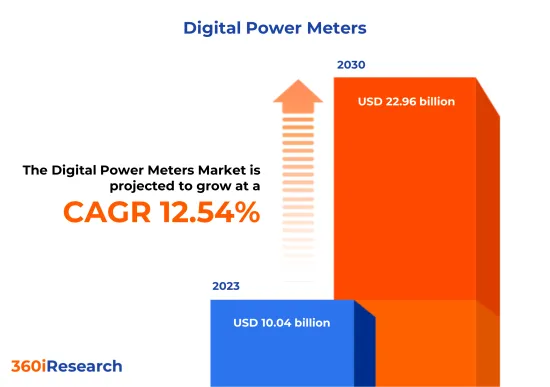
デジタル電力計市場規模は2023年に100億4,000万米ドルと推定され、2024年には112億6,000万米ドルに達し、CAGR 12.54%で2030年には229億6,000万米ドルに達すると予測されます。
デジタル電力計の世界市場
| 主要市場の統計 | |
|---|---|
| 基準年[2023年] | 100億4,000万米ドル |
| 予測年[2024年] | 112億6,000万米ドル |
| 予測年[2030年] | 229億6,000万米ドル |
| CAGR(%) | 12.54% |
デジタル電力計は、住宅、事業所、または電子的に駆動する装置によって消費される電気エネルギー量を記録する高度な測定装置です。アナログの前身とは異なり、これらのメーターはデータの収集、処理、表示にデジタル技術を採用しています。高精度、高信頼性、長期にわたる電力使用量の詳細情報を提供する能力で知られています。これらのメーターは通常、デジタル表示を特徴とし、使用時間課金、データ通信、遠隔読み取り機能などの高度な機能を組み込むことができます。電圧、電流、力率、キロワットアワー(kWh)エネルギー消費量など、さまざまな電気パラメーターを監視できます。省エネルギーに対する意識の高まりとスマートホームの増加、エネルギー管理とスマートグリッド技術に対する政府の取り組みが、デジタル電力計の採用を増加させています。しかし、データ・セキュリティに関する懸念や、初期コストの高いデジタル・メーターの複雑な機能が、市場の成長を阻害する可能性があります。とはいえ、高度なエネルギー管理ソフトウェアの開発と高度な蓄電池統合の研究により、市場成長の好機が生まれると予想されます。
地域別洞察
南北南北アメリカは、エネルギー効率と送電網近代化のための協調的な取り組みによって、デジタル電力計に対する強い需要を示しています。これらの国々は、多くのスマートホームと進行中のスマートグリッドへの移行により、デジタル電力計技術の重要な消費者となっています。これらの地域の顧客は、リアルタイムのモニタリングとエネルギー管理を提供する統合ソリューションに傾斜しています。米国のスマートグリッド投資助成金(SGIG)やカナダのスマートグリッドプログラムなどのイニシアチブは、この地域が送電網インフラの強化に注力していることを強調し、高度な計測機器の需要を促進しています。欧州、中東、アフリカ地域は、デジタル電力計にとって多様な市場情勢を呈しています。欧州連合(EU)が推進するデジタル化と持続可能なエネルギーは、革新的な計測ソリューションの導入に大きく拍車をかけています。省エネと効率的な資源管理の要求により、EU諸国は革新的なグリッド技術を積極的に採用しています。顧客は、厳しい規制基準に適合し、データ・セキュリティを提供する製品を好みます。インフラとスマートシティプロジェクトの成長により、中東では高度計測インフラ(AMI)に対する受容性が高まっています。アフリカでは、電力監視と盗難削減の必要性から、認識と導入が高まっています。アフリカのいくつかの国では現在、プリペイド式デジタル電力メーター・ソリューションにモバイル技術の統合を活用しています。アジア太平洋のデジタル電力計市場は、高効率の電力管理システムを必要とする大規模なインフラ・プロジェクトによって牽引されています。さらに、この地域の国々は省エネルギーと技術的に洗練されたインフラに重点を置いており、顧客の嗜好が高精度で耐久性のある電力計に偏っていることも市場需要に大きく貢献しています。
FPNVポジショニングマトリックス
FPNVポジショニングマトリックスはデジタル電力計市場を評価する上で極めて重要です。事業戦略と製品満足度に関連する主要指標を調査し、ベンダーの包括的な評価を提供します。この綿密な分析により、ユーザーは各自の要件に沿った十分な情報に基づいた意思決定を行うことができます。評価に基づき、ベンダーは成功の度合いが異なる4つの象限に分類されます。フォアフロント(F)、パスファインダー(P)、ニッチ(N)、バイタル(V)です。
市場シェア分析
市場シェア分析は、デジタル電力計市場におけるベンダーの現状について、洞察に満ちた詳細な調査を提供する包括的なツールです。全体的な収益、顧客基盤、その他の主要指標についてベンダーの貢献度を綿密に比較・分析することで、企業の業績や市場シェア争いの際に直面する課題について理解を深めることができます。さらに、この分析により、調査対象基準年に観察された累積、断片化の優位性、合併の特徴などの要因を含む、この分野の競合特性に関する貴重な考察が得られます。このような詳細レベルの拡大により、ベンダーはより多くの情報に基づいた意思決定を行い、市場で競争優位に立つための効果的な戦略を考案することができます。
本レポートは、以下の側面に関する貴重な洞察を提供しています:
1-市場の浸透度:主要企業が提供する市場に関する包括的な情報を提示しています。
2-市場の開拓度:有利な新興市場を深く掘り下げ、成熟市場セグメントにおける浸透度を分析しています。
3-市場の多様化:新製品の発売、未開拓の地域、最近の開発、投資に関する詳細な情報を提供します。
4-競合の評価と情報:市場シェア、戦略、製品、認証、規制状況、特許状況、主要企業の製造能力などを網羅的に評価します。
5-製品開発とイノベーション:将来の技術、研究開発活動、画期的な製品開発に関する知的洞察を提供します。
本レポートは、以下のような主要な質問に対応しています:
1-デジタル電力計市場の市場規模と予測は?
2-デジタル電力計市場の予測期間中に投資を検討すべき製品、セグメント、用途、分野は何か?
3-デジタル電力計市場における技術動向と規制の枠組みは?
4-デジタル電力計市場における主要ベンダーの市場シェアは?
5-デジタル電力計市場への参入に適した形態や戦略的手段は?
目次
第1章 序文
第2章 調査手法
第3章 エグゼクティブサマリー
第4章 市場概要
第5章 市場洞察
- 市場力学
- 促進要因
- 省エネ意識の高まりによるスマートホームの増加
- エネルギー管理とスマートグリッド技術に対する政府の取り組み
- エネルギー使用量の遠隔監視と制御のニーズの増加
- 抑制要因
- デジタル電力計インフラストラクチャへの高額な初期投資
- 機会
- IoTとデータ分析の革新によるデジタル電力計の機能の拡大
- 高度な蓄電池統合の調査による高度なエネルギー管理ソフトウェアの開発
- 課題
- データセキュリティとデジタルメーターの複雑な機能に関する懸念
- 促進要因
- 市場セグメンテーション分析
- 相:三相メーターは、高負荷を処理し、電力品質を維持できるため、産業環境では不可欠
- 用途:商業分野におけるデジタル電力計の使用法の進化
- 市場動向分析
- 高インフレの累積的影響
- ポーターのファイブフォース分析
- バリューチェーンとクリティカルパス分析
- 規制の枠組み
第6章 デジタル電力計市場:相別
- イントロダクション
- 単相
- 三相
第7章 デジタル電力計市場:用途別
- イントロダクション
- 商業用
- 産業用
- 住宅用
第8章 南北アメリカのデジタル電力計市場
- イントロダクション
- アルゼンチン
- ブラジル
- カナダ
- メキシコ
- 米国
第9章 アジア太平洋のデジタル電力計市場
- イントロダクション
- オーストラリア
- 中国
- インド
- インドネシア
- 日本
- マレーシア
- フィリピン
- シンガポール
- 韓国
- 台湾
- タイ
- ベトナム
第10章 欧州・中東・アフリカのデジタル電力計市場
- イントロダクション
- デンマーク
- エジプト
- フィンランド
- フランス
- ドイツ
- イスラエル
- イタリア
- オランダ
- ナイジェリア
- ノルウェー
- ポーランド
- カタール
- ロシア
- サウジアラビア
- 南アフリカ
- スペイン
- スウェーデン
- スイス
- トルコ
- アラブ首長国連邦
- 英国
第11章 競合情勢
- FPNVポジショニングマトリクス
- 市場シェア分析:主要企業別
- 競合シナリオ主要企業別の分析
- 合併・買収
- 新製品発売と機能強化
- 受賞・表彰・拡大
第12章 競合ポートフォリオ
- 主要な企業プロファイル
- ABB Ltd.
- Advanced Electronics Company
- Carrel Electrade Limited
- Circutor SA
- EASTRON ELECTRONIC CO., LTD.
- Eaton Corporation PLC
- EKM Metering Inc.
- Elster Group GmbH by Honeywell International Inc.
- General Electric company
- Holley Technology Ltd.
- HPL Electric and Power Limited
- Iskraemeco Group
- Itron, Inc.
- Jiangsu Linyang Energy Co., Ltd.
- Kamstrup A/S
- Landis+Gyr AG
- Murata Manufacturing Co., Ltd.
- Ningbo Sanxing Electric Co. Ltd.
- Osaki Electric Co. Ltd.
- Schneider Electric SE
- Sensus by Xylem Inc.
- Siemens AG
- Simpson Electric Company, Inc.
- TE Connectivity Ltd.
- Wasion International Co., Ltd.
- 主要な製品ポートフォリオ
第13章 付録
- ディスカッションガイド
- ライセンスと価格について
LIST OF FIGURES
- FIGURE 1. DIGITAL POWER METERS MARKET RESEARCH PROCESS
- FIGURE 2. DIGITAL POWER METERS MARKET SIZE, 2023 VS 2030
- FIGURE 3. DIGITAL POWER METERS MARKET SIZE, 2018-2030 (USD MILLION)
- FIGURE 4. DIGITAL POWER METERS MARKET SIZE, BY REGION, 2023 VS 2030 (%)
- FIGURE 5. DIGITAL POWER METERS MARKET SIZE, BY REGION, 2023 VS 2024 VS 2030 (USD MILLION)
- FIGURE 6. DIGITAL POWER METERS MARKET DYNAMICS
- FIGURE 7. DIGITAL POWER METERS MARKET SIZE, BY PHASE, 2023 VS 2030 (%)
- FIGURE 8. DIGITAL POWER METERS MARKET SIZE, BY PHASE, 2023 VS 2024 VS 2030 (USD MILLION)
- FIGURE 9. DIGITAL POWER METERS MARKET SIZE, BY APPLICATION, 2023 VS 2030 (%)
- FIGURE 10. DIGITAL POWER METERS MARKET SIZE, BY APPLICATION, 2023 VS 2024 VS 2030 (USD MILLION)
- FIGURE 11. AMERICAS DIGITAL POWER METERS MARKET SIZE, BY COUNTRY, 2023 VS 2030 (%)
- FIGURE 12. AMERICAS DIGITAL POWER METERS MARKET SIZE, BY COUNTRY, 2023 VS 2024 VS 2030 (USD MILLION)
- FIGURE 13. UNITED STATES DIGITAL POWER METERS MARKET SIZE, BY STATE, 2023 VS 2030 (%)
- FIGURE 14. UNITED STATES DIGITAL POWER METERS MARKET SIZE, BY STATE, 2023 VS 2024 VS 2030 (USD MILLION)
- FIGURE 15. ASIA-PACIFIC DIGITAL POWER METERS MARKET SIZE, BY COUNTRY, 2023 VS 2030 (%)
- FIGURE 16. ASIA-PACIFIC DIGITAL POWER METERS MARKET SIZE, BY COUNTRY, 2023 VS 2024 VS 2030 (USD MILLION)
- FIGURE 17. EUROPE, MIDDLE EAST & AFRICA DIGITAL POWER METERS MARKET SIZE, BY COUNTRY, 2023 VS 2030 (%)
- FIGURE 18. EUROPE, MIDDLE EAST & AFRICA DIGITAL POWER METERS MARKET SIZE, BY COUNTRY, 2023 VS 2024 VS 2030 (USD MILLION)
- FIGURE 19. DIGITAL POWER METERS MARKET, FPNV POSITIONING MATRIX, 2023
- FIGURE 20. DIGITAL POWER METERS MARKET SHARE, BY KEY PLAYER, 2023
LIST OF TABLES
- TABLE 1. DIGITAL POWER METERS MARKET SEGMENTATION & COVERAGE
- TABLE 2. UNITED STATES DOLLAR EXCHANGE RATE, 2018-2023
- TABLE 3. DIGITAL POWER METERS MARKET SIZE, 2018-2030 (USD MILLION)
- TABLE 4. GLOBAL DIGITAL POWER METERS MARKET SIZE, BY REGION, 2018-2030 (USD MILLION)
- TABLE 5. DIGITAL POWER METERS MARKET SIZE, BY PHASE, 2018-2030 (USD MILLION)
- TABLE 6. DIGITAL POWER METERS MARKET SIZE, BY SINGLE PHASE, BY REGION, 2018-2030 (USD MILLION)
- TABLE 7. DIGITAL POWER METERS MARKET SIZE, BY THREE PHASE, BY REGION, 2018-2030 (USD MILLION)
- TABLE 8. DIGITAL POWER METERS MARKET SIZE, BY APPLICATION, 2018-2030 (USD MILLION)
- TABLE 9. DIGITAL POWER METERS MARKET SIZE, BY COMMERCIAL, BY REGION, 2018-2030 (USD MILLION)
- TABLE 10. DIGITAL POWER METERS MARKET SIZE, BY INDUSTRIAL, BY REGION, 2018-2030 (USD MILLION)
- TABLE 11. DIGITAL POWER METERS MARKET SIZE, BY RESIDENTIAL, BY REGION, 2018-2030 (USD MILLION)
- TABLE 12. AMERICAS DIGITAL POWER METERS MARKET SIZE, BY PHASE, 2018-2030 (USD MILLION)
- TABLE 13. AMERICAS DIGITAL POWER METERS MARKET SIZE, BY APPLICATION, 2018-2030 (USD MILLION)
- TABLE 14. AMERICAS DIGITAL POWER METERS MARKET SIZE, BY COUNTRY, 2018-2030 (USD MILLION)
- TABLE 15. ARGENTINA DIGITAL POWER METERS MARKET SIZE, BY PHASE, 2018-2030 (USD MILLION)
- TABLE 16. ARGENTINA DIGITAL POWER METERS MARKET SIZE, BY APPLICATION, 2018-2030 (USD MILLION)
- TABLE 17. BRAZIL DIGITAL POWER METERS MARKET SIZE, BY PHASE, 2018-2030 (USD MILLION)
- TABLE 18. BRAZIL DIGITAL POWER METERS MARKET SIZE, BY APPLICATION, 2018-2030 (USD MILLION)
- TABLE 19. CANADA DIGITAL POWER METERS MARKET SIZE, BY PHASE, 2018-2030 (USD MILLION)
- TABLE 20. CANADA DIGITAL POWER METERS MARKET SIZE, BY APPLICATION, 2018-2030 (USD MILLION)
- TABLE 21. MEXICO DIGITAL POWER METERS MARKET SIZE, BY PHASE, 2018-2030 (USD MILLION)
- TABLE 22. MEXICO DIGITAL POWER METERS MARKET SIZE, BY APPLICATION, 2018-2030 (USD MILLION)
- TABLE 23. UNITED STATES DIGITAL POWER METERS MARKET SIZE, BY PHASE, 2018-2030 (USD MILLION)
- TABLE 24. UNITED STATES DIGITAL POWER METERS MARKET SIZE, BY APPLICATION, 2018-2030 (USD MILLION)
- TABLE 25. UNITED STATES DIGITAL POWER METERS MARKET SIZE, BY STATE, 2018-2030 (USD MILLION)
- TABLE 26. ASIA-PACIFIC DIGITAL POWER METERS MARKET SIZE, BY PHASE, 2018-2030 (USD MILLION)
- TABLE 27. ASIA-PACIFIC DIGITAL POWER METERS MARKET SIZE, BY APPLICATION, 2018-2030 (USD MILLION)
- TABLE 28. ASIA-PACIFIC DIGITAL POWER METERS MARKET SIZE, BY COUNTRY, 2018-2030 (USD MILLION)
- TABLE 29. AUSTRALIA DIGITAL POWER METERS MARKET SIZE, BY PHASE, 2018-2030 (USD MILLION)
- TABLE 30. AUSTRALIA DIGITAL POWER METERS MARKET SIZE, BY APPLICATION, 2018-2030 (USD MILLION)
- TABLE 31. CHINA DIGITAL POWER METERS MARKET SIZE, BY PHASE, 2018-2030 (USD MILLION)
- TABLE 32. CHINA DIGITAL POWER METERS MARKET SIZE, BY APPLICATION, 2018-2030 (USD MILLION)
- TABLE 33. INDIA DIGITAL POWER METERS MARKET SIZE, BY PHASE, 2018-2030 (USD MILLION)
- TABLE 34. INDIA DIGITAL POWER METERS MARKET SIZE, BY APPLICATION, 2018-2030 (USD MILLION)
- TABLE 35. INDONESIA DIGITAL POWER METERS MARKET SIZE, BY PHASE, 2018-2030 (USD MILLION)
- TABLE 36. INDONESIA DIGITAL POWER METERS MARKET SIZE, BY APPLICATION, 2018-2030 (USD MILLION)
- TABLE 37. JAPAN DIGITAL POWER METERS MARKET SIZE, BY PHASE, 2018-2030 (USD MILLION)
- TABLE 38. JAPAN DIGITAL POWER METERS MARKET SIZE, BY APPLICATION, 2018-2030 (USD MILLION)
- TABLE 39. MALAYSIA DIGITAL POWER METERS MARKET SIZE, BY PHASE, 2018-2030 (USD MILLION)
- TABLE 40. MALAYSIA DIGITAL POWER METERS MARKET SIZE, BY APPLICATION, 2018-2030 (USD MILLION)
- TABLE 41. PHILIPPINES DIGITAL POWER METERS MARKET SIZE, BY PHASE, 2018-2030 (USD MILLION)
- TABLE 42. PHILIPPINES DIGITAL POWER METERS MARKET SIZE, BY APPLICATION, 2018-2030 (USD MILLION)
- TABLE 43. SINGAPORE DIGITAL POWER METERS MARKET SIZE, BY PHASE, 2018-2030 (USD MILLION)
- TABLE 44. SINGAPORE DIGITAL POWER METERS MARKET SIZE, BY APPLICATION, 2018-2030 (USD MILLION)
- TABLE 45. SOUTH KOREA DIGITAL POWER METERS MARKET SIZE, BY PHASE, 2018-2030 (USD MILLION)
- TABLE 46. SOUTH KOREA DIGITAL POWER METERS MARKET SIZE, BY APPLICATION, 2018-2030 (USD MILLION)
- TABLE 47. TAIWAN DIGITAL POWER METERS MARKET SIZE, BY PHASE, 2018-2030 (USD MILLION)
- TABLE 48. TAIWAN DIGITAL POWER METERS MARKET SIZE, BY APPLICATION, 2018-2030 (USD MILLION)
- TABLE 49. THAILAND DIGITAL POWER METERS MARKET SIZE, BY PHASE, 2018-2030 (USD MILLION)
- TABLE 50. THAILAND DIGITAL POWER METERS MARKET SIZE, BY APPLICATION, 2018-2030 (USD MILLION)
- TABLE 51. VIETNAM DIGITAL POWER METERS MARKET SIZE, BY PHASE, 2018-2030 (USD MILLION)
- TABLE 52. VIETNAM DIGITAL POWER METERS MARKET SIZE, BY APPLICATION, 2018-2030 (USD MILLION)
- TABLE 53. EUROPE, MIDDLE EAST & AFRICA DIGITAL POWER METERS MARKET SIZE, BY PHASE, 2018-2030 (USD MILLION)
- TABLE 54. EUROPE, MIDDLE EAST & AFRICA DIGITAL POWER METERS MARKET SIZE, BY APPLICATION, 2018-2030 (USD MILLION)
- TABLE 55. EUROPE, MIDDLE EAST & AFRICA DIGITAL POWER METERS MARKET SIZE, BY COUNTRY, 2018-2030 (USD MILLION)
- TABLE 56. DENMARK DIGITAL POWER METERS MARKET SIZE, BY PHASE, 2018-2030 (USD MILLION)
- TABLE 57. DENMARK DIGITAL POWER METERS MARKET SIZE, BY APPLICATION, 2018-2030 (USD MILLION)
- TABLE 58. EGYPT DIGITAL POWER METERS MARKET SIZE, BY PHASE, 2018-2030 (USD MILLION)
- TABLE 59. EGYPT DIGITAL POWER METERS MARKET SIZE, BY APPLICATION, 2018-2030 (USD MILLION)
- TABLE 60. FINLAND DIGITAL POWER METERS MARKET SIZE, BY PHASE, 2018-2030 (USD MILLION)
- TABLE 61. FINLAND DIGITAL POWER METERS MARKET SIZE, BY APPLICATION, 2018-2030 (USD MILLION)
- TABLE 62. FRANCE DIGITAL POWER METERS MARKET SIZE, BY PHASE, 2018-2030 (USD MILLION)
- TABLE 63. FRANCE DIGITAL POWER METERS MARKET SIZE, BY APPLICATION, 2018-2030 (USD MILLION)
- TABLE 64. GERMANY DIGITAL POWER METERS MARKET SIZE, BY PHASE, 2018-2030 (USD MILLION)
- TABLE 65. GERMANY DIGITAL POWER METERS MARKET SIZE, BY APPLICATION, 2018-2030 (USD MILLION)
- TABLE 66. ISRAEL DIGITAL POWER METERS MARKET SIZE, BY PHASE, 2018-2030 (USD MILLION)
- TABLE 67. ISRAEL DIGITAL POWER METERS MARKET SIZE, BY APPLICATION, 2018-2030 (USD MILLION)
- TABLE 68. ITALY DIGITAL POWER METERS MARKET SIZE, BY PHASE, 2018-2030 (USD MILLION)
- TABLE 69. ITALY DIGITAL POWER METERS MARKET SIZE, BY APPLICATION, 2018-2030 (USD MILLION)
- TABLE 70. NETHERLANDS DIGITAL POWER METERS MARKET SIZE, BY PHASE, 2018-2030 (USD MILLION)
- TABLE 71. NETHERLANDS DIGITAL POWER METERS MARKET SIZE, BY APPLICATION, 2018-2030 (USD MILLION)
- TABLE 72. NIGERIA DIGITAL POWER METERS MARKET SIZE, BY PHASE, 2018-2030 (USD MILLION)
- TABLE 73. NIGERIA DIGITAL POWER METERS MARKET SIZE, BY APPLICATION, 2018-2030 (USD MILLION)
- TABLE 74. NORWAY DIGITAL POWER METERS MARKET SIZE, BY PHASE, 2018-2030 (USD MILLION)
- TABLE 75. NORWAY DIGITAL POWER METERS MARKET SIZE, BY APPLICATION, 2018-2030 (USD MILLION)
- TABLE 76. POLAND DIGITAL POWER METERS MARKET SIZE, BY PHASE, 2018-2030 (USD MILLION)
- TABLE 77. POLAND DIGITAL POWER METERS MARKET SIZE, BY APPLICATION, 2018-2030 (USD MILLION)
- TABLE 78. QATAR DIGITAL POWER METERS MARKET SIZE, BY PHASE, 2018-2030 (USD MILLION)
- TABLE 79. QATAR DIGITAL POWER METERS MARKET SIZE, BY APPLICATION, 2018-2030 (USD MILLION)
- TABLE 80. RUSSIA DIGITAL POWER METERS MARKET SIZE, BY PHASE, 2018-2030 (USD MILLION)
- TABLE 81. RUSSIA DIGITAL POWER METERS MARKET SIZE, BY APPLICATION, 2018-2030 (USD MILLION)
- TABLE 82. SAUDI ARABIA DIGITAL POWER METERS MARKET SIZE, BY PHASE, 2018-2030 (USD MILLION)
- TABLE 83. SAUDI ARABIA DIGITAL POWER METERS MARKET SIZE, BY APPLICATION, 2018-2030 (USD MILLION)
- TABLE 84. SOUTH AFRICA DIGITAL POWER METERS MARKET SIZE, BY PHASE, 2018-2030 (USD MILLION)
- TABLE 85. SOUTH AFRICA DIGITAL POWER METERS MARKET SIZE, BY APPLICATION, 2018-2030 (USD MILLION)
- TABLE 86. SPAIN DIGITAL POWER METERS MARKET SIZE, BY PHASE, 2018-2030 (USD MILLION)
- TABLE 87. SPAIN DIGITAL POWER METERS MARKET SIZE, BY APPLICATION, 2018-2030 (USD MILLION)
- TABLE 88. SWEDEN DIGITAL POWER METERS MARKET SIZE, BY PHASE, 2018-2030 (USD MILLION)
- TABLE 89. SWEDEN DIGITAL POWER METERS MARKET SIZE, BY APPLICATION, 2018-2030 (USD MILLION)
- TABLE 90. SWITZERLAND DIGITAL POWER METERS MARKET SIZE, BY PHASE, 2018-2030 (USD MILLION)
- TABLE 91. SWITZERLAND DIGITAL POWER METERS MARKET SIZE, BY APPLICATION, 2018-2030 (USD MILLION)
- TABLE 92. TURKEY DIGITAL POWER METERS MARKET SIZE, BY PHASE, 2018-2030 (USD MILLION)
- TABLE 93. TURKEY DIGITAL POWER METERS MARKET SIZE, BY APPLICATION, 2018-2030 (USD MILLION)
- TABLE 94. UNITED ARAB EMIRATES DIGITAL POWER METERS MARKET SIZE, BY PHASE, 2018-2030 (USD MILLION)
- TABLE 95. UNITED ARAB EMIRATES DIGITAL POWER METERS MARKET SIZE, BY APPLICATION, 2018-2030 (USD MILLION)
- TABLE 96. UNITED KINGDOM DIGITAL POWER METERS MARKET SIZE, BY PHASE, 2018-2030 (USD MILLION)
- TABLE 97. UNITED KINGDOM DIGITAL POWER METERS MARKET SIZE, BY APPLICATION, 2018-2030 (USD MILLION)
- TABLE 98. DIGITAL POWER METERS MARKET, FPNV POSITIONING MATRIX, 2023
- TABLE 99. DIGITAL POWER METERS MARKET SHARE, BY KEY PLAYER, 2023
- TABLE 100. DIGITAL POWER METERS MARKET LICENSE & PRICING
[189 Pages Report] The Digital Power Meters Market size was estimated at USD 10.04 billion in 2023 and expected to reach USD 11.26 billion in 2024, at a CAGR 12.54% to reach USD 22.96 billion by 2030.
Global Digital Power Meters Market
| KEY MARKET STATISTICS | |
|---|---|
| Base Year [2023] | USD 10.04 billion |
| Estimated Year [2024] | USD 11.26 billion |
| Forecast Year [2030] | USD 22.96 billion |
| CAGR (%) | 12.54% |
Digital Power Meters are advanced measurement devices that record the amount of electric energy consumed by a residence, business establishment, or an electronically powered device. Unlike their analog predecessors, these meters employ digital technology to collect, process, and display the data. They are known for their high accuracy, reliability, and ability to provide detailed information about power usage over time. These meters typically feature a digital display and may incorporate sophisticated functions such as time-of-use billing, data communication, and remote reading capabilities. They can monitor various electrical parameters, including voltage, current, power factor, and kilowatt-hours (kWh) energy consumption. Growing number of smart homes with increasing awareness about energy conservation and government initiatives for energy management and smart grid technologies increases the adoption of digital power meters. However, concerns regarding data security and the complex functionality of digital meters with high initial costs may impede market growth. Nevertheless, developing sophisticated energy management software with research into advanced battery storage integration is anticipated to create lucrative opportunities for market growth.
Regional Insights
The Americas is showcasing a strong demand for digital power meters driven by concerted efforts for energy efficiency and grid modernization. These countries have become significant digital power meter technology consumers with many smart homes and an ongoing transition to smart grids. Customers in these territories are inclined towards integrated solutions providing real-time monitoring and energy management. Initiatives such as the U.S. Smart Grid Investment Grant (SGIG) and Canada's Smart Grid Program underline the region's focus on enhancing power grid infrastructure, propelling demand for advanced metering devices. The EMEA region presents a diverse market landscape for digital power meters. The European Union's drive for digitalization and sustainable energy has significantly spurred the adoption of innovative metering solutions. Requirements for energy saving and efficient resource management make EU countries avid adopters of innovative grid technologies. Customers prefer products that align with stringent regulatory standards and provide data security. With its growing infrastructure and smart city projects, the Middle East is becoming increasingly receptive to advanced metering infrastructure (AMI). In Africa, there is growing awareness and adoption driven by the need for electricity monitoring and theft reduction. Several African countries now leverage mobile technology integration for pre-paid digital power meter solutions. The digital power meter market in Asia Pacific is driven by massive infrastructure projects that demand highly efficient power management systems. Furthermore, countries in this region focus on energy conservation and technologically sophisticated infrastructure that contributes significantly to market demand, with customer preferences skewed towards high-precision and durable power meters.
FPNV Positioning Matrix
The FPNV Positioning Matrix is pivotal in evaluating the Digital Power Meters Market. It offers a comprehensive assessment of vendors, examining key metrics related to Business Strategy and Product Satisfaction. This in-depth analysis empowers users to make well-informed decisions aligned with their requirements. Based on the evaluation, the vendors are then categorized into four distinct quadrants representing varying levels of success: Forefront (F), Pathfinder (P), Niche (N), or Vital (V).
Market Share Analysis
The Market Share Analysis is a comprehensive tool that provides an insightful and in-depth examination of the current state of vendors in the Digital Power Meters Market. By meticulously comparing and analyzing vendor contributions in terms of overall revenue, customer base, and other key metrics, we can offer companies a greater understanding of their performance and the challenges they face when competing for market share. Additionally, this analysis provides valuable insights into the competitive nature of the sector, including factors such as accumulation, fragmentation dominance, and amalgamation traits observed over the base year period studied. With this expanded level of detail, vendors can make more informed decisions and devise effective strategies to gain a competitive edge in the market.
Key Company Profiles
The report delves into recent significant developments in the Digital Power Meters Market, highlighting leading vendors and their innovative profiles. These include ABB Ltd., Advanced Electronics Company, Carrel Electrade Limited, Circutor SA, EASTRON ELECTRONIC CO., LTD., Eaton Corporation PLC, EKM Metering Inc., Elster Group GmbH by Honeywell International Inc., General Electric company, Holley Technology Ltd., HPL Electric and Power Limited, Iskraemeco Group, Itron, Inc., Jiangsu Linyang Energy Co., Ltd., Kamstrup A/S, Landis+Gyr AG, Murata Manufacturing Co., Ltd., Ningbo Sanxing Electric Co. Ltd., Osaki Electric Co. Ltd., Schneider Electric SE, Sensus by Xylem Inc., Siemens AG, Simpson Electric Company, Inc., TE Connectivity Ltd., and Wasion International Co., Ltd..
Market Segmentation & Coverage
This research report categorizes the Digital Power Meters Market to forecast the revenues and analyze trends in each of the following sub-markets:
- Phase
- Single Phase
- Three Phase
- Application
- Commercial
- Industrial
- Residential
- Region
- Americas
- Argentina
- Brazil
- Canada
- Mexico
- United States
- California
- Florida
- Illinois
- New York
- Ohio
- Pennsylvania
- Texas
- Asia-Pacific
- Australia
- China
- India
- Indonesia
- Japan
- Malaysia
- Philippines
- Singapore
- South Korea
- Taiwan
- Thailand
- Vietnam
- Europe, Middle East & Africa
- Denmark
- Egypt
- Finland
- France
- Germany
- Israel
- Italy
- Netherlands
- Nigeria
- Norway
- Poland
- Qatar
- Russia
- Saudi Arabia
- South Africa
- Spain
- Sweden
- Switzerland
- Turkey
- United Arab Emirates
- United Kingdom
- Americas
The report offers valuable insights on the following aspects:
1. Market Penetration: It presents comprehensive information on the market provided by key players.
2. Market Development: It delves deep into lucrative emerging markets and analyzes the penetration across mature market segments.
3. Market Diversification: It provides detailed information on new product launches, untapped geographic regions, recent developments, and investments.
4. Competitive Assessment & Intelligence: It conducts an exhaustive assessment of market shares, strategies, products, certifications, regulatory approvals, patent landscape, and manufacturing capabilities of the leading players.
5. Product Development & Innovation: It offers intelligent insights on future technologies, R&D activities, and breakthrough product developments.
The report addresses key questions such as:
1. What is the market size and forecast of the Digital Power Meters Market?
2. Which products, segments, applications, and areas should one consider investing in over the forecast period in the Digital Power Meters Market?
3. What are the technology trends and regulatory frameworks in the Digital Power Meters Market?
4. What is the market share of the leading vendors in the Digital Power Meters Market?
5. Which modes and strategic moves are suitable for entering the Digital Power Meters Market?
Table of Contents
1. Preface
- 1.1. Objectives of the Study
- 1.2. Market Segmentation & Coverage
- 1.3. Years Considered for the Study
- 1.4. Currency & Pricing
- 1.5. Language
- 1.6. Limitations
- 1.7. Assumptions
- 1.8. Stakeholders
2. Research Methodology
- 2.1. Define: Research Objective
- 2.2. Determine: Research Design
- 2.3. Prepare: Research Instrument
- 2.4. Collect: Data Source
- 2.5. Analyze: Data Interpretation
- 2.6. Formulate: Data Verification
- 2.7. Publish: Research Report
- 2.8. Repeat: Report Update
3. Executive Summary
4. Market Overview
- 4.1. Introduction
- 4.2. Digital Power Meters Market, by Region
5. Market Insights
- 5.1. Market Dynamics
- 5.1.1. Drivers
- 5.1.1.1. Growing number of smart homes with increasing awareness about energy conservation
- 5.1.1.2. Government initiatives for energy management and smart grid technologies
- 5.1.1.3. Increasing need for remote monitoring and control of energy usage
- 5.1.2. Restraints
- 5.1.2.1. High initial investment in digital power meter infrastructure
- 5.1.3. Opportunities
- 5.1.3.1. Expanding capabilities of digital power meters due to innovations in IoT and data analytics
- 5.1.3.2. Development of sophisticated energy management software with research into advanced battery storage integration
- 5.1.4. Challenges
- 5.1.4.1. Concern regarding data security and complex functionality of digital meters
- 5.1.1. Drivers
- 5.2. Market Segmentation Analysis
- 5.2.1. Phase: Three-phase meters are essential in industrial settings due to their ability to handle high loads and maintain power quality
- 5.2.2. Application: Evolving usage of digital power meters in the commercial sector
- 5.3. Market Trend Analysis
- 5.4. Cumulative Impact of High Inflation
- 5.5. Porter's Five Forces Analysis
- 5.5.1. Threat of New Entrants
- 5.5.2. Threat of Substitutes
- 5.5.3. Bargaining Power of Customers
- 5.5.4. Bargaining Power of Suppliers
- 5.5.5. Industry Rivalry
- 5.6. Value Chain & Critical Path Analysis
- 5.7. Regulatory Framework
6. Digital Power Meters Market, by Phase
- 6.1. Introduction
- 6.2. Single Phase
- 6.3. Three Phase
7. Digital Power Meters Market, by Application
- 7.1. Introduction
- 7.2. Commercial
- 7.3. Industrial
- 7.4. Residential
8. Americas Digital Power Meters Market
- 8.1. Introduction
- 8.2. Argentina
- 8.3. Brazil
- 8.4. Canada
- 8.5. Mexico
- 8.6. United States
9. Asia-Pacific Digital Power Meters Market
- 9.1. Introduction
- 9.2. Australia
- 9.3. China
- 9.4. India
- 9.5. Indonesia
- 9.6. Japan
- 9.7. Malaysia
- 9.8. Philippines
- 9.9. Singapore
- 9.10. South Korea
- 9.11. Taiwan
- 9.12. Thailand
- 9.13. Vietnam
10. Europe, Middle East & Africa Digital Power Meters Market
- 10.1. Introduction
- 10.2. Denmark
- 10.3. Egypt
- 10.4. Finland
- 10.5. France
- 10.6. Germany
- 10.7. Israel
- 10.8. Italy
- 10.9. Netherlands
- 10.10. Nigeria
- 10.11. Norway
- 10.12. Poland
- 10.13. Qatar
- 10.14. Russia
- 10.15. Saudi Arabia
- 10.16. South Africa
- 10.17. Spain
- 10.18. Sweden
- 10.19. Switzerland
- 10.20. Turkey
- 10.21. United Arab Emirates
- 10.22. United Kingdom
11. Competitive Landscape
- 11.1. FPNV Positioning Matrix
- 11.2. Market Share Analysis, By Key Player
- 11.3. Competitive Scenario Analysis, By Key Player
- 11.3.1. Merger & Acquisition
- 11.3.1.1. Gridspertise Acquires Nordic Metering Provider Aidon
- 11.3.2. New Product Launch & Enhancement
- 11.3.2.1. ABB India Strengthens its Portfolio of Energy Efficiency Devices with a New Range of Smart Metering Solutions for Efficient Energy Management
- 11.3.3. Award, Recognition, & Expansion
- 11.3.3.1. Adani Energy forms JV with IHC-backed Firm to Expand Smart-Meter Business
- 11.3.1. Merger & Acquisition
12. Competitive Portfolio
- 12.1. Key Company Profiles
- 12.1.1. ABB Ltd.
- 12.1.2. Advanced Electronics Company
- 12.1.3. Carrel Electrade Limited
- 12.1.4. Circutor SA
- 12.1.5. EASTRON ELECTRONIC CO., LTD.
- 12.1.6. Eaton Corporation PLC
- 12.1.7. EKM Metering Inc.
- 12.1.8. Elster Group GmbH by Honeywell International Inc.
- 12.1.9. General Electric company
- 12.1.10. Holley Technology Ltd.
- 12.1.11. HPL Electric and Power Limited
- 12.1.12. Iskraemeco Group
- 12.1.13. Itron, Inc.
- 12.1.14. Jiangsu Linyang Energy Co., Ltd.
- 12.1.15. Kamstrup A/S
- 12.1.16. Landis+Gyr AG
- 12.1.17. Murata Manufacturing Co., Ltd.
- 12.1.18. Ningbo Sanxing Electric Co. Ltd.
- 12.1.19. Osaki Electric Co. Ltd.
- 12.1.20. Schneider Electric SE
- 12.1.21. Sensus by Xylem Inc.
- 12.1.22. Siemens AG
- 12.1.23. Simpson Electric Company, Inc.
- 12.1.24. TE Connectivity Ltd.
- 12.1.25. Wasion International Co., Ltd.
- 12.2. Key Product Portfolio
13. Appendix
- 13.1. Discussion Guide
- 13.2. License & Pricing