 |
市場調査レポート
商品コード
1413872
ベルト張力計市場:タイプ別、用途別、機械・自動車修理-世界予測、2024~2030年Belt Tension Meter Market by Type (Flat Belt, Ribbed Belts, Round Belt), Application (Automotive Store (OEM)), Mechanical & Auto Repair) - Global Forecast 2024-2030 |
||||||
● お客様のご希望に応じて、既存データの加工や未掲載情報(例:国別セグメント)の追加などの対応が可能です。 詳細はお問い合わせください。

| ベルト張力計市場:タイプ別、用途別、機械・自動車修理-世界予測、2024~2030年 |
|
出版日: 2024年01月15日
発行: 360iResearch
ページ情報: 英文 180 Pages
納期: 即日から翌営業日
|
- 全表示
- 概要
- 図表
- 目次
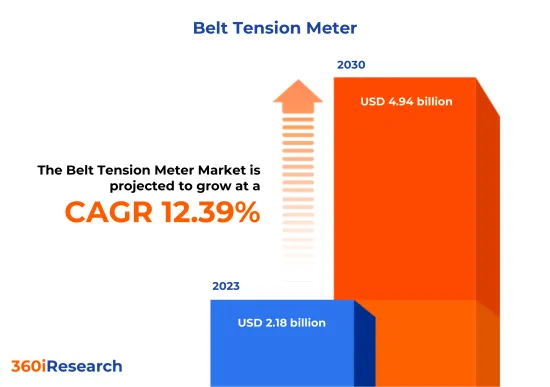
ベルト張力計市場規模は2023年に21億8,000万米ドルと推定され、2024年には24億4,000万米ドルに達し、CAGR 12.39%で2030年には49億4,000万米ドルに達すると予測されます。
ベルト張力計の世界市場
| 主要市場の統計 | |
|---|---|
| 基準年[2023年] | 21億8,000万米ドル |
| 予測年[2024年] | 24億4,000万米ドル |
| 予測年[2030年] | 49億4,000万米ドル |
| CAGR(%) | 12.39% |
ベルト張力計は、ベルトの張力を測定するための装置であり、ベルト駆動機械の最適な性能と寿命を確保するために重要です。このツールは、自動車、製造、マテリアルハンドリングなど、さまざまな産業で一般的に利用されています。利用が拡大している要因としては、予防保守への注目が高まっていること、生産性とコスト削減のために機械の効率的な運転を確保する必要があることなどが挙げられます。正確な張力測定や、ベルトの磨耗や機器の損傷につながる張力不足と張力過多の両方を防止できるなどの利点が、その採用に拍車をかけています。しかし、ベルト張力計には、その利点とは裏腹に、結果を正確に解釈するための技術的な専門知識が要求されることや、精度を維持するために定期的な校正が必要になる可能性があるなどの欠点があります。これらの課題は、担当者に十分なトレーニングを行い、装置のメンテナンススケジュールを厳守することで克服できます。さらに、技術の進歩やデジタルツールとの統合は、将来的なチャンスをもたらします。センサー技術と接続性の向上は、リアルタイムのモニタリングとフィードバックを提供するスマート張力計の開発につながる可能性があり、予知保全プログラムにおけるこれらの機器の使いやすさと有効性を向上させる。
地域別洞察
南北アメリカでは、ベルトの張力を正確に測定することが機械のメンテナンスと長寿命化に不可欠である自動車や産業部門が盛んなため、ベルト張力計の応用が広がっています。この地域でのメーターの生産は、精度と耐久性を確保するための技術革新に重点を置き、先進的なものとなっています。この地域で事業を展開する注目すべき企業は、世界の専門知識と現地の顧客サービスを融合させ、市場の需要を維持しています。アジア太平洋は、中国やインドなどの急成長する経済圏に特徴付けられ、主に自動車産業や製造業の拡大により、ベルト張力計に対する大きな需要を示しています。アジア太平洋の生産はコスト効率に特徴があり、世界市場で競合を発揮しています。アジア太平洋の企業は、製品の品質向上と販路拡大のために研究開発への投資を増やしています。一方、欧州、中東、アフリカ地域、特に欧州では、ベルト張力計の生産において、精密工学と高品質の基準に重点を置いています。この地域の安定した需要を支えているのは、機器のメンテナンスと産業安全に関する厳しい規制です。欧州、中東、アフリカで事業を展開する企業は、一般的に技術的な専門知識と、コンプライアンスやユーザー中心の設計への強いこだわりを兼ね備えており、事業における信頼性と規制の順守を重視する顧客に選ばれています。
FPNVポジショニングマトリックス
FPNVポジショニングマトリックスは、ベルト張力計市場の評価において極めて重要です。事業戦略と製品満足度に関連する主要指標を調査し、ベンダーの包括的な評価を提供します。この綿密な分析により、ユーザーは各自の要件に沿った十分な情報に基づいた意思決定を行うことができます。評価に基づき、ベンダーは成功の度合いが異なる4つの象限に分類されます。フォアフロント(F)、パスファインダー(P)、ニッチ(N)、バイタル(V)です。
市場シェア分析
市場シェア分析は、ベルト張力計市場におけるベンダーの現状について、洞察に満ちた詳細な調査を提供する包括的なツールです。全体的な収益、顧客基盤、その他の主要指標についてベンダーの貢献度を綿密に比較・分析することで、企業の業績や市場シェア争いの際に直面する課題について理解を深めることができます。さらに、この分析により、調査対象基準年に観察された累積、断片化の優位性、合併の特徴などの要因を含む、この分野の競合特性に関する貴重な考察が得られます。このような詳細レベルの拡大により、ベンダーはより多くの情報に基づいた意思決定を行い、市場で競争優位に立つための効果的な戦略を考案することができます。
本レポートは、以下の側面に関する貴重な洞察を提供しています:
1-市場の浸透度:主要企業が提供する市場に関する包括的な情報を提示しています。
2-市場の開拓度:有利な新興市場を深く掘り下げ、成熟市場セグメントにおける浸透度を分析しています。
3-市場の多様化:新製品の発売、未開拓の地域、最近の開発、投資に関する詳細な情報を提供します。
4-競合の評価と情報:市場シェア、戦略、製品、認証、規制状況、特許状況、主要企業の製造能力などを網羅的に評価します。
5-製品開発とイノベーション:将来の技術、研究開発活動、画期的な製品開発に関する知的洞察を提供します。
本レポートは、以下のような主要な質問に対応しています:
1-ベルト張力計市場の市場規模と予測は?
2-ベルト張力計市場の予測期間中に投資を検討すべき製品、セグメント、用途、分野は何か?
3-ベルト張力計市場における技術動向と規制の枠組みは?
4-ベルト張力計市場における主要ベンダーの市場シェアは?
5-ベルト張力計市場への参入に適した形態や戦略的手段は?
目次
第1章 序文
第2章 調査手法
第3章 エグゼクティブサマリー
第4章 市場概要
第5章 市場洞察
- 市場力学
- 促進要因
- 工業生産における正確な操作と安全性を確保する必要性の高まり
- 建設プロジェクトの拡大とインフラ開発活動の活発化
- 抑制要因
- ベルト張力計の技術的と性能上の制限
- 機会
- ベルト張力計の性能と効率を向上させる新たな進歩
- 自動車のベルト張力計を使用して特定のコンポーネントを測定と調整する
- 課題
- 特定の極端な条件下ではベルト張力計が機能しない
- 促進要因
- 市場セグメンテーション分析
- タイプ:より高い負荷に対応するためのリブ付きベルト張力計の可能性
- 用途:OEMメーカーによる高精度のベルト張力測定ツールのニーズ
- 市場動向分析
- 高インフレの累積的影響
- ポーターのファイブフォース分析
- バリューチェーンとクリティカルパス分析
- 規制の枠組み
第6章 ベルト張力計市場:タイプ別
- イントロダクション
- 平ベルト
- リブベルト
- 丸ベルト
- Vベルト
第7章 ベルト張力計市場:用途別
- イントロダクション
- 自動車販売店(OEM)
- 機械と自動車修理
第8章 南北アメリカのベルト張力計市場
- イントロダクション
- アルゼンチン
- ブラジル
- カナダ
- メキシコ
- 米国
第9章 アジア太平洋のベルト張力計市場
- イントロダクション
- オーストラリア
- 中国
- インド
- インドネシア
- 日本
- マレーシア
- フィリピン
- シンガポール
- 韓国
- 台湾
- タイ
- ベトナム
第10章 欧州・中東・アフリカのベルト張力計市場
- イントロダクション
- デンマーク
- エジプト
- フィンランド
- フランス
- ドイツ
- イスラエル
- イタリア
- オランダ
- ナイジェリア
- ノルウェー
- ポーランド
- カタール
- ロシア
- サウジアラビア
- 南アフリカ
- スペイン
- スウェーデン
- スイス
- トルコ
- アラブ首長国連邦
- 英国
第11章 競合情勢
- FPNVポジショニングマトリクス
- 市場シェア分析:主要企業別
- 競合シナリオ主要企業別の分析
- 新製品発売と機能強化
第12章 競合ポートフォリオ
- 主要な企業プロファイル
- AB SKF
- Bando Chemical Industries, LTD.
- BAR-TEK Motorsport GmbH
- BRECOflex CO., L.L.C.
- Checkline(ELECTROMATIC Equipment Co., Inc.)
- Continental AG
- Gates Corporation
- Hans Schmidt & Co GmbH
- Harley-Davidson, Inc.
- Hilger u. Kern GmbH
- Integrated Display System ltd.
- Mextech Technologies Pvt. Ltd
- norelem Normelemente GmbH & Co. KG
- One-Too Company
- PCE Instruments
- PIX Transmissions Ltd.
- Rainbow Precision Products
- S.A.M.A. Italia S.r.l.
- Schaeffler AG
- SIT S.p.A.
- SNA Europe
- Tensitron by KTC Instruments
- Timken Company
- Tsubakimoto Chain Co.
- TYMA CZ, s.r.o.
- VTSYIQI Lab Measuring Instruments
- West3D LLC
- 主要な製品ポートフォリオ
第13章 付録
- ディスカッションガイド
- ライセンスと価格について
LIST OF FIGURES
- FIGURE 1. BELT TENSION METER MARKET RESEARCH PROCESS
- FIGURE 2. BELT TENSION METER MARKET SIZE, 2023 VS 2030
- FIGURE 3. BELT TENSION METER MARKET SIZE, 2018-2030 (USD MILLION)
- FIGURE 4. BELT TENSION METER MARKET SIZE, BY REGION, 2023 VS 2030 (%)
- FIGURE 5. BELT TENSION METER MARKET SIZE, BY REGION, 2023 VS 2024 VS 2030 (USD MILLION)
- FIGURE 6. BELT TENSION METER MARKET DYNAMICS
- FIGURE 7. BELT TENSION METER MARKET SIZE, BY TYPE, 2023 VS 2030 (%)
- FIGURE 8. BELT TENSION METER MARKET SIZE, BY TYPE, 2023 VS 2024 VS 2030 (USD MILLION)
- FIGURE 9. BELT TENSION METER MARKET SIZE, BY APPLICATION, 2023 VS 2030 (%)
- FIGURE 10. BELT TENSION METER MARKET SIZE, BY APPLICATION, 2023 VS 2024 VS 2030 (USD MILLION)
- FIGURE 11. AMERICAS BELT TENSION METER MARKET SIZE, BY COUNTRY, 2023 VS 2030 (%)
- FIGURE 12. AMERICAS BELT TENSION METER MARKET SIZE, BY COUNTRY, 2023 VS 2024 VS 2030 (USD MILLION)
- FIGURE 13. UNITED STATES BELT TENSION METER MARKET SIZE, BY STATE, 2023 VS 2030 (%)
- FIGURE 14. UNITED STATES BELT TENSION METER MARKET SIZE, BY STATE, 2023 VS 2024 VS 2030 (USD MILLION)
- FIGURE 15. ASIA-PACIFIC BELT TENSION METER MARKET SIZE, BY COUNTRY, 2023 VS 2030 (%)
- FIGURE 16. ASIA-PACIFIC BELT TENSION METER MARKET SIZE, BY COUNTRY, 2023 VS 2024 VS 2030 (USD MILLION)
- FIGURE 17. EUROPE, MIDDLE EAST & AFRICA BELT TENSION METER MARKET SIZE, BY COUNTRY, 2023 VS 2030 (%)
- FIGURE 18. EUROPE, MIDDLE EAST & AFRICA BELT TENSION METER MARKET SIZE, BY COUNTRY, 2023 VS 2024 VS 2030 (USD MILLION)
- FIGURE 19. BELT TENSION METER MARKET, FPNV POSITIONING MATRIX, 2023
- FIGURE 20. BELT TENSION METER MARKET SHARE, BY KEY PLAYER, 2023
LIST OF TABLES
- TABLE 1. BELT TENSION METER MARKET SEGMENTATION & COVERAGE
- TABLE 2. UNITED STATES DOLLAR EXCHANGE RATE, 2018-2023
- TABLE 3. BELT TENSION METER MARKET SIZE, 2018-2030 (USD MILLION)
- TABLE 4. GLOBAL BELT TENSION METER MARKET SIZE, BY REGION, 2018-2030 (USD MILLION)
- TABLE 5. BELT TENSION METER MARKET SIZE, BY TYPE, 2018-2030 (USD MILLION)
- TABLE 6. BELT TENSION METER MARKET SIZE, BY FLAT BELT, BY REGION, 2018-2030 (USD MILLION)
- TABLE 7. BELT TENSION METER MARKET SIZE, BY RIBBED BELTS, BY REGION, 2018-2030 (USD MILLION)
- TABLE 8. BELT TENSION METER MARKET SIZE, BY ROUND BELT, BY REGION, 2018-2030 (USD MILLION)
- TABLE 9. BELT TENSION METER MARKET SIZE, BY V BELT, BY REGION, 2018-2030 (USD MILLION)
- TABLE 10. BELT TENSION METER MARKET SIZE, BY APPLICATION, 2018-2030 (USD MILLION)
- TABLE 11. BELT TENSION METER MARKET SIZE, BY AUTOMOTIVE STORE (OEM)), BY REGION, 2018-2030 (USD MILLION)
- TABLE 12. BELT TENSION METER MARKET SIZE, BY MECHANICAL & AUTO REPAIR, BY REGION, 2018-2030 (USD MILLION)
- TABLE 13. AMERICAS BELT TENSION METER MARKET SIZE, BY TYPE, 2018-2030 (USD MILLION)
- TABLE 14. AMERICAS BELT TENSION METER MARKET SIZE, BY APPLICATION, 2018-2030 (USD MILLION)
- TABLE 15. AMERICAS BELT TENSION METER MARKET SIZE, BY COUNTRY, 2018-2030 (USD MILLION)
- TABLE 16. ARGENTINA BELT TENSION METER MARKET SIZE, BY TYPE, 2018-2030 (USD MILLION)
- TABLE 17. ARGENTINA BELT TENSION METER MARKET SIZE, BY APPLICATION, 2018-2030 (USD MILLION)
- TABLE 18. BRAZIL BELT TENSION METER MARKET SIZE, BY TYPE, 2018-2030 (USD MILLION)
- TABLE 19. BRAZIL BELT TENSION METER MARKET SIZE, BY APPLICATION, 2018-2030 (USD MILLION)
- TABLE 20. CANADA BELT TENSION METER MARKET SIZE, BY TYPE, 2018-2030 (USD MILLION)
- TABLE 21. CANADA BELT TENSION METER MARKET SIZE, BY APPLICATION, 2018-2030 (USD MILLION)
- TABLE 22. MEXICO BELT TENSION METER MARKET SIZE, BY TYPE, 2018-2030 (USD MILLION)
- TABLE 23. MEXICO BELT TENSION METER MARKET SIZE, BY APPLICATION, 2018-2030 (USD MILLION)
- TABLE 24. UNITED STATES BELT TENSION METER MARKET SIZE, BY TYPE, 2018-2030 (USD MILLION)
- TABLE 25. UNITED STATES BELT TENSION METER MARKET SIZE, BY APPLICATION, 2018-2030 (USD MILLION)
- TABLE 26. UNITED STATES BELT TENSION METER MARKET SIZE, BY STATE, 2018-2030 (USD MILLION)
- TABLE 27. ASIA-PACIFIC BELT TENSION METER MARKET SIZE, BY TYPE, 2018-2030 (USD MILLION)
- TABLE 28. ASIA-PACIFIC BELT TENSION METER MARKET SIZE, BY APPLICATION, 2018-2030 (USD MILLION)
- TABLE 29. ASIA-PACIFIC BELT TENSION METER MARKET SIZE, BY COUNTRY, 2018-2030 (USD MILLION)
- TABLE 30. AUSTRALIA BELT TENSION METER MARKET SIZE, BY TYPE, 2018-2030 (USD MILLION)
- TABLE 31. AUSTRALIA BELT TENSION METER MARKET SIZE, BY APPLICATION, 2018-2030 (USD MILLION)
- TABLE 32. CHINA BELT TENSION METER MARKET SIZE, BY TYPE, 2018-2030 (USD MILLION)
- TABLE 33. CHINA BELT TENSION METER MARKET SIZE, BY APPLICATION, 2018-2030 (USD MILLION)
- TABLE 34. INDIA BELT TENSION METER MARKET SIZE, BY TYPE, 2018-2030 (USD MILLION)
- TABLE 35. INDIA BELT TENSION METER MARKET SIZE, BY APPLICATION, 2018-2030 (USD MILLION)
- TABLE 36. INDONESIA BELT TENSION METER MARKET SIZE, BY TYPE, 2018-2030 (USD MILLION)
- TABLE 37. INDONESIA BELT TENSION METER MARKET SIZE, BY APPLICATION, 2018-2030 (USD MILLION)
- TABLE 38. JAPAN BELT TENSION METER MARKET SIZE, BY TYPE, 2018-2030 (USD MILLION)
- TABLE 39. JAPAN BELT TENSION METER MARKET SIZE, BY APPLICATION, 2018-2030 (USD MILLION)
- TABLE 40. MALAYSIA BELT TENSION METER MARKET SIZE, BY TYPE, 2018-2030 (USD MILLION)
- TABLE 41. MALAYSIA BELT TENSION METER MARKET SIZE, BY APPLICATION, 2018-2030 (USD MILLION)
- TABLE 42. PHILIPPINES BELT TENSION METER MARKET SIZE, BY TYPE, 2018-2030 (USD MILLION)
- TABLE 43. PHILIPPINES BELT TENSION METER MARKET SIZE, BY APPLICATION, 2018-2030 (USD MILLION)
- TABLE 44. SINGAPORE BELT TENSION METER MARKET SIZE, BY TYPE, 2018-2030 (USD MILLION)
- TABLE 45. SINGAPORE BELT TENSION METER MARKET SIZE, BY APPLICATION, 2018-2030 (USD MILLION)
- TABLE 46. SOUTH KOREA BELT TENSION METER MARKET SIZE, BY TYPE, 2018-2030 (USD MILLION)
- TABLE 47. SOUTH KOREA BELT TENSION METER MARKET SIZE, BY APPLICATION, 2018-2030 (USD MILLION)
- TABLE 48. TAIWAN BELT TENSION METER MARKET SIZE, BY TYPE, 2018-2030 (USD MILLION)
- TABLE 49. TAIWAN BELT TENSION METER MARKET SIZE, BY APPLICATION, 2018-2030 (USD MILLION)
- TABLE 50. THAILAND BELT TENSION METER MARKET SIZE, BY TYPE, 2018-2030 (USD MILLION)
- TABLE 51. THAILAND BELT TENSION METER MARKET SIZE, BY APPLICATION, 2018-2030 (USD MILLION)
- TABLE 52. VIETNAM BELT TENSION METER MARKET SIZE, BY TYPE, 2018-2030 (USD MILLION)
- TABLE 53. VIETNAM BELT TENSION METER MARKET SIZE, BY APPLICATION, 2018-2030 (USD MILLION)
- TABLE 54. EUROPE, MIDDLE EAST & AFRICA BELT TENSION METER MARKET SIZE, BY TYPE, 2018-2030 (USD MILLION)
- TABLE 55. EUROPE, MIDDLE EAST & AFRICA BELT TENSION METER MARKET SIZE, BY APPLICATION, 2018-2030 (USD MILLION)
- TABLE 56. EUROPE, MIDDLE EAST & AFRICA BELT TENSION METER MARKET SIZE, BY COUNTRY, 2018-2030 (USD MILLION)
- TABLE 57. DENMARK BELT TENSION METER MARKET SIZE, BY TYPE, 2018-2030 (USD MILLION)
- TABLE 58. DENMARK BELT TENSION METER MARKET SIZE, BY APPLICATION, 2018-2030 (USD MILLION)
- TABLE 59. EGYPT BELT TENSION METER MARKET SIZE, BY TYPE, 2018-2030 (USD MILLION)
- TABLE 60. EGYPT BELT TENSION METER MARKET SIZE, BY APPLICATION, 2018-2030 (USD MILLION)
- TABLE 61. FINLAND BELT TENSION METER MARKET SIZE, BY TYPE, 2018-2030 (USD MILLION)
- TABLE 62. FINLAND BELT TENSION METER MARKET SIZE, BY APPLICATION, 2018-2030 (USD MILLION)
- TABLE 63. FRANCE BELT TENSION METER MARKET SIZE, BY TYPE, 2018-2030 (USD MILLION)
- TABLE 64. FRANCE BELT TENSION METER MARKET SIZE, BY APPLICATION, 2018-2030 (USD MILLION)
- TABLE 65. GERMANY BELT TENSION METER MARKET SIZE, BY TYPE, 2018-2030 (USD MILLION)
- TABLE 66. GERMANY BELT TENSION METER MARKET SIZE, BY APPLICATION, 2018-2030 (USD MILLION)
- TABLE 67. ISRAEL BELT TENSION METER MARKET SIZE, BY TYPE, 2018-2030 (USD MILLION)
- TABLE 68. ISRAEL BELT TENSION METER MARKET SIZE, BY APPLICATION, 2018-2030 (USD MILLION)
- TABLE 69. ITALY BELT TENSION METER MARKET SIZE, BY TYPE, 2018-2030 (USD MILLION)
- TABLE 70. ITALY BELT TENSION METER MARKET SIZE, BY APPLICATION, 2018-2030 (USD MILLION)
- TABLE 71. NETHERLANDS BELT TENSION METER MARKET SIZE, BY TYPE, 2018-2030 (USD MILLION)
- TABLE 72. NETHERLANDS BELT TENSION METER MARKET SIZE, BY APPLICATION, 2018-2030 (USD MILLION)
- TABLE 73. NIGERIA BELT TENSION METER MARKET SIZE, BY TYPE, 2018-2030 (USD MILLION)
- TABLE 74. NIGERIA BELT TENSION METER MARKET SIZE, BY APPLICATION, 2018-2030 (USD MILLION)
- TABLE 75. NORWAY BELT TENSION METER MARKET SIZE, BY TYPE, 2018-2030 (USD MILLION)
- TABLE 76. NORWAY BELT TENSION METER MARKET SIZE, BY APPLICATION, 2018-2030 (USD MILLION)
- TABLE 77. POLAND BELT TENSION METER MARKET SIZE, BY TYPE, 2018-2030 (USD MILLION)
- TABLE 78. POLAND BELT TENSION METER MARKET SIZE, BY APPLICATION, 2018-2030 (USD MILLION)
- TABLE 79. QATAR BELT TENSION METER MARKET SIZE, BY TYPE, 2018-2030 (USD MILLION)
- TABLE 80. QATAR BELT TENSION METER MARKET SIZE, BY APPLICATION, 2018-2030 (USD MILLION)
- TABLE 81. RUSSIA BELT TENSION METER MARKET SIZE, BY TYPE, 2018-2030 (USD MILLION)
- TABLE 82. RUSSIA BELT TENSION METER MARKET SIZE, BY APPLICATION, 2018-2030 (USD MILLION)
- TABLE 83. SAUDI ARABIA BELT TENSION METER MARKET SIZE, BY TYPE, 2018-2030 (USD MILLION)
- TABLE 84. SAUDI ARABIA BELT TENSION METER MARKET SIZE, BY APPLICATION, 2018-2030 (USD MILLION)
- TABLE 85. SOUTH AFRICA BELT TENSION METER MARKET SIZE, BY TYPE, 2018-2030 (USD MILLION)
- TABLE 86. SOUTH AFRICA BELT TENSION METER MARKET SIZE, BY APPLICATION, 2018-2030 (USD MILLION)
- TABLE 87. SPAIN BELT TENSION METER MARKET SIZE, BY TYPE, 2018-2030 (USD MILLION)
- TABLE 88. SPAIN BELT TENSION METER MARKET SIZE, BY APPLICATION, 2018-2030 (USD MILLION)
- TABLE 89. SWEDEN BELT TENSION METER MARKET SIZE, BY TYPE, 2018-2030 (USD MILLION)
- TABLE 90. SWEDEN BELT TENSION METER MARKET SIZE, BY APPLICATION, 2018-2030 (USD MILLION)
- TABLE 91. SWITZERLAND BELT TENSION METER MARKET SIZE, BY TYPE, 2018-2030 (USD MILLION)
- TABLE 92. SWITZERLAND BELT TENSION METER MARKET SIZE, BY APPLICATION, 2018-2030 (USD MILLION)
- TABLE 93. TURKEY BELT TENSION METER MARKET SIZE, BY TYPE, 2018-2030 (USD MILLION)
- TABLE 94. TURKEY BELT TENSION METER MARKET SIZE, BY APPLICATION, 2018-2030 (USD MILLION)
- TABLE 95. UNITED ARAB EMIRATES BELT TENSION METER MARKET SIZE, BY TYPE, 2018-2030 (USD MILLION)
- TABLE 96. UNITED ARAB EMIRATES BELT TENSION METER MARKET SIZE, BY APPLICATION, 2018-2030 (USD MILLION)
- TABLE 97. UNITED KINGDOM BELT TENSION METER MARKET SIZE, BY TYPE, 2018-2030 (USD MILLION)
- TABLE 98. UNITED KINGDOM BELT TENSION METER MARKET SIZE, BY APPLICATION, 2018-2030 (USD MILLION)
- TABLE 99. BELT TENSION METER MARKET, FPNV POSITIONING MATRIX, 2023
- TABLE 100. BELT TENSION METER MARKET SHARE, BY KEY PLAYER, 2023
- TABLE 101. BELT TENSION METER MARKET LICENSE & PRICING
[180 Pages Report] The Belt Tension Meter Market size was estimated at USD 2.18 billion in 2023 and expected to reach USD 2.44 billion in 2024, at a CAGR 12.39% to reach USD 4.94 billion by 2030.
Global Belt Tension Meter Market
| KEY MARKET STATISTICS | |
|---|---|
| Base Year [2023] | USD 2.18 billion |
| Estimated Year [2024] | USD 2.44 billion |
| Forecast Year [2030] | USD 4.94 billion |
| CAGR (%) | 12.39% |
A belt tension meter is a device used to measure the amount of tension in belts, which is crucial for ensuring the optimal performance and longevity of belt-driven machinery. This tool is commonly utilized in a range of industries, including automotive, manufacturing, and material handling. Factors contributing to their expanding use include the increased focus on preventative maintenance and the need to ensure efficient operation of machinery for productivity and cost savings. Advantages such as precise tension measurements and the prevention of both under-tensioning and over-tensioning, which can lead to belt wear and equipment damage, fuel their adoption. However, despite their benefits, belt tension meters come with disadvantages, such as the requirement for technical expertise to interpret the results accurately and the potential need for regular calibration to maintain precision. These challenges can be overcome by providing adequate training to personnel and adhering to a strict maintenance schedule for the device. Moreover, technological advancements and integration with digital tools present future opportunities. Improvements in sensor technology and connectivity could lead to the development of smart tension meters that provide real-time monitoring and feedback, improving the ease of use and effectiveness of these instruments in predictive maintenance programs.
Regional Insights
In the Americas, the application of belt tension meters is widespread due to the region's robust automotive and industrial sectors, where precise belt tensioning is crucial for machinery maintenance and longevity. Production of these meters in this region is advanced, with an emphasis on technological innovation to ensure accuracy and durability. Notable companies operating in the region merge global expertise with local customer service to sustain market demands. The APAC region, marked by fast-growing economies such as China and India, exhibits a significant demand for belt tension meters, primarily driven by the expanding automotive and manufacturing industries. Production in APAC is often characterized by cost efficiency, which positions it competitively in the global market. Companies in the APAC region are increasingly investing in research and development to improve product quality and expand their reach. Meanwhile, the EMEA region, particularly Europe, maintains a focus on precision engineering and high-quality standards in the production of belt tension meters. Stringent regulations pertaining to equipment maintenance and industrial safety underpin the steady demand within this region. Companies operating in EMEA typically combine technological expertise with a strong focus on compliance and user-centric designs, making them a preferred choice for customers who value reliability and regulatory adherence in their operations.
FPNV Positioning Matrix
The FPNV Positioning Matrix is pivotal in evaluating the Belt Tension Meter Market. It offers a comprehensive assessment of vendors, examining key metrics related to Business Strategy and Product Satisfaction. This in-depth analysis empowers users to make well-informed decisions aligned with their requirements. Based on the evaluation, the vendors are then categorized into four distinct quadrants representing varying levels of success: Forefront (F), Pathfinder (P), Niche (N), or Vital (V).
Market Share Analysis
The Market Share Analysis is a comprehensive tool that provides an insightful and in-depth examination of the current state of vendors in the Belt Tension Meter Market. By meticulously comparing and analyzing vendor contributions in terms of overall revenue, customer base, and other key metrics, we can offer companies a greater understanding of their performance and the challenges they face when competing for market share. Additionally, this analysis provides valuable insights into the competitive nature of the sector, including factors such as accumulation, fragmentation dominance, and amalgamation traits observed over the base year period studied. With this expanded level of detail, vendors can make more informed decisions and devise effective strategies to gain a competitive edge in the market.
Key Company Profiles
The report delves into recent significant developments in the Belt Tension Meter Market, highlighting leading vendors and their innovative profiles. These include AB SKF, Bando Chemical Industries, LTD., BAR-TEK Motorsport GmbH, BRECOflex CO., L.L.C., Checkline (ELECTROMATIC Equipment Co., Inc.), Continental AG, Gates Corporation, Hans Schmidt & Co GmbH, Harley-Davidson, Inc., Hilger u. Kern GmbH, Integrated Display System ltd., Mextech Technologies Pvt. Ltd, norelem Normelemente GmbH & Co. KG, One-Too Company, PCE Instruments, PIX Transmissions Ltd., Rainbow Precision Products, S.A.M.A. Italia S.r.l., Schaeffler AG, SIT S.p.A., SNA Europe, Tensitron by KTC Instruments, Timken Company, Tsubakimoto Chain Co., TYMA CZ, s.r.o., VTSYIQI Lab Measuring Instruments, and West3D LLC.
Market Segmentation & Coverage
This research report categorizes the Belt Tension Meter Market to forecast the revenues and analyze trends in each of the following sub-markets:
- Type
- Flat Belt
- Ribbed Belts
- Round Belt
- V Belt
- Application
- Automotive Store (OEM))
- Mechanical & Auto Repair
- Region
- Americas
- Argentina
- Brazil
- Canada
- Mexico
- United States
- California
- Florida
- Illinois
- New York
- Ohio
- Pennsylvania
- Texas
- Asia-Pacific
- Australia
- China
- India
- Indonesia
- Japan
- Malaysia
- Philippines
- Singapore
- South Korea
- Taiwan
- Thailand
- Vietnam
- Europe, Middle East & Africa
- Denmark
- Egypt
- Finland
- France
- Germany
- Israel
- Italy
- Netherlands
- Nigeria
- Norway
- Poland
- Qatar
- Russia
- Saudi Arabia
- South Africa
- Spain
- Sweden
- Switzerland
- Turkey
- United Arab Emirates
- United Kingdom
- Americas
The report offers valuable insights on the following aspects:
1. Market Penetration: It presents comprehensive information on the market provided by key players.
2. Market Development: It delves deep into lucrative emerging markets and analyzes the penetration across mature market segments.
3. Market Diversification: It provides detailed information on new product launches, untapped geographic regions, recent developments, and investments.
4. Competitive Assessment & Intelligence: It conducts an exhaustive assessment of market shares, strategies, products, certifications, regulatory approvals, patent landscape, and manufacturing capabilities of the leading players.
5. Product Development & Innovation: It offers intelligent insights on future technologies, R&D activities, and breakthrough product developments.
The report addresses key questions such as:
1. What is the market size and forecast of the Belt Tension Meter Market?
2. Which products, segments, applications, and areas should one consider investing in over the forecast period in the Belt Tension Meter Market?
3. What are the technology trends and regulatory frameworks in the Belt Tension Meter Market?
4. What is the market share of the leading vendors in the Belt Tension Meter Market?
5. Which modes and strategic moves are suitable for entering the Belt Tension Meter Market?
Table of Contents
1. Preface
- 1.1. Objectives of the Study
- 1.2. Market Segmentation & Coverage
- 1.3. Years Considered for the Study
- 1.4. Currency & Pricing
- 1.5. Language
- 1.6. Limitations
- 1.7. Assumptions
- 1.8. Stakeholders
2. Research Methodology
- 2.1. Define: Research Objective
- 2.2. Determine: Research Design
- 2.3. Prepare: Research Instrument
- 2.4. Collect: Data Source
- 2.5. Analyze: Data Interpretation
- 2.6. Formulate: Data Verification
- 2.7. Publish: Research Report
- 2.8. Repeat: Report Update
3. Executive Summary
4. Market Overview
- 4.1. Introduction
- 4.2. Belt Tension Meter Market, by Region
5. Market Insights
- 5.1. Market Dynamics
- 5.1.1. Drivers
- 5.1.1.1. Growing need to ensure precise operations and safety in industrial production
- 5.1.1.2. Expansion of construction projects and rising infrastructure development activities
- 5.1.2. Restraints
- 5.1.2.1. Technical and performance limitations of belt tension meters
- 5.1.3. Opportunities
- 5.1.3.1. Novel advancements to improve the performance and efficiency of belt tension meters
- 5.1.3.2. Utilization of belt tension meters in automobiles to measure and adjust certain components
- 5.1.4. Challenges
- 5.1.4.1. Inability of belt tension meters to work in certain extreme conditions
- 5.1.1. Drivers
- 5.2. Market Segmentation Analysis
- 5.2.1. Type: Potential of ribbed belts tension meter to accommodate higher loads
- 5.2.2. Application: Need for highly precise belt tension measurement tools by original equipment manufacturers
- 5.3. Market Trend Analysis
- 5.4. Cumulative Impact of High Inflation
- 5.5. Porter's Five Forces Analysis
- 5.5.1. Threat of New Entrants
- 5.5.2. Threat of Substitutes
- 5.5.3. Bargaining Power of Customers
- 5.5.4. Bargaining Power of Suppliers
- 5.5.5. Industry Rivalry
- 5.6. Value Chain & Critical Path Analysis
- 5.7. Regulatory Framework
6. Belt Tension Meter Market, by Type
- 6.1. Introduction
- 6.2. Flat Belt
- 6.3. Ribbed Belts
- 6.4. Round Belt
- 6.5. V Belt
7. Belt Tension Meter Market, by Application
- 7.1. Introduction
- 7.2. Automotive Store (OEM))
- 7.3. Mechanical & Auto Repair
8. Americas Belt Tension Meter Market
- 8.1. Introduction
- 8.2. Argentina
- 8.3. Brazil
- 8.4. Canada
- 8.5. Mexico
- 8.6. United States
9. Asia-Pacific Belt Tension Meter Market
- 9.1. Introduction
- 9.2. Australia
- 9.3. China
- 9.4. India
- 9.5. Indonesia
- 9.6. Japan
- 9.7. Malaysia
- 9.8. Philippines
- 9.9. Singapore
- 9.10. South Korea
- 9.11. Taiwan
- 9.12. Thailand
- 9.13. Vietnam
10. Europe, Middle East & Africa Belt Tension Meter Market
- 10.1. Introduction
- 10.2. Denmark
- 10.3. Egypt
- 10.4. Finland
- 10.5. France
- 10.6. Germany
- 10.7. Israel
- 10.8. Italy
- 10.9. Netherlands
- 10.10. Nigeria
- 10.11. Norway
- 10.12. Poland
- 10.13. Qatar
- 10.14. Russia
- 10.15. Saudi Arabia
- 10.16. South Africa
- 10.17. Spain
- 10.18. Sweden
- 10.19. Switzerland
- 10.20. Turkey
- 10.21. United Arab Emirates
- 10.22. United Kingdom
11. Competitive Landscape
- 11.1. FPNV Positioning Matrix
- 11.2. Market Share Analysis, By Key Player
- 11.3. Competitive Scenario Analysis, By Key Player
- 11.3.1. New Product Launch & Enhancement
- 11.3.1.1. NTN Develops "Twin Arm Auto Tensioner for Accessory Drive Belt System"
- 11.3.1. New Product Launch & Enhancement
12. Competitive Portfolio
- 12.1. Key Company Profiles
- 12.1.1. AB SKF
- 12.1.2. Bando Chemical Industries, LTD.
- 12.1.3. BAR-TEK Motorsport GmbH
- 12.1.4. BRECOflex CO., L.L.C.
- 12.1.5. Checkline (ELECTROMATIC Equipment Co., Inc.)
- 12.1.6. Continental AG
- 12.1.7. Gates Corporation
- 12.1.8. Hans Schmidt & Co GmbH
- 12.1.9. Harley-Davidson, Inc.
- 12.1.10. Hilger u. Kern GmbH
- 12.1.11. Integrated Display System ltd.
- 12.1.12. Mextech Technologies Pvt. Ltd
- 12.1.13. norelem Normelemente GmbH & Co. KG
- 12.1.14. One-Too Company
- 12.1.15. PCE Instruments
- 12.1.16. PIX Transmissions Ltd.
- 12.1.17. Rainbow Precision Products
- 12.1.18. S.A.M.A. Italia S.r.l.
- 12.1.19. Schaeffler AG
- 12.1.20. SIT S.p.A.
- 12.1.21. SNA Europe
- 12.1.22. Tensitron by KTC Instruments
- 12.1.23. Timken Company
- 12.1.24. Tsubakimoto Chain Co.
- 12.1.25. TYMA CZ, s.r.o.
- 12.1.26. VTSYIQI Lab Measuring Instruments
- 12.1.27. West3D LLC
- 12.2. Key Product Portfolio
13. Appendix
- 13.1. Discussion Guide
- 13.2. License & Pricing