|
|
市場調査レポート
商品コード
1792188
半導体製造ソフトウェアの世界市場 2025年~2029年Global Semiconductor Fabrication Software Market 2025-2029 |
||||||

|
|||||||
カスタマイズ可能
|
|||||||


| 半導体製造ソフトウェアの世界市場 2025年~2029年 |
|
出版日: 2025年08月08日
発行: TechNavio
ページ情報: 英文 245 Pages
納期: 即納可能
|

全表示
- 概要
- 図表
- 目次
半導体製造ソフトウェア市場は2024年~2029年に8億1,390万米ドル拡大し、予測期間中のCAGRは2.1%と予測されます。
当レポートでは、半導体製造ソフトウェア市場の全体的な分析、市場規模・予測、動向、成長促進要因、課題、約25のベンダーを網羅したベンダー分析などを掲載しています。
現在の市場シナリオ、最新動向と促進要因、市場環境全体に関する最新分析を提供しています。市場は、半導体デバイス設計の複雑化、SOC技術への要求の高まり、各分野における高精度な小型電子デバイスへの需要によって牽引されています。
| 市場範囲 | |
|---|---|
| 基準年 | 2025年 |
| 終了年 | 2029年 |
| 予測期間 | 2025年~2029年 |
| 成長モメンタム | 加速 |
| 前年比 | 2.1% |
| CAGR | 2.1% |
| 増分額 | 8億1,390万米ドル |
本調査は、業界の主要参加者からのインプットを含め、一次情報と二次情報を客観的に組み合わせて実施しました。レポートには、主要企業の分析に加え、包括的な市場規模データ、地域別分析によるセグメント、ベンダー情勢が含まれています。レポートには過去データと予測データがあります。
本調査では、半導体メモリデバイスに対する高いニーズが、今後数年間の半導体製造ソフトウェア市場の成長を促進する主要な理由の1つであると指摘しています。また、ウェアラブル技術の受け入れ拡大やスマートシティへの投資拡大も、市場の大きな需要につながると思われます。
目次
第1章 エグゼクティブサマリー
- 市場概要
第2章 Technavio分析
- 価格・ライフサイクル・顧客購入バスケット・採用率・購入基準の分析
- インプットの重要性と差別化の要因
- 混乱の要因
- 促進要因と課題の影響
第3章 市場情勢
- 市場エコシステム
- 市場の特徴
- バリューチェーン分析
第4章 市場規模
- 市場の定義
- 市場セグメント分析
- 市場規模、2024年
- 市場の見通し、2024年~2029年
第5章 市場規模実績
- 半導体製造ソフトウェアの世界市場、2019年~2023年
- ソリューション別セグメント分析、2019年~2023年
- 用途別セグメント分析、2019年~2023年
- エンドユーザー別セグメント分析、2019年~2023年
- 展開別セグメント分析、2019年~2023年
- 地域別セグメント分析、2019年~2023年
- 国別セグメント分析、2019年~2023年
第6章 定性分析
- AIの影響:半導体製造ソフトウェアの世界市場
第7章 ファイブフォース分析
- ファイブフォースの要約
- 買い手の交渉力
- 供給企業の交渉力
- 新規参入業者の脅威
- 代替品の脅威
- 競争の脅威
- 市況
第8章 市場セグメンテーション:ソリューション別
- 市場セグメント
- 比較:ソリューション別
- CAE:市場規模と予測、2024年~2029年
- IC物理設計と検証:市場規模と予測、2024年~2029年
- PCBとMCM:市場規模と予測、2024年~2029年
- ファブ管理ソフトウェア:市場規模と予測、2024年~2029年
- その他:市場規模と予測、2024年~2029年
- 市場機会:ソリューション別
第9章 市場セグメンテーション:用途別
- 市場セグメント
- 比較:用途別
- ウエハー製造:市場規模と予測、2024年~2029年
- 組み立てと梱包:市場規模と予測、2024年~2029年
- 試験と検査:市場規模と予測、2024年~2029年
- 市場機会:用途別
第10章 市場セグメンテーション:エンドユーザー別
- 市場セグメント
- 比較:エンドユーザー別
- IDM:市場規模と予測、2024年~2029年
- 鋳造:市場規模と予測、2024年~2029年
- OSAT:市場規模と予測、2024年~2029年
- 市場機会:エンドユーザー別
第11章 市場セグメンテーション:展開別
- 市場セグメント
- 比較:展開別
- オンプレミス:市場規模と予測、2024年~2029年
- クラウドベース:市場規模と予測、2024年~2029年
- 市場機会:展開別
第12章 顧客情勢
- 顧客情勢の概要
第13章 地域別情勢
- 地域別セグメンテーション
- 地域別比較
- アジア太平洋:市場規模と予測、2024年~2029年
- 北米:市場規模と予測、2024年~2029年
- 欧州:市場規模と予測、2024年~2029年
- 中東・アフリカ:市場規模と予測、2024年~2029年
- 南米:市場規模と予測、2024年~2029年
- 米国:市場規模と予測、2024年~2029年
- 中国:市場規模と予測、2024年~2029年
- 台湾:市場規模と予測、2024年~2029年
- 韓国:市場規模と予測、2024年~2029年
- 日本:市場規模と予測、2024年~2029年
- カナダ:市場規模と予測、2024年~2029年
- 英国:市場規模と予測、2024年~2029年
- ドイツ:市場規模と予測、2024年~2029年
- フランス:市場規模と予測、2024年~2029年
- インド:市場規模と予測、2024年~2029年
- 市場機会:地域情勢別
第14章 促進要因・課題・機会・抑制要因
- 市場促進要因
- 市場の課題
- 促進要因と課題の影響
- 市場の機会・抑制要因
第15章 競合情勢
- 概要
- 競合情勢
- 混乱の状況
- 業界のリスク
第16章 競合分析
- 企業プロファイル
- 企業ランキング指数
- 企業の市場ポジショニング
- Agnisys Inc.
- Aldec Inc.
- ANSYS Inc.
- Applied Materials Inc.
- Cadence Design Systems Inc.
- Keysight Technologies Inc.
- KLA Corp.
- Lam Research Corp.
- Onto Innovation Inc.
- PDF Solutions
- Siemens AG
- Synopsys Inc.
- The PEER Group Inc.
- Thermo Fisher Scientific Inc.
- Zuken Inc.
第17章 付録
Exhibits:
- Exhibits1: Executive Summary - Chart on Market Overview
- Exhibits2: Executive Summary - Data Table on Market Overview
- Exhibits3: Executive Summary - Chart on Global Market Characteristics
- Exhibits4: Executive Summary - Chart on Market By Geographical Landscape
- Exhibits5: Executive Summary - Chart on Market Segmentation by Solution
- Exhibits6: Executive Summary - Chart on Market Segmentation by Application
- Exhibits7: Executive Summary - Chart on Market Segmentation by End-user
- Exhibits8: Executive Summary - Chart on Market Segmentation by Deployment
- Exhibits9: Executive Summary - Chart on Incremental Growth
- Exhibits10: Executive Summary - Data Table on Incremental Growth
- Exhibits11: Executive Summary - Chart on Company Market Positioning
- Exhibits12: Analysis of price sensitivity, lifecycle, customer purchase basket, adoption rates, and purchase criteria
- Exhibits13: Overview on criticality of inputs and factors of differentiation
- Exhibits14: Overview on factors of disruption
- Exhibits15: Impact of drivers and challenges in 2024 and 2029
- Exhibits16: Parent Market
- Exhibits17: Data Table on - Parent Market
- Exhibits18: Market characteristics analysis
- Exhibits19: Value chain analysis
- Exhibits20: Offerings of companies included in the market definition
- Exhibits21: Market segments
- Exhibits22: Chart on Global - Market size and forecast 2024-2029 ($ million)
- Exhibits23: Data Table on Global - Market size and forecast 2024-2029 ($ million)
- Exhibits24: Chart on Global Market: Year-over-year growth 2024-2029 (%)
- Exhibits25: Data Table on Global Market: Year-over-year growth 2024-2029 (%)
- Exhibits26: Historic Market Size - Data Table on Global Semiconductor Fabrication Software Market 2019 - 2023 ($ million)
- Exhibits27: Historic Market Size - Solution Segment 2019 - 2023 ($ million)
- Exhibits28: Historic Market Size - Application Segment 2019 - 2023 ($ million)
- Exhibits29: Historic Market Size - End-user Segment 2019 - 2023 ($ million)
- Exhibits30: Historic Market Size - Deployment Segment 2019 - 2023 ($ million)
- Exhibits31: Historic Market Size - Geography Segment 2019 - 2023 ($ million)
- Exhibits32: Historic Market Size - Country Segment 2019 - 2023 ($ million)
- Exhibits33: Five forces analysis - Comparison between 2024 and 2029
- Exhibits34: Bargaining power of buyers - Impact of key factors 2024 and 2029
- Exhibits35: Bargaining power of suppliers - Impact of key factors in 2024 and 2029
- Exhibits36: Threat of new entrants - Impact of key factors in 2024 and 2029
- Exhibits37: Threat of substitutes - Impact of key factors in 2024 and 2029
- Exhibits38: Threat of rivalry - Impact of key factors in 2024 and 2029
- Exhibits39: Chart on Market condition - Five forces 2024 and 2029
- Exhibits40: Chart on Solution - Market share 2024-2029 (%)
- Exhibits41: Data Table on Solution - Market share 2024-2029 (%)
- Exhibits42: Chart on Comparison by Solution
- Exhibits43: Data Table on Comparison by Solution
- Exhibits44: Chart on CAE - Market size and forecast 2024-2029 ($ million)
- Exhibits45: Data Table on CAE - Market size and forecast 2024-2029 ($ million)
- Exhibits46: Chart on CAE - Year-over-year growth 2024-2029 (%)
- Exhibits47: Data Table on CAE - Year-over-year growth 2024-2029 (%)
- Exhibits48: Chart on IC physical design and verification - Market size and forecast 2024-2029 ($ million)
- Exhibits49: Data Table on IC physical design and verification - Market size and forecast 2024-2029 ($ million)
- Exhibits50: Chart on IC physical design and verification - Year-over-year growth 2024-2029 (%)
- Exhibits51: Data Table on IC physical design and verification - Year-over-year growth 2024-2029 (%)
- Exhibits52: Chart on PCB and MCM - Market size and forecast 2024-2029 ($ million)
- Exhibits53: Data Table on PCB and MCM - Market size and forecast 2024-2029 ($ million)
- Exhibits54: Chart on PCB and MCM - Year-over-year growth 2024-2029 (%)
- Exhibits55: Data Table on PCB and MCM - Year-over-year growth 2024-2029 (%)
- Exhibits56: Chart on Fab management software - Market size and forecast 2024-2029 ($ million)
- Exhibits57: Data Table on Fab management software - Market size and forecast 2024-2029 ($ million)
- Exhibits58: Chart on Fab management software - Year-over-year growth 2024-2029 (%)
- Exhibits59: Data Table on Fab management software - Year-over-year growth 2024-2029 (%)
- Exhibits60: Chart on Others - Market size and forecast 2024-2029 ($ million)
- Exhibits61: Data Table on Others - Market size and forecast 2024-2029 ($ million)
- Exhibits62: Chart on Others - Year-over-year growth 2024-2029 (%)
- Exhibits63: Data Table on Others - Year-over-year growth 2024-2029 (%)
- Exhibits64: Market opportunity by Solution ($ million)
- Exhibits65: Data Table on Market opportunity by Solution ($ million)
- Exhibits66: Chart on Application - Market share 2024-2029 (%)
- Exhibits67: Data Table on Application - Market share 2024-2029 (%)
- Exhibits68: Chart on Comparison by Application
- Exhibits69: Data Table on Comparison by Application
- Exhibits70: Chart on Wafer fabrication - Market size and forecast 2024-2029 ($ million)
- Exhibits71: Data Table on Wafer fabrication - Market size and forecast 2024-2029 ($ million)
- Exhibits72: Chart on Wafer fabrication - Year-over-year growth 2024-2029 (%)
- Exhibits73: Data Table on Wafer fabrication - Year-over-year growth 2024-2029 (%)
- Exhibits74: Chart on Assembly and packaging - Market size and forecast 2024-2029 ($ million)
- Exhibits75: Data Table on Assembly and packaging - Market size and forecast 2024-2029 ($ million)
- Exhibits76: Chart on Assembly and packaging - Year-over-year growth 2024-2029 (%)
- Exhibits77: Data Table on Assembly and packaging - Year-over-year growth 2024-2029 (%)
- Exhibits78: Chart on Testing and inspection - Market size and forecast 2024-2029 ($ million)
- Exhibits79: Data Table on Testing and inspection - Market size and forecast 2024-2029 ($ million)
- Exhibits80: Chart on Testing and inspection - Year-over-year growth 2024-2029 (%)
- Exhibits81: Data Table on Testing and inspection - Year-over-year growth 2024-2029 (%)
- Exhibits82: Market opportunity by Application ($ million)
- Exhibits83: Data Table on Market opportunity by Application ($ million)
- Exhibits84: Chart on End-user - Market share 2024-2029 (%)
- Exhibits85: Data Table on End-user - Market share 2024-2029 (%)
- Exhibits86: Chart on Comparison by End-user
- Exhibits87: Data Table on Comparison by End-user
- Exhibits88: Chart on IDMs - Market size and forecast 2024-2029 ($ million)
- Exhibits89: Data Table on IDMs - Market size and forecast 2024-2029 ($ million)
- Exhibits90: Chart on IDMs - Year-over-year growth 2024-2029 (%)
- Exhibits91: Data Table on IDMs - Year-over-year growth 2024-2029 (%)
- Exhibits92: Chart on Foundries - Market size and forecast 2024-2029 ($ million)
- Exhibits93: Data Table on Foundries - Market size and forecast 2024-2029 ($ million)
- Exhibits94: Chart on Foundries - Year-over-year growth 2024-2029 (%)
- Exhibits95: Data Table on Foundries - Year-over-year growth 2024-2029 (%)
- Exhibits96: Chart on OSATs - Market size and forecast 2024-2029 ($ million)
- Exhibits97: Data Table on OSATs - Market size and forecast 2024-2029 ($ million)
- Exhibits98: Chart on OSATs - Year-over-year growth 2024-2029 (%)
- Exhibits99: Data Table on OSATs - Year-over-year growth 2024-2029 (%)
- Exhibits100: Market opportunity by End-user ($ million)
- Exhibits101: Data Table on Market opportunity by End-user ($ million)
- Exhibits102: Chart on Deployment - Market share 2024-2029 (%)
- Exhibits103: Data Table on Deployment - Market share 2024-2029 (%)
- Exhibits104: Chart on Comparison by Deployment
- Exhibits105: Data Table on Comparison by Deployment
- Exhibits106: Chart on On-premises - Market size and forecast 2024-2029 ($ million)
- Exhibits107: Data Table on On-premises - Market size and forecast 2024-2029 ($ million)
- Exhibits108: Chart on On-premises - Year-over-year growth 2024-2029 (%)
- Exhibits109: Data Table on On-premises - Year-over-year growth 2024-2029 (%)
- Exhibits110: Chart on Cloud-based - Market size and forecast 2024-2029 ($ million)
- Exhibits111: Data Table on Cloud-based - Market size and forecast 2024-2029 ($ million)
- Exhibits112: Chart on Cloud-based - Year-over-year growth 2024-2029 (%)
- Exhibits113: Data Table on Cloud-based - Year-over-year growth 2024-2029 (%)
- Exhibits114: Market opportunity by Deployment ($ million)
- Exhibits115: Data Table on Market opportunity by Deployment ($ million)
- Exhibits116: Analysis of price sensitivity, lifecycle, customer purchase basket, adoption rates, and purchase criteria
- Exhibits117: Chart on Market share By Geographical Landscape 2024-2029 (%)
- Exhibits118: Data Table on Market share By Geographical Landscape 2024-2029 (%)
- Exhibits119: Chart on Geographic comparison
- Exhibits120: Data Table on Geographic comparison
- Exhibits121: Chart on APAC - Market size and forecast 2024-2029 ($ million)
- Exhibits122: Data Table on APAC - Market size and forecast 2024-2029 ($ million)
- Exhibits123: Chart on APAC - Year-over-year growth 2024-2029 (%)
- Exhibits124: Data Table on APAC - Year-over-year growth 2024-2029 (%)
- Exhibits125: Chart on North America - Market size and forecast 2024-2029 ($ million)
- Exhibits126: Data Table on North America - Market size and forecast 2024-2029 ($ million)
- Exhibits127: Chart on North America - Year-over-year growth 2024-2029 (%)
- Exhibits128: Data Table on North America - Year-over-year growth 2024-2029 (%)
- Exhibits129: Chart on Europe - Market size and forecast 2024-2029 ($ million)
- Exhibits130: Data Table on Europe - Market size and forecast 2024-2029 ($ million)
- Exhibits131: Chart on Europe - Year-over-year growth 2024-2029 (%)
- Exhibits132: Data Table on Europe - Year-over-year growth 2024-2029 (%)
- Exhibits133: Chart on Middle East and Africa - Market size and forecast 2024-2029 ($ million)
- Exhibits134: Data Table on Middle East and Africa - Market size and forecast 2024-2029 ($ million)
- Exhibits135: Chart on Middle East and Africa - Year-over-year growth 2024-2029 (%)
- Exhibits136: Data Table on Middle East and Africa - Year-over-year growth 2024-2029 (%)
- Exhibits137: Chart on South America - Market size and forecast 2024-2029 ($ million)
- Exhibits138: Data Table on South America - Market size and forecast 2024-2029 ($ million)
- Exhibits139: Chart on South America - Year-over-year growth 2024-2029 (%)
- Exhibits140: Data Table on South America - Year-over-year growth 2024-2029 (%)
- Exhibits141: Chart on US - Market size and forecast 2024-2029 ($ million)
- Exhibits142: Data Table on US - Market size and forecast 2024-2029 ($ million)
- Exhibits143: Chart on US - Year-over-year growth 2024-2029 (%)
- Exhibits144: Data Table on US - Year-over-year growth 2024-2029 (%)
- Exhibits145: Chart on China - Market size and forecast 2024-2029 ($ million)
- Exhibits146: Data Table on China - Market size and forecast 2024-2029 ($ million)
- Exhibits147: Chart on China - Year-over-year growth 2024-2029 (%)
- Exhibits148: Data Table on China - Year-over-year growth 2024-2029 (%)
- Exhibits149: Chart on Taiwan - Market size and forecast 2024-2029 ($ million)
- Exhibits150: Data Table on Taiwan - Market size and forecast 2024-2029 ($ million)
- Exhibits151: Chart on Taiwan - Year-over-year growth 2024-2029 (%)
- Exhibits152: Data Table on Taiwan - Year-over-year growth 2024-2029 (%)
- Exhibits153: Chart on South Korea - Market size and forecast 2024-2029 ($ million)
- Exhibits154: Data Table on South Korea - Market size and forecast 2024-2029 ($ million)
- Exhibits155: Chart on South Korea - Year-over-year growth 2024-2029 (%)
- Exhibits156: Data Table on South Korea - Year-over-year growth 2024-2029 (%)
- Exhibits157: Chart on Japan - Market size and forecast 2024-2029 ($ million)
- Exhibits158: Data Table on Japan - Market size and forecast 2024-2029 ($ million)
- Exhibits159: Chart on Japan - Year-over-year growth 2024-2029 (%)
- Exhibits160: Data Table on Japan - Year-over-year growth 2024-2029 (%)
- Exhibits161: Chart on Canada - Market size and forecast 2024-2029 ($ million)
- Exhibits162: Data Table on Canada - Market size and forecast 2024-2029 ($ million)
- Exhibits163: Chart on Canada - Year-over-year growth 2024-2029 (%)
- Exhibits164: Data Table on Canada - Year-over-year growth 2024-2029 (%)
- Exhibits165: Chart on UK - Market size and forecast 2024-2029 ($ million)
- Exhibits166: Data Table on UK - Market size and forecast 2024-2029 ($ million)
- Exhibits167: Chart on UK - Year-over-year growth 2024-2029 (%)
- Exhibits168: Data Table on UK - Year-over-year growth 2024-2029 (%)
- Exhibits169: Chart on Germany - Market size and forecast 2024-2029 ($ million)
- Exhibits170: Data Table on Germany - Market size and forecast 2024-2029 ($ million)
- Exhibits171: Chart on Germany - Year-over-year growth 2024-2029 (%)
- Exhibits172: Data Table on Germany - Year-over-year growth 2024-2029 (%)
- Exhibits173: Chart on France - Market size and forecast 2024-2029 ($ million)
- Exhibits174: Data Table on France - Market size and forecast 2024-2029 ($ million)
- Exhibits175: Chart on France - Year-over-year growth 2024-2029 (%)
- Exhibits176: Data Table on France - Year-over-year growth 2024-2029 (%)
- Exhibits177: Chart on India - Market size and forecast 2024-2029 ($ million)
- Exhibits178: Data Table on India - Market size and forecast 2024-2029 ($ million)
- Exhibits179: Chart on India - Year-over-year growth 2024-2029 (%)
- Exhibits180: Data Table on India - Year-over-year growth 2024-2029 (%)
- Exhibits181: Market opportunity By Geographical Landscape ($ million)
- Exhibits182: Data Tables on Market opportunity By Geographical Landscape ($ million)
- Exhibits183: Impact of drivers and challenges in 2024 and 2029
- Exhibits184: Overview on criticality of inputs and factors of differentiation
- Exhibits185: Overview on factors of disruption
- Exhibits186: Impact of key risks on business
- Exhibits187: Companies covered
- Exhibits188: Company ranking index
- Exhibits189: Matrix on companies position and classification
- Exhibits190: Agnisys Inc. - Overview
- Exhibits191: Agnisys Inc. - Product / Service
- Exhibits192: Agnisys Inc. - Key offerings
- Exhibits193: SWOT
- Exhibits194: Aldec Inc. - Overview
- Exhibits195: Aldec Inc. - Product / Service
- Exhibits196: Aldec Inc. - Key offerings
- Exhibits197: SWOT
- Exhibits198: ANSYS Inc. - Overview
- Exhibits199: ANSYS Inc. - Business segments
- Exhibits200: ANSYS Inc. - Key news
- Exhibits201: ANSYS Inc. - Key offerings
- Exhibits202: ANSYS Inc. - Segment focus
- Exhibits203: SWOT
- Exhibits204: Applied Materials Inc. - Overview
- Exhibits205: Applied Materials Inc. - Business segments
- Exhibits206: Applied Materials Inc. - Key offerings
- Exhibits207: Applied Materials Inc. - Segment focus
- Exhibits208: SWOT
- Exhibits209: Cadence Design Systems Inc. - Overview
- Exhibits210: Cadence Design Systems Inc. - Business segments
- Exhibits211: Cadence Design Systems Inc. - Key news
- Exhibits212: Cadence Design Systems Inc. - Key offerings
- Exhibits213: Cadence Design Systems Inc. - Segment focus
- Exhibits214: SWOT
- Exhibits215: Keysight Technologies Inc. - Overview
- Exhibits216: Keysight Technologies Inc. - Business segments
- Exhibits217: Keysight Technologies Inc. - Key news
- Exhibits218: Keysight Technologies Inc. - Key offerings
- Exhibits219: Keysight Technologies Inc. - Segment focus
- Exhibits220: SWOT
- Exhibits221: KLA Corp. - Overview
- Exhibits222: KLA Corp. - Business segments
- Exhibits223: KLA Corp. - Key offerings
- Exhibits224: KLA Corp. - Segment focus
- Exhibits225: SWOT
- Exhibits226: Lam Research Corp. - Overview
- Exhibits227: Lam Research Corp. - Product / Service
- Exhibits228: Lam Research Corp. - Key offerings
- Exhibits229: SWOT
- Exhibits230: Onto Innovation Inc. - Overview
- Exhibits231: Onto Innovation Inc. - Product / Service
- Exhibits232: Onto Innovation Inc. - Key offerings
- Exhibits233: SWOT
- Exhibits234: PDF Solutions - Overview
- Exhibits235: PDF Solutions - Product / Service
- Exhibits236: PDF Solutions - Key offerings
- Exhibits237: SWOT
- Exhibits238: Siemens AG - Overview
- Exhibits239: Siemens AG - Business segments
- Exhibits240: Siemens AG - Key news
- Exhibits241: Siemens AG - Key offerings
- Exhibits242: Siemens AG - Segment focus
- Exhibits243: SWOT
- Exhibits244: Synopsys Inc. - Overview
- Exhibits245: Synopsys Inc. - Business segments
- Exhibits246: Synopsys Inc. - Key news
- Exhibits247: Synopsys Inc. - Key offerings
- Exhibits248: Synopsys Inc. - Segment focus
- Exhibits249: SWOT
- Exhibits250: The PEER Group Inc. - Overview
- Exhibits251: The PEER Group Inc. - Product / Service
- Exhibits252: The PEER Group Inc. - Key offerings
- Exhibits253: SWOT
- Exhibits254: Thermo Fisher Scientific Inc. - Overview
- Exhibits255: Thermo Fisher Scientific Inc. - Business segments
- Exhibits256: Thermo Fisher Scientific Inc. - Key news
- Exhibits257: Thermo Fisher Scientific Inc. - Key offerings
- Exhibits258: Thermo Fisher Scientific Inc. - Segment focus
- Exhibits259: SWOT
- Exhibits260: Zuken Inc. - Overview
- Exhibits261: Zuken Inc. - Product / Service
- Exhibits262: Zuken Inc. - Key offerings
- Exhibits263: SWOT
- Exhibits264: Inclusions checklist
- Exhibits265: Exclusions checklist
- Exhibits266: Currency conversion rates for US$
- Exhibits267: Research methodology
- Exhibits268: Information sources
- Exhibits269: Data validation
- Exhibits270: Validation techniques employed for market sizing
- Exhibits271: Data synthesis
- Exhibits272: 360 degree market analysis
- Exhibits273: List of abbreviations
The semiconductor fabrication software market is forecasted to grow by USD 813.9 mn during 2024-2029, accelerating at a CAGR of 2.1% during the forecast period. The report on the semiconductor fabrication software market provides a holistic analysis, market size and forecast, trends, growth drivers, and challenges, as well as vendor analysis covering around 25 vendors.
The report offers an up-to-date analysis regarding the current market scenario, the latest trends and drivers, and the overall market environment. The market is driven by growing complexity of semiconductor device designs, increasing requirement for SOC technology, and demand for miniaturized electronic devices of high precision across sectors.
| Market Scope | |
|---|---|
| Base Year | 2025 |
| End Year | 2029 |
| Series Year | 2025-2029 |
| Growth Momentum | Accelerate |
| YOY 2025 | 2.1% |
| CAGR | 2.1% |
| Incremental Value | $813.9 mn |
The study was conducted using an objective combination of primary and secondary information including inputs from key participants in the industry. The report contains a comprehensive market size data, segment with regional analysis and vendor landscape in addition to an analysis of the key companies. Reports have historic and forecast data.
Technavio's semiconductor fabrication software market is segmented as below:
By Solution
- CAE
- IC physical design and verification
- PCB and MCM
- Fab management software
- Others
By Application
- Wafer fabrication
- Assembly and packaging
- Testing and inspection
By End-user
- IDMs
- Foundries
- OSATs
By Deployment
- On-premises
- Cloud-based
By Geographical Landscape
- APAC
- North America
- Europe
- Middle East and Africa
- South America
This study identifies the high need for semiconductor memory devices as one of the prime reasons driving the semiconductor fabrication software market growth during the next few years. Also, growing acceptance of wearable technology and growing investment in smart cities will lead to sizable demand in the market.
The report on the semiconductor fabrication software market covers the following areas:
- Semiconductor Fabrication Software Market sizing
- Semiconductor Fabrication Software Market forecast
- Semiconductor Fabrication Software Market industry analysis
The robust vendor analysis is designed to help clients improve their market position, and in line with this, this report provides a detailed analysis of several leading semiconductor fabrication software market vendors that include Agnisys Inc., Aldec Inc., ANSYS Inc., Applied Materials Inc., Cadence Design Systems Inc., Cantier Systems Pte Ltd., Fabmatics GmbH, Keysight Technologies Inc., KLA Corp., Lam Research Corp., Mindteck India Ltd., Onto Innovation Inc., PDF Solutions, Sasken Technologies Ltd., Siemens AG, Synopsys Inc., The PEER Group Inc., Thermo Fisher Scientific Inc., Tismo Technology Solutions Pvt. Ltd., and Zuken Inc.. Also, the semiconductor fabrication software market analysis report includes information on upcoming trends and challenges that will influence market growth. This is to help companies strategize and leverage all forthcoming growth opportunities.
The publisher presents a detailed picture of the market by the way of study, synthesis, and summation of data from multiple sources by an analysis of key parameters such as profit, pricing, competition, and promotions. It presents various market facets by identifying the key industry influencers. The data presented is comprehensive, reliable, and a result of extensive primary and secondary research. The market research reports provide a complete competitive landscape and an in-depth vendor selection methodology and analysis using qualitative and quantitative research to forecast accurate market growth.
Table of Contents
1 Executive Summary
- 1.1 Market overview
- Executive Summary - Chart on Market Overview
- Executive Summary - Data Table on Market Overview
- Executive Summary - Chart on Global Market Characteristics
- Executive Summary - Chart on Market By Geographical Landscape
- Executive Summary - Chart on Market Segmentation by Solution
- Executive Summary - Chart on Market Segmentation by Application
- Executive Summary - Chart on Market Segmentation by End-user
- Executive Summary - Chart on Market Segmentation by Deployment
- Executive Summary - Chart on Incremental Growth
- Executive Summary - Data Table on Incremental Growth
- Executive Summary - Chart on Company Market Positioning
2 Technavio Analysis
- 2.1 Analysis of price sensitivity, lifecycle, customer purchase basket, adoption rates, and purchase criteria
- Analysis of price sensitivity, lifecycle, customer purchase basket, adoption rates, and purchase criteria
- 2.2 Criticality of inputs and Factors of differentiation
- Overview on criticality of inputs and factors of differentiation
- 2.3 Factors of disruption
- Overview on factors of disruption
- 2.4 Impact of drivers and challenges
- Impact of drivers and challenges in 2024 and 2029
3 Market Landscape
- 3.1 Market ecosystem
- Parent Market
- Data Table on - Parent Market
- 3.2 Market characteristics
- Market characteristics analysis
- 3.3 Value chain analysis
- Value chain analysis
4 Market Sizing
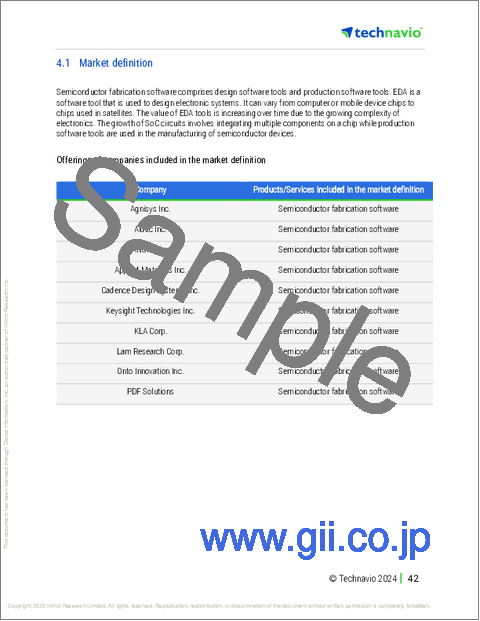
- 4.1 Market definition
- Offerings of companies included in the market definition
- 4.2 Market segment analysis
- Market segments
- 4.3 Market size 2024
- 4.4 Market outlook: Forecast for 2024-2029
- Chart on Global - Market size and forecast 2024-2029 ($ million)
- Data Table on Global - Market size and forecast 2024-2029 ($ million)
- Chart on Global Market: Year-over-year growth 2024-2029 (%)
- Data Table on Global Market: Year-over-year growth 2024-2029 (%)
5 Historic Market Size
- 5.1 Global Semiconductor Fabrication Software Market 2019 - 2023
- Historic Market Size - Data Table on Global Semiconductor Fabrication Software Market 2019 - 2023 ($ million)
- 5.2 Solution segment analysis 2019 - 2023
- Historic Market Size - Solution Segment 2019 - 2023 ($ million)
- 5.3 Application segment analysis 2019 - 2023
- Historic Market Size - Application Segment 2019 - 2023 ($ million)
- 5.4 End-user segment analysis 2019 - 2023
- Historic Market Size - End-user Segment 2019 - 2023 ($ million)
- 5.5 Deployment segment analysis 2019 - 2023
- Historic Market Size - Deployment Segment 2019 - 2023 ($ million)
- 5.6 Geography segment analysis 2019 - 2023
- Historic Market Size - Geography Segment 2019 - 2023 ($ million)
- 5.7 Country segment analysis 2019 - 2023
- Historic Market Size - Country Segment 2019 - 2023 ($ million)
6 Qualitative Analysis
- 6.1 The AI impact on Global Semiconductor Fabrication Software Market
7 Five Forces Analysis
- 7.1 Five forces summary
- Five forces analysis - Comparison between 2024 and 2029
- 7.2 Bargaining power of buyers
- Bargaining power of buyers - Impact of key factors 2024 and 2029
- 7.3 Bargaining power of suppliers
- Bargaining power of suppliers - Impact of key factors in 2024 and 2029
- 7.4 Threat of new entrants
- Threat of new entrants - Impact of key factors in 2024 and 2029
- 7.5 Threat of substitutes
- Threat of substitutes - Impact of key factors in 2024 and 2029
- 7.6 Threat of rivalry
- Threat of rivalry - Impact of key factors in 2024 and 2029
- 7.7 Market condition
- Chart on Market condition - Five forces 2024 and 2029
8 Market Segmentation by Solution
- 8.1 Market segments
- Chart on Solution - Market share 2024-2029 (%)
- Data Table on Solution - Market share 2024-2029 (%)
- 8.2 Comparison by Solution
- Chart on Comparison by Solution
- Data Table on Comparison by Solution
- 8.3 CAE - Market size and forecast 2024-2029
- Chart on CAE - Market size and forecast 2024-2029 ($ million)
- Data Table on CAE - Market size and forecast 2024-2029 ($ million)
- Chart on CAE - Year-over-year growth 2024-2029 (%)
- Data Table on CAE - Year-over-year growth 2024-2029 (%)
- 8.4 IC physical design and verification - Market size and forecast 2024-2029
- Chart on IC physical design and verification - Market size and forecast 2024-2029 ($ million)
- Data Table on IC physical design and verification - Market size and forecast 2024-2029 ($ million)
- Chart on IC physical design and verification - Year-over-year growth 2024-2029 (%)
- Data Table on IC physical design and verification - Year-over-year growth 2024-2029 (%)
- 8.5 PCB and MCM - Market size and forecast 2024-2029
- Chart on PCB and MCM - Market size and forecast 2024-2029 ($ million)
- Data Table on PCB and MCM - Market size and forecast 2024-2029 ($ million)
- Chart on PCB and MCM - Year-over-year growth 2024-2029 (%)
- Data Table on PCB and MCM - Year-over-year growth 2024-2029 (%)
- 8.6 Fab management software - Market size and forecast 2024-2029
- Chart on Fab management software - Market size and forecast 2024-2029 ($ million)
- Data Table on Fab management software - Market size and forecast 2024-2029 ($ million)
- Chart on Fab management software - Year-over-year growth 2024-2029 (%)
- Data Table on Fab management software - Year-over-year growth 2024-2029 (%)
- 8.7 Others - Market size and forecast 2024-2029
- Chart on Others - Market size and forecast 2024-2029 ($ million)
- Data Table on Others - Market size and forecast 2024-2029 ($ million)
- Chart on Others - Year-over-year growth 2024-2029 (%)
- Data Table on Others - Year-over-year growth 2024-2029 (%)
- 8.8 Market opportunity by Solution
- Market opportunity by Solution ($ million)
- Data Table on Market opportunity by Solution ($ million)
9 Market Segmentation by Application
- 9.1 Market segments
- Chart on Application - Market share 2024-2029 (%)
- Data Table on Application - Market share 2024-2029 (%)
- 9.2 Comparison by Application
- Chart on Comparison by Application
- Data Table on Comparison by Application
- 9.3 Wafer fabrication - Market size and forecast 2024-2029
- Chart on Wafer fabrication - Market size and forecast 2024-2029 ($ million)
- Data Table on Wafer fabrication - Market size and forecast 2024-2029 ($ million)
- Chart on Wafer fabrication - Year-over-year growth 2024-2029 (%)
- Data Table on Wafer fabrication - Year-over-year growth 2024-2029 (%)
- 9.4 Assembly and packaging - Market size and forecast 2024-2029
- Chart on Assembly and packaging - Market size and forecast 2024-2029 ($ million)
- Data Table on Assembly and packaging - Market size and forecast 2024-2029 ($ million)
- Chart on Assembly and packaging - Year-over-year growth 2024-2029 (%)
- Data Table on Assembly and packaging - Year-over-year growth 2024-2029 (%)
- 9.5 Testing and inspection - Market size and forecast 2024-2029
- Chart on Testing and inspection - Market size and forecast 2024-2029 ($ million)
- Data Table on Testing and inspection - Market size and forecast 2024-2029 ($ million)
- Chart on Testing and inspection - Year-over-year growth 2024-2029 (%)
- Data Table on Testing and inspection - Year-over-year growth 2024-2029 (%)
- 9.6 Market opportunity by Application
- Market opportunity by Application ($ million)
- Data Table on Market opportunity by Application ($ million)
10 Market Segmentation by End-user
- 10.1 Market segments
- Chart on End-user - Market share 2024-2029 (%)
- Data Table on End-user - Market share 2024-2029 (%)
- 10.2 Comparison by End-user
- Chart on Comparison by End-user
- Data Table on Comparison by End-user
- 10.3 IDMs - Market size and forecast 2024-2029
- Chart on IDMs - Market size and forecast 2024-2029 ($ million)
- Data Table on IDMs - Market size and forecast 2024-2029 ($ million)
- Chart on IDMs - Year-over-year growth 2024-2029 (%)
- Data Table on IDMs - Year-over-year growth 2024-2029 (%)
- 10.4 Foundries - Market size and forecast 2024-2029
- Chart on Foundries - Market size and forecast 2024-2029 ($ million)
- Data Table on Foundries - Market size and forecast 2024-2029 ($ million)
- Chart on Foundries - Year-over-year growth 2024-2029 (%)
- Data Table on Foundries - Year-over-year growth 2024-2029 (%)
- 10.5 OSATs - Market size and forecast 2024-2029
- Chart on OSATs - Market size and forecast 2024-2029 ($ million)
- Data Table on OSATs - Market size and forecast 2024-2029 ($ million)
- Chart on OSATs - Year-over-year growth 2024-2029 (%)
- Data Table on OSATs - Year-over-year growth 2024-2029 (%)
- 10.6 Market opportunity by End-user
- Market opportunity by End-user ($ million)
- Data Table on Market opportunity by End-user ($ million)
11 Market Segmentation by Deployment
- 11.1 Market segments
- Chart on Deployment - Market share 2024-2029 (%)
- Data Table on Deployment - Market share 2024-2029 (%)
- 11.2 Comparison by Deployment
- Chart on Comparison by Deployment
- Data Table on Comparison by Deployment
- 11.3 On-premises - Market size and forecast 2024-2029
- Chart on On-premises - Market size and forecast 2024-2029 ($ million)
- Data Table on On-premises - Market size and forecast 2024-2029 ($ million)
- Chart on On-premises - Year-over-year growth 2024-2029 (%)
- Data Table on On-premises - Year-over-year growth 2024-2029 (%)
- 11.4 Cloud-based - Market size and forecast 2024-2029
- Chart on Cloud-based - Market size and forecast 2024-2029 ($ million)
- Data Table on Cloud-based - Market size and forecast 2024-2029 ($ million)
- Chart on Cloud-based - Year-over-year growth 2024-2029 (%)
- Data Table on Cloud-based - Year-over-year growth 2024-2029 (%)
- 11.5 Market opportunity by Deployment
- Market opportunity by Deployment ($ million)
- Data Table on Market opportunity by Deployment ($ million)
12 Customer Landscape
- 12.1 Customer landscape overview
- Analysis of price sensitivity, lifecycle, customer purchase basket, adoption rates, and purchase criteria
13 Geographic Landscape
- 13.1 Geographic segmentation
- Chart on Market share By Geographical Landscape 2024-2029 (%)
- Data Table on Market share By Geographical Landscape 2024-2029 (%)
- 13.2 Geographic comparison
- Chart on Geographic comparison
- Data Table on Geographic comparison
- 13.3 APAC - Market size and forecast 2024-2029
- Chart on APAC - Market size and forecast 2024-2029 ($ million)
- Data Table on APAC - Market size and forecast 2024-2029 ($ million)
- Chart on APAC - Year-over-year growth 2024-2029 (%)
- Data Table on APAC - Year-over-year growth 2024-2029 (%)
- 13.4 North America - Market size and forecast 2024-2029
- Chart on North America - Market size and forecast 2024-2029 ($ million)
- Data Table on North America - Market size and forecast 2024-2029 ($ million)
- Chart on North America - Year-over-year growth 2024-2029 (%)
- Data Table on North America - Year-over-year growth 2024-2029 (%)
- 13.5 Europe - Market size and forecast 2024-2029
- Chart on Europe - Market size and forecast 2024-2029 ($ million)
- Data Table on Europe - Market size and forecast 2024-2029 ($ million)
- Chart on Europe - Year-over-year growth 2024-2029 (%)
- Data Table on Europe - Year-over-year growth 2024-2029 (%)
- 13.6 Middle East and Africa - Market size and forecast 2024-2029
- Chart on Middle East and Africa - Market size and forecast 2024-2029 ($ million)
- Data Table on Middle East and Africa - Market size and forecast 2024-2029 ($ million)
- Chart on Middle East and Africa - Year-over-year growth 2024-2029 (%)
- Data Table on Middle East and Africa - Year-over-year growth 2024-2029 (%)
- 13.7 South America - Market size and forecast 2024-2029
- Chart on South America - Market size and forecast 2024-2029 ($ million)
- Data Table on South America - Market size and forecast 2024-2029 ($ million)
- Chart on South America - Year-over-year growth 2024-2029 (%)
- Data Table on South America - Year-over-year growth 2024-2029 (%)
- 13.8 US - Market size and forecast 2024-2029
- Chart on US - Market size and forecast 2024-2029 ($ million)
- Data Table on US - Market size and forecast 2024-2029 ($ million)
- Chart on US - Year-over-year growth 2024-2029 (%)
- Data Table on US - Year-over-year growth 2024-2029 (%)
- 13.9 China - Market size and forecast 2024-2029
- Chart on China - Market size and forecast 2024-2029 ($ million)
- Data Table on China - Market size and forecast 2024-2029 ($ million)
- Chart on China - Year-over-year growth 2024-2029 (%)
- Data Table on China - Year-over-year growth 2024-2029 (%)
- 13.10 Taiwan - Market size and forecast 2024-2029
- Chart on Taiwan - Market size and forecast 2024-2029 ($ million)
- Data Table on Taiwan - Market size and forecast 2024-2029 ($ million)
- Chart on Taiwan - Year-over-year growth 2024-2029 (%)
- Data Table on Taiwan - Year-over-year growth 2024-2029 (%)
- 13.11 South Korea - Market size and forecast 2024-2029
- Chart on South Korea - Market size and forecast 2024-2029 ($ million)
- Data Table on South Korea - Market size and forecast 2024-2029 ($ million)
- Chart on South Korea - Year-over-year growth 2024-2029 (%)
- Data Table on South Korea - Year-over-year growth 2024-2029 (%)
- 13.12 Japan - Market size and forecast 2024-2029
- Chart on Japan - Market size and forecast 2024-2029 ($ million)
- Data Table on Japan - Market size and forecast 2024-2029 ($ million)
- Chart on Japan - Year-over-year growth 2024-2029 (%)
- Data Table on Japan - Year-over-year growth 2024-2029 (%)
- 13.13 Canada - Market size and forecast 2024-2029
- Chart on Canada - Market size and forecast 2024-2029 ($ million)
- Data Table on Canada - Market size and forecast 2024-2029 ($ million)
- Chart on Canada - Year-over-year growth 2024-2029 (%)
- Data Table on Canada - Year-over-year growth 2024-2029 (%)
- 13.14 UK - Market size and forecast 2024-2029
- Chart on UK - Market size and forecast 2024-2029 ($ million)
- Data Table on UK - Market size and forecast 2024-2029 ($ million)
- Chart on UK - Year-over-year growth 2024-2029 (%)
- Data Table on UK - Year-over-year growth 2024-2029 (%)
- 13.15 Germany - Market size and forecast 2024-2029
- Chart on Germany - Market size and forecast 2024-2029 ($ million)
- Data Table on Germany - Market size and forecast 2024-2029 ($ million)
- Chart on Germany - Year-over-year growth 2024-2029 (%)
- Data Table on Germany - Year-over-year growth 2024-2029 (%)
- 13.16 France - Market size and forecast 2024-2029
- Chart on France - Market size and forecast 2024-2029 ($ million)
- Data Table on France - Market size and forecast 2024-2029 ($ million)
- Chart on France - Year-over-year growth 2024-2029 (%)
- Data Table on France - Year-over-year growth 2024-2029 (%)
- 13.17 India - Market size and forecast 2024-2029
- Chart on India - Market size and forecast 2024-2029 ($ million)
- Data Table on India - Market size and forecast 2024-2029 ($ million)
- Chart on India - Year-over-year growth 2024-2029 (%)
- Data Table on India - Year-over-year growth 2024-2029 (%)
- 13.18 Market opportunity By Geographical Landscape
- Market opportunity By Geographical Landscape ($ million)
- Data Tables on Market opportunity By Geographical Landscape ($ million)
14 Drivers, Challenges, and Opportunity/Restraints
- 14.1 Market drivers
- 14.2 Market challenges
- 14.3 Impact of drivers and challenges
- Impact of drivers and challenges in 2024 and 2029
- 14.4 Market opportunities/restraints
15 Competitive Landscape
- 15.1 Overview
- 15.2 Competitive Landscape
- Overview on criticality of inputs and factors of differentiation
- 15.3 Landscape disruption
- Overview on factors of disruption
- 15.4 Industry risks
- Impact of key risks on business
16 Competitive Analysis
- 16.1 Companies profiled
- Companies covered
- 16.2 Company ranking index
- Company ranking index
- 16.3 Market positioning of companies
- Matrix on companies position and classification
- 16.4 Agnisys Inc.
- Agnisys Inc. - Overview
- Agnisys Inc. - Product / Service
- Agnisys Inc. - Key offerings
- SWOT
- 16.5 Aldec Inc.
- Aldec Inc. - Overview
- Aldec Inc. - Product / Service
- Aldec Inc. - Key offerings
- SWOT
- 16.6 ANSYS Inc.
- ANSYS Inc. - Overview
- ANSYS Inc. - Business segments
- ANSYS Inc. - Key news
- ANSYS Inc. - Key offerings
- ANSYS Inc. - Segment focus
- SWOT
- 16.7 Applied Materials Inc.
- Applied Materials Inc. - Overview
- Applied Materials Inc. - Business segments
- Applied Materials Inc. - Key offerings
- Applied Materials Inc. - Segment focus
- SWOT
- 16.8 Cadence Design Systems Inc.
- Cadence Design Systems Inc. - Overview
- Cadence Design Systems Inc. - Business segments
- Cadence Design Systems Inc. - Key news
- Cadence Design Systems Inc. - Key offerings
- Cadence Design Systems Inc. - Segment focus
- SWOT
- 16.9 Keysight Technologies Inc.
- Keysight Technologies Inc. - Overview
- Keysight Technologies Inc. - Business segments
- Keysight Technologies Inc. - Key news
- Keysight Technologies Inc. - Key offerings
- Keysight Technologies Inc. - Segment focus
- SWOT
- 16.10 KLA Corp.
- KLA Corp. - Overview
- KLA Corp. - Business segments
- KLA Corp. - Key offerings
- KLA Corp. - Segment focus
- SWOT
- 16.11 Lam Research Corp.
- Lam Research Corp. - Overview
- Lam Research Corp. - Product / Service
- Lam Research Corp. - Key offerings
- SWOT
- 16.12 Onto Innovation Inc.
- Onto Innovation Inc. - Overview
- Onto Innovation Inc. - Product / Service
- Onto Innovation Inc. - Key offerings
- SWOT
- 16.13 PDF Solutions
- PDF Solutions - Overview
- PDF Solutions - Product / Service
- PDF Solutions - Key offerings
- SWOT
- 16.14 Siemens AG
- Siemens AG - Overview
- Siemens AG - Business segments
- Siemens AG - Key news
- Siemens AG - Key offerings
- Siemens AG - Segment focus
- SWOT
- 16.15 Synopsys Inc.
- Synopsys Inc. - Overview
- Synopsys Inc. - Business segments
- Synopsys Inc. - Key news
- Synopsys Inc. - Key offerings
- Synopsys Inc. - Segment focus
- SWOT
- 16.16 The PEER Group Inc.
- The PEER Group Inc. - Overview
- The PEER Group Inc. - Product / Service
- The PEER Group Inc. - Key offerings
- SWOT
- 16.17 Thermo Fisher Scientific Inc.
- Thermo Fisher Scientific Inc. - Overview
- Thermo Fisher Scientific Inc. - Business segments
- Thermo Fisher Scientific Inc. - Key news
- Thermo Fisher Scientific Inc. - Key offerings
- Thermo Fisher Scientific Inc. - Segment focus
- SWOT
- 16.18 Zuken Inc.
- Zuken Inc. - Overview
- Zuken Inc. - Product / Service
- Zuken Inc. - Key offerings
- SWOT
17 Appendix
- 17.1 Scope of the report
- 17.2 Inclusions and exclusions checklist
- Inclusions checklist
- Exclusions checklist
- 17.3 Currency conversion rates for US$
- Currency conversion rates for US$
- 17.4 Research methodology
- Research methodology
- 17.5 Data procurement
- Information sources
- 17.6 Data validation
- Data validation
- 17.7 Validation techniques employed for market sizing
- Validation techniques employed for market sizing
- 17.8 Data synthesis
- Data synthesis
- 17.9 360 degree market analysis
- 360 degree market analysis
- 17.10 List of abbreviations
- List of abbreviations

