|
|
市場調査レポート
商品コード
1440991
自動車用リコンフィギュラブル計器クラスターの世界市場 2024-2028Global Automotive Reconfigurable Instrument Cluster Market 2024-2028 |
||||||

|
|||||||
カスタマイズ可能
|
|||||||


| 自動車用リコンフィギュラブル計器クラスターの世界市場 2024-2028 |
|
出版日: 2024年02月14日
発行: TechNavio
ページ情報: 英文 175 Pages
納期: 即納可能
|

全表示
- 概要
- 図表
- 目次
自動車用リコンフィギュラブル計器クラスター市場は2023-2028年に25億米ドル、予測期間中のCAGRは15.19%で成長すると予測されます。
当レポートでは、自動車用リコンフィギュラブル計器クラスター市場の全体的な分析、市場規模・予測、動向、成長促進要因、課題、約25のベンダーを網羅したベンダー分析などを掲載しています。
現在の市場シナリオ、最新動向と促進要因、市場環境全体に関する最新分析を提供しています。市場を牽引しているのは、車両内装の強化や没入感のある運転体験、柔軟性、統合能力、追加コストなしのカスタマイズ機能に対する需要の高まり、車両へのADAS統合への注目の高まりなどです。
| 市場範囲 | |
|---|---|
| 基準年 | 2024 |
| 終了年 | 2028 |
| 予測期間 | 2024-2028 |
| 成長モメンタム | 加速 |
| 前年比2024年 | 14.72% |
| CAGR | 15.19% |
| 増分額 | 25億米ドル |
本調査では、優れたグラフィックディスプレイの市場開拓が、今後数年間の自動車用リコンフィギュラブル計器クラスター市場成長を牽引する主要因の1つであると分析しています。また、自動車エコシステムにおけるデジタルコックピットの人気の高まりや、再構成可能な計器クラスタにおけるAR要素の統合の拡大は、市場の大きな需要につながります。
目次
第1章 エグゼクティブサマリー
- 市場概要
第2章 市場情勢
- 市場エコシステム
第3章 市場規模
- 市場の定義
- 市場セグメント分析
- 市場規模 2023
- 市場の見通し 2023-2028
第4章 市場規模実績
- 自動車用リコンフィギュラブル計器クラスターの世界市場 2018-2022
- 製品セグメント分析 2018-2022
- 用途別セグメント分析 2018-2022
- 地域別セグメント分析 2018-2022
- 国別セグメント分析 2018-2022
第5章 ファイブフォース分析
- ファイブフォースの要約
- 買い手の交渉力
- 供給企業の交渉力
- 新規参入業者の脅威
- 代替品の脅威
- 競争の脅威
- 市況
第6章 市場セグメンテーション:製品別
- 市場セグメント
- 比較:製品別
- 部分的に再構成可能な計器クラスター:市場規模と予測 2023-2028
- 完全に再構成可能な計器クラスタ:市場規模と予測 2023-2028
- 市場機会:製品別
第7章 市場セグメンテーション:用途別
- 市場セグメント
- 比較:用途別
- 乗用車:市場規模と予測 2023-2028
- 商用車:市場規模と予測 2023-2028
- 市場機会:用途別
第8章 顧客情勢
- 顧客情勢の概要
第9章 地域別情勢
- 地域別セグメンテーション
- 地域別比較
- 北米:市場規模と予測 2023-2028
- 欧州:市場規模と予測 2023-2028
- アジア太平洋:市場規模と予測 2023-2028
- 南米:市場規模と予測 2023-2028
- 中東・アフリカ:市場規模と予測 2023-2028
- 米国:市場規模と予測 2023-2028
- 中国:市場規模と予測 2023-2028
- ドイツ:市場規模と予測 2023-2028
- 英国:市場規模と予測 2023-2028
- 日本:市場規模と予測 2023-2028
- 市場機会:地域情勢別
第10章 促進要因、課題、および動向
- 市場促進要因
- 市場の課題
- 促進要因と課題の影響
- 市場動向
第11章 ベンダー情勢
- 概要
- ベンダー情勢
- 混乱の状況
- 業界のリスク
第12章 ベンダー分析
- 対象ベンダー
- ベンダーの市場ポジショニング
- BlackBerry Ltd.
- Caerbont Automotive Instruments Ltd.
- Continental AG
- DENSO Corp.
- Hyundai Motor Co.
- ID4Motion
- International Automotive Components Group SA
- Marelli Holdings Co. Ltd.
- Nippon Seiki Co. Ltd.
- NVIDIA Corp.
- NXP Semiconductors NV
- Panasonic Holdings Corp.
- Pricol Ltd.
- Renesas Electronics Corp.
- Robert Bosch GmbH
第13章 付録
Exhibits:
- Exhibits1: Executive Summary - Chart on Market Overview
- Exhibits2: Executive Summary - Data Table on Market Overview
- Exhibits3: Executive Summary - Chart on Global Market Characteristics
- Exhibits4: Executive Summary - Chart on Market By Geographical Landscape
- Exhibits5: Executive Summary - Chart on Market Segmentation by Product
- Exhibits6: Executive Summary - Chart on Market Segmentation by Application
- Exhibits7: Executive Summary - Chart on Incremental Growth
- Exhibits8: Executive Summary - Data Table on Incremental Growth
- Exhibits9: Executive Summary - Chart on Vendor Market Positioning
- Exhibits10: Parent market
- Exhibits11: Market Characteristics
- Exhibits12: Offerings of vendors included in the market definition
- Exhibits13: Market segments
- Exhibits14: Chart on Global - Market size and forecast 2023-2028 ($ billion)
- Exhibits15: Data Table on Global - Market size and forecast 2023-2028 ($ billion)
- Exhibits16: Chart on Global Market: Year-over-year growth 2023-2028 (%)
- Exhibits17: Data Table on Global Market: Year-over-year growth 2023-2028 (%)
- Exhibits18: Historic Market Size - Data Table on global automotive reconfigurable instrument cluster market 2018 - 2022 ($ billion)
- Exhibits19: Historic Market Size - Product Segment 2018 - 2022 ($ billion)
- Exhibits20: Historic Market Size - Application Segment 2018 - 2022 ($ billion)
- Exhibits21: Historic Market Size - Geography Segment 2018 - 2022 ($ billion)
- Exhibits22: Historic Market Size - Country Segment 2018 - 2022 ($ billion)
- Exhibits23: Five forces analysis - Comparison between 2023 and 2028
- Exhibits24: Chart on Bargaining power of buyers - Impact of key factors 2023 and 2028
- Exhibits25: Bargaining power of suppliers - Impact of key factors in 2023 and 2028
- Exhibits26: Threat of new entrants - Impact of key factors in 2023 and 2028
- Exhibits27: Threat of substitutes - Impact of key factors in 2023 and 2028
- Exhibits28: Threat of rivalry - Impact of key factors in 2023 and 2028
- Exhibits29: Chart on Market condition - Five forces 2023 and 2028
- Exhibits30: Chart on Product - Market share 2023-2028 (%)
- Exhibits31: Data Table on Product - Market share 2023-2028 (%)
- Exhibits32: Chart on Comparison by Product
- Exhibits33: Data Table on Comparison by Product
- Exhibits34: Chart on Partially reconfigurable instrument cluster - Market size and forecast 2023-2028 ($ billion)
- Exhibits35: Data Table on Partially reconfigurable instrument cluster - Market size and forecast 2023-2028 ($ billion)
- Exhibits36: Chart on Partially reconfigurable instrument cluster - Year-over-year growth 2023-2028 (%)
- Exhibits37: Data Table on Partially reconfigurable instrument cluster - Year-over-year growth 2023-2028 (%)
- Exhibits38: Chart on Fully reconfigurable instrument cluster - Market size and forecast 2023-2028 ($ billion)
- Exhibits39: Data Table on Fully reconfigurable instrument cluster - Market size and forecast 2023-2028 ($ billion)
- Exhibits40: Chart on Fully reconfigurable instrument cluster - Year-over-year growth 2023-2028 (%)
- Exhibits41: Data Table on Fully reconfigurable instrument cluster - Year-over-year growth 2023-2028 (%)
- Exhibits42: Market opportunity by Product ($ billion)
- Exhibits43: Data Table on Market opportunity by Product ($ billion)
- Exhibits44: Chart on Application - Market share 2023-2028 (%)
- Exhibits45: Data Table on Application - Market share 2023-2028 (%)
- Exhibits46: Chart on Comparison by Application
- Exhibits47: Data Table on Comparison by Application
- Exhibits48: Chart on Passenger cars - Market size and forecast 2023-2028 ($ billion)
- Exhibits49: Data Table on Passenger cars - Market size and forecast 2023-2028 ($ billion)
- Exhibits50: Chart on Passenger cars - Year-over-year growth 2023-2028 (%)
- Exhibits51: Data Table on Passenger cars - Year-over-year growth 2023-2028 (%)
- Exhibits52: Chart on Commercial vehicles - Market size and forecast 2023-2028 ($ billion)
- Exhibits53: Data Table on Commercial vehicles - Market size and forecast 2023-2028 ($ billion)
- Exhibits54: Chart on Commercial vehicles - Year-over-year growth 2023-2028 (%)
- Exhibits55: Data Table on Commercial vehicles - Year-over-year growth 2023-2028 (%)
- Exhibits56: Market opportunity by Application ($ billion)
- Exhibits57: Data Table on Market opportunity by Application ($ billion)
- Exhibits58: Analysis of price sensitivity, lifecycle, customer purchase basket, adoption rates, and purchase criteria
- Exhibits59: Chart on Market share By Geographical Landscape 2023-2028 (%)
- Exhibits60: Data Table on Market share By Geographical Landscape 2023-2028 (%)
- Exhibits61: Chart on Geographic comparison
- Exhibits62: Data Table on Geographic comparison
- Exhibits63: Chart on North America - Market size and forecast 2023-2028 ($ billion)
- Exhibits64: Data Table on North America - Market size and forecast 2023-2028 ($ billion)
- Exhibits65: Chart on North America - Year-over-year growth 2023-2028 (%)
- Exhibits66: Data Table on North America - Year-over-year growth 2023-2028 (%)
- Exhibits67: Chart on Europe - Market size and forecast 2023-2028 ($ billion)
- Exhibits68: Data Table on Europe - Market size and forecast 2023-2028 ($ billion)
- Exhibits69: Chart on Europe - Year-over-year growth 2023-2028 (%)
- Exhibits70: Data Table on Europe - Year-over-year growth 2023-2028 (%)
- Exhibits71: Chart on APAC - Market size and forecast 2023-2028 ($ billion)
- Exhibits72: Data Table on APAC - Market size and forecast 2023-2028 ($ billion)
- Exhibits73: Chart on APAC - Year-over-year growth 2023-2028 (%)
- Exhibits74: Data Table on APAC - Year-over-year growth 2023-2028 (%)
- Exhibits75: Chart on South America - Market size and forecast 2023-2028 ($ billion)
- Exhibits76: Data Table on South America - Market size and forecast 2023-2028 ($ billion)
- Exhibits77: Chart on South America - Year-over-year growth 2023-2028 (%)
- Exhibits78: Data Table on South America - Year-over-year growth 2023-2028 (%)
- Exhibits79: Chart on Middle East and Africa - Market size and forecast 2023-2028 ($ billion)
- Exhibits80: Data Table on Middle East and Africa - Market size and forecast 2023-2028 ($ billion)
- Exhibits81: Chart on Middle East and Africa - Year-over-year growth 2023-2028 (%)
- Exhibits82: Data Table on Middle East and Africa - Year-over-year growth 2023-2028 (%)
- Exhibits83: Chart on US - Market size and forecast 2023-2028 ($ billion)
- Exhibits84: Data Table on US - Market size and forecast 2023-2028 ($ billion)
- Exhibits85: Chart on US - Year-over-year growth 2023-2028 (%)
- Exhibits86: Data Table on US - Year-over-year growth 2023-2028 (%)
- Exhibits87: Chart on China - Market size and forecast 2023-2028 ($ billion)
- Exhibits88: Data Table on China - Market size and forecast 2023-2028 ($ billion)
- Exhibits89: Chart on China - Year-over-year growth 2023-2028 (%)
- Exhibits90: Data Table on China - Year-over-year growth 2023-2028 (%)
- Exhibits91: Chart on Germany - Market size and forecast 2023-2028 ($ billion)
- Exhibits92: Data Table on Germany - Market size and forecast 2023-2028 ($ billion)
- Exhibits93: Chart on Germany - Year-over-year growth 2023-2028 (%)
- Exhibits94: Data Table on Germany - Year-over-year growth 2023-2028 (%)
- Exhibits95: Chart on UK - Market size and forecast 2023-2028 ($ billion)
- Exhibits96: Data Table on UK - Market size and forecast 2023-2028 ($ billion)
- Exhibits97: Chart on UK - Year-over-year growth 2023-2028 (%)
- Exhibits98: Data Table on UK - Year-over-year growth 2023-2028 (%)
- Exhibits99: Chart on Japan - Market size and forecast 2023-2028 ($ billion)
- Exhibits100: Data Table on Japan - Market size and forecast 2023-2028 ($ billion)
- Exhibits101: Chart on Japan - Year-over-year growth 2023-2028 (%)
- Exhibits102: Data Table on Japan - Year-over-year growth 2023-2028 (%)
- Exhibits103: Market opportunity By Geographical Landscape ($ billion)
- Exhibits104: Data Tables on Market opportunity By Geographical Landscape ($ billion)
- Exhibits105: Impact of drivers and challenges in 2023 and 2028
- Exhibits106: Overview on Criticality of inputs and Factors of differentiation
- Exhibits107: Overview on factors of disruption
- Exhibits108: Impact of key risks on business
- Exhibits109: Vendors covered
- Exhibits110: Matrix on vendor position and classification
- Exhibits111: BlackBerry Ltd. - Overview
- Exhibits112: BlackBerry Ltd. - Business segments
- Exhibits113: BlackBerry Ltd. - Key news
- Exhibits114: BlackBerry Ltd. - Key offerings
- Exhibits115: BlackBerry Ltd. - Segment focus
- Exhibits116: Caerbont Automotive Instruments Ltd. - Overview
- Exhibits117: Caerbont Automotive Instruments Ltd. - Product / Service
- Exhibits118: Caerbont Automotive Instruments Ltd. - Key offerings
- Exhibits119: Continental AG - Overview
- Exhibits120: Continental AG - Business segments
- Exhibits121: Continental AG - Key news
- Exhibits122: Continental AG - Key offerings
- Exhibits123: Continental AG - Segment focus
- Exhibits124: DENSO Corp. - Overview
- Exhibits125: DENSO Corp. - Business segments
- Exhibits126: DENSO Corp. - Key news
- Exhibits127: DENSO Corp. - Key offerings
- Exhibits128: DENSO Corp. - Segment focus
- Exhibits129: Hyundai Motor Co. - Overview
- Exhibits130: Hyundai Motor Co. - Business segments
- Exhibits131: Hyundai Motor Co. - Key news
- Exhibits132: Hyundai Motor Co. - Key offerings
- Exhibits133: Hyundai Motor Co. - Segment focus
- Exhibits134: ID4Motion - Overview
- Exhibits135: ID4Motion - Product / Service
- Exhibits136: ID4Motion - Key offerings
- Exhibits137: International Automotive Components Group SA - Overview
- Exhibits138: International Automotive Components Group SA - Product / Service
- Exhibits139: International Automotive Components Group SA - Key news
- Exhibits140: International Automotive Components Group SA - Key offerings
- Exhibits141: Marelli Holdings Co. Ltd. - Overview
- Exhibits142: Marelli Holdings Co. Ltd. - Product / Service
- Exhibits143: Marelli Holdings Co. Ltd. - Key news
- Exhibits144: Marelli Holdings Co. Ltd. - Key offerings
- Exhibits145: Nippon Seiki Co. Ltd. - Overview
- Exhibits146: Nippon Seiki Co. Ltd. - Business segments
- Exhibits147: Nippon Seiki Co. Ltd. - Key offerings
- Exhibits148: Nippon Seiki Co. Ltd. - Segment focus
- Exhibits149: NVIDIA Corp. - Overview
- Exhibits150: NVIDIA Corp. - Business segments
- Exhibits151: NVIDIA Corp. - Key news
- Exhibits152: NVIDIA Corp. - Key offerings
- Exhibits153: NVIDIA Corp. - Segment focus
- Exhibits154: NXP Semiconductors NV - Overview
- Exhibits155: NXP Semiconductors NV - Product / Service
- Exhibits156: NXP Semiconductors NV - Key news
- Exhibits157: NXP Semiconductors NV - Key offerings
- Exhibits158: Panasonic Holdings Corp. - Overview
- Exhibits159: Panasonic Holdings Corp. - Business segments
- Exhibits160: Panasonic Holdings Corp. - Key news
- Exhibits161: Panasonic Holdings Corp. - Key offerings
- Exhibits162: Panasonic Holdings Corp. - Segment focus
- Exhibits163: Pricol Ltd. - Overview
- Exhibits164: Pricol Ltd. - Product / Service
- Exhibits165: Pricol Ltd. - Key offerings
- Exhibits166: Renesas Electronics Corp. - Overview
- Exhibits167: Renesas Electronics Corp. - Business segments
- Exhibits168: Renesas Electronics Corp. - Key news
- Exhibits169: Renesas Electronics Corp. - Key offerings
- Exhibits170: Renesas Electronics Corp. - Segment focus
- Exhibits171: Robert Bosch GmbH - Overview
- Exhibits172: Robert Bosch GmbH - Business segments
- Exhibits173: Robert Bosch GmbH - Key news
- Exhibits174: Robert Bosch GmbH - Key offerings
- Exhibits175: Robert Bosch GmbH - Segment focus
- Exhibits176: Inclusions checklist
- Exhibits177: Exclusions checklist
- Exhibits178: Currency conversion rates for US$
- Exhibits179: Research methodology
- Exhibits180: Validation techniques employed for market sizing
- Exhibits181: Information sources
- Exhibits182: List of abbreviations
The automotive reconfigurable instrument cluster market is forecasted to grow by USD 2.50 bn during 2023-2028, accelerating at a CAGR of 15.19% during the forecast period. The report on the automotive reconfigurable instrument cluster market provides a holistic analysis, market size and forecast, trends, growth drivers, and challenges, as well as vendor analysis covering around 25 vendors.
The report offers an up-to-date analysis regarding the current market scenario, the latest trends and drivers, and the overall market environment. The market is driven by growing demand for enhanced vehicle interiors and immersive driving experience, flexibility, integration ability, and customization features at no additional cost, and increasing focus on integration of adas in vehicles.
| Market Scope | |
|---|---|
| Base Year | 2024 |
| End Year | 2028 |
| Series Year | 2024-2028 |
| Growth Momentum | Accelerate |
| YOY 2024 | 14.72% |
| CAGR | 15.19% |
| Incremental Value | $2.50bn |
Technavio's automotive reconfigurable instrument cluster market is segmented as below:
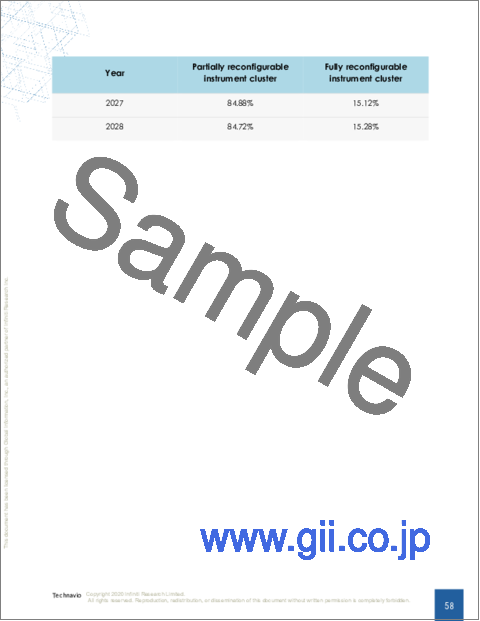
By Product
- Partially reconfigurable instrument cluster
- Fully reconfigurable instrument cluster
By Application
- Passenger cars
- Commercial vehicles
By Geographical Landscape
- North America
- Europe
- APAC
- South America
- Middle East and Africa
This study identifies the development of superior graphic displays as one of the prime reasons driving the automotive reconfigurable instrument cluster market growth during the next few years. Also, growing popularity of digital cockpits in automotive ecosystems and growing integration of AR elements in reconfigurable instrument clusters will lead to sizable demand in the market.
The report on the automotive reconfigurable instrument cluster market covers the following areas:
- Automotive reconfigurable instrument cluster market sizing
- Automotive reconfigurable instrument cluster market forecast
- Automotive reconfigurable instrument cluster market industry analysis
The robust vendor analysis is designed to help clients improve their market position, and in line with this, this report provides a detailed analysis of several leading automotive reconfigurable instrument cluster market vendors that include BlackBerry Ltd., Caerbont Automotive Instruments Ltd., Continental AG, DENSO Corp., Hyundai Motor Co., ID4Motion, International Automotive Components Group SA, Marelli Holdings Co. Ltd., Nippon Seiki Co. Ltd., NVIDIA Corp., NXP Semiconductors NV, Panasonic Holdings Corp., Pricol Ltd., Renesas Electronics Corp., Robert Bosch GmbH, Stoneridge Inc., Texas Instruments Inc., Toshiba Corp., Visteon Corp., and Yazaki Corp.. Also, the automotive reconfigurable instrument cluster market analysis report includes information on upcoming trends and challenges that will influence market growth. This is to help companies strategize and leverage all forthcoming growth opportunities.
The study was conducted using an objective combination of primary and secondary information including inputs from key participants in the industry. The report contains a comprehensive market and vendor landscape in addition to an analysis of the key vendors.
The publisher presents a detailed picture of the market by the way of study, synthesis, and summation of data from multiple sources by an analysis of key parameters such as profit, pricing, competition, and promotions. It presents various market facets by identifying the key industry influencers. The data presented is comprehensive, reliable, and a result of extensive research - both primary and secondary. The market research reports provide a complete competitive landscape and an in-depth vendor selection methodology and analysis using qualitative and quantitative research to forecast the accurate market growth.
Table of Contents
1 Executive Summary
- 1.1 Market overview
- Exhibit 01: Executive Summary - Chart on Market Overview
- Exhibit 02: Executive Summary - Data Table on Market Overview
- Exhibit 03: Executive Summary - Chart on Global Market Characteristics
- Exhibit 04: Executive Summary - Chart on Market By Geographical Landscape
- Exhibit 05: Executive Summary - Chart on Market Segmentation by Product
- Exhibit 06: Executive Summary - Chart on Market Segmentation by Application
- Exhibit 07: Executive Summary - Chart on Incremental Growth
- Exhibit 08: Executive Summary - Data Table on Incremental Growth
- Exhibit 09: Executive Summary - Chart on Vendor Market Positioning
2 Market Landscape
- 2.1 Market ecosystem
- Exhibit 10: Parent market
- Exhibit 11: Market Characteristics
3 Market Sizing
- 3.1 Market definition
- Exhibit 12: Offerings of vendors included in the market definition
- 3.2 Market segment analysis
- Exhibit 13: Market segments
- 3.3 Market size 2023
- 3.4 Market outlook: Forecast for 2023-2028
- Exhibit 14: Chart on Global - Market size and forecast 2023-2028 ($ billion)
- Exhibit 15: Data Table on Global - Market size and forecast 2023-2028 ($ billion)
- Exhibit 16: Chart on Global Market: Year-over-year growth 2023-2028 (%)
- Exhibit 17: Data Table on Global Market: Year-over-year growth 2023-2028 (%)
4 Historic Market Size
- 4.1 Global automotive reconfigurable instrument cluster market 2018 - 2022
- Exhibit 18: Historic Market Size - Data Table on global automotive reconfigurable instrument cluster market 2018 - 2022 ($ billion)
- 4.2 Product Segment Analysis 2018 - 2022
- Exhibit 19: Historic Market Size - Product Segment 2018 - 2022 ($ billion)
- 4.3 Application Segment Analysis 2018 - 2022
- Exhibit 20: Historic Market Size - Application Segment 2018 - 2022 ($ billion)
- 4.4 Geography Segment Analysis 2018 - 2022
- Exhibit 21: Historic Market Size - Geography Segment 2018 - 2022 ($ billion)
- 4.5 Country Segment Analysis 2018 - 2022
- Exhibit 22: Historic Market Size - Country Segment 2018 - 2022 ($ billion)
5 Five Forces Analysis
- 5.1 Five forces summary
- Exhibit 23: Five forces analysis - Comparison between 2023 and 2028
- 5.2 Bargaining power of buyers
- Exhibit 24: Chart on Bargaining power of buyers - Impact of key factors 2023 and 2028
- 5.3 Bargaining power of suppliers
- Exhibit 25: Bargaining power of suppliers - Impact of key factors in 2023 and 2028
- 5.4 Threat of new entrants
- Exhibit 26: Threat of new entrants - Impact of key factors in 2023 and 2028
- 5.5 Threat of substitutes
- Exhibit 27: Threat of substitutes - Impact of key factors in 2023 and 2028
- 5.6 Threat of rivalry
- Exhibit 28: Threat of rivalry - Impact of key factors in 2023 and 2028
- 5.7 Market condition
- Exhibit 29: Chart on Market condition - Five forces 2023 and 2028
6 Market Segmentation by Product
- 6.1 Market segments
- Exhibit 30: Chart on Product - Market share 2023-2028 (%)
- Exhibit 31: Data Table on Product - Market share 2023-2028 (%)
- 6.2 Comparison by Product
- Exhibit 32: Chart on Comparison by Product
- Exhibit 33: Data Table on Comparison by Product
- 6.3 Partially reconfigurable instrument cluster - Market size and forecast 2023-2028
- Exhibit 34: Chart on Partially reconfigurable instrument cluster - Market size and forecast 2023-2028 ($ billion)
- Exhibit 35: Data Table on Partially reconfigurable instrument cluster - Market size and forecast 2023-2028 ($ billion)
- Exhibit 36: Chart on Partially reconfigurable instrument cluster - Year-over-year growth 2023-2028 (%)
- Exhibit 37: Data Table on Partially reconfigurable instrument cluster - Year-over-year growth 2023-2028 (%)
- 6.4 Fully reconfigurable instrument cluster - Market size and forecast 2023-2028
- Exhibit 38: Chart on Fully reconfigurable instrument cluster - Market size and forecast 2023-2028 ($ billion)
- Exhibit 39: Data Table on Fully reconfigurable instrument cluster - Market size and forecast 2023-2028 ($ billion)
- Exhibit 40: Chart on Fully reconfigurable instrument cluster - Year-over-year growth 2023-2028 (%)
- Exhibit 41: Data Table on Fully reconfigurable instrument cluster - Year-over-year growth 2023-2028 (%)
- 6.5 Market opportunity by Product
- Exhibit 42: Market opportunity by Product ($ billion)
- Exhibit 43: Data Table on Market opportunity by Product ($ billion)
7 Market Segmentation by Application
- 7.1 Market segments
- Exhibit 44: Chart on Application - Market share 2023-2028 (%)
- Exhibit 45: Data Table on Application - Market share 2023-2028 (%)
- 7.2 Comparison by Application
- Exhibit 46: Chart on Comparison by Application
- Exhibit 47: Data Table on Comparison by Application
- 7.3 Passenger cars - Market size and forecast 2023-2028
- Exhibit 48: Chart on Passenger cars - Market size and forecast 2023-2028 ($ billion)
- Exhibit 49: Data Table on Passenger cars - Market size and forecast 2023-2028 ($ billion)
- Exhibit 50: Chart on Passenger cars - Year-over-year growth 2023-2028 (%)
- Exhibit 51: Data Table on Passenger cars - Year-over-year growth 2023-2028 (%)
- 7.4 Commercial vehicles - Market size and forecast 2023-2028
- Exhibit 52: Chart on Commercial vehicles - Market size and forecast 2023-2028 ($ billion)
- Exhibit 53: Data Table on Commercial vehicles - Market size and forecast 2023-2028 ($ billion)
- Exhibit 54: Chart on Commercial vehicles - Year-over-year growth 2023-2028 (%)
- Exhibit 55: Data Table on Commercial vehicles - Year-over-year growth 2023-2028 (%)
- 7.5 Market opportunity by Application
- Exhibit 56: Market opportunity by Application ($ billion)
- Exhibit 57: Data Table on Market opportunity by Application ($ billion)
8 Customer Landscape
- 8.1 Customer landscape overview
- Exhibit 58: Analysis of price sensitivity, lifecycle, customer purchase basket, adoption rates, and purchase criteria
9 Geographic Landscape
- 9.1 Geographic segmentation
- Exhibit 59: Chart on Market share By Geographical Landscape 2023-2028 (%)
- Exhibit 60: Data Table on Market share By Geographical Landscape 2023-2028 (%)
- 9.2 Geographic comparison
- Exhibit 61: Chart on Geographic comparison
- Exhibit 62: Data Table on Geographic comparison
- 9.3 North America - Market size and forecast 2023-2028
- Exhibit 63: Chart on North America - Market size and forecast 2023-2028 ($ billion)
- Exhibit 64: Data Table on North America - Market size and forecast 2023-2028 ($ billion)
- Exhibit 65: Chart on North America - Year-over-year growth 2023-2028 (%)
- Exhibit 66: Data Table on North America - Year-over-year growth 2023-2028 (%)
- 9.4 Europe - Market size and forecast 2023-2028
- Exhibit 67: Chart on Europe - Market size and forecast 2023-2028 ($ billion)
- Exhibit 68: Data Table on Europe - Market size and forecast 2023-2028 ($ billion)
- Exhibit 69: Chart on Europe - Year-over-year growth 2023-2028 (%)
- Exhibit 70: Data Table on Europe - Year-over-year growth 2023-2028 (%)
- 9.5 APAC - Market size and forecast 2023-2028
- Exhibit 71: Chart on APAC - Market size and forecast 2023-2028 ($ billion)
- Exhibit 72: Data Table on APAC - Market size and forecast 2023-2028 ($ billion)
- Exhibit 73: Chart on APAC - Year-over-year growth 2023-2028 (%)
- Exhibit 74: Data Table on APAC - Year-over-year growth 2023-2028 (%)
- 9.6 South America - Market size and forecast 2023-2028
- Exhibit 75: Chart on South America - Market size and forecast 2023-2028 ($ billion)
- Exhibit 76: Data Table on South America - Market size and forecast 2023-2028 ($ billion)
- Exhibit 77: Chart on South America - Year-over-year growth 2023-2028 (%)
- Exhibit 78: Data Table on South America - Year-over-year growth 2023-2028 (%)
- 9.7 Middle East and Africa - Market size and forecast 2023-2028
- Exhibit 79: Chart on Middle East and Africa - Market size and forecast 2023-2028 ($ billion)
- Exhibit 80: Data Table on Middle East and Africa - Market size and forecast 2023-2028 ($ billion)
- Exhibit 81: Chart on Middle East and Africa - Year-over-year growth 2023-2028 (%)
- Exhibit 82: Data Table on Middle East and Africa - Year-over-year growth 2023-2028 (%)
- 9.8 US - Market size and forecast 2023-2028
- Exhibit 83: Chart on US - Market size and forecast 2023-2028 ($ billion)
- Exhibit 84: Data Table on US - Market size and forecast 2023-2028 ($ billion)
- Exhibit 85: Chart on US - Year-over-year growth 2023-2028 (%)
- Exhibit 86: Data Table on US - Year-over-year growth 2023-2028 (%)
- 9.9 China - Market size and forecast 2023-2028
- Exhibit 87: Chart on China - Market size and forecast 2023-2028 ($ billion)
- Exhibit 88: Data Table on China - Market size and forecast 2023-2028 ($ billion)
- Exhibit 89: Chart on China - Year-over-year growth 2023-2028 (%)
- Exhibit 90: Data Table on China - Year-over-year growth 2023-2028 (%)
- 9.10 Germany - Market size and forecast 2023-2028
- Exhibit 91: Chart on Germany - Market size and forecast 2023-2028 ($ billion)
- Exhibit 92: Data Table on Germany - Market size and forecast 2023-2028 ($ billion)
- Exhibit 93: Chart on Germany - Year-over-year growth 2023-2028 (%)
- Exhibit 94: Data Table on Germany - Year-over-year growth 2023-2028 (%)
- 9.11 UK - Market size and forecast 2023-2028
- Exhibit 95: Chart on UK - Market size and forecast 2023-2028 ($ billion)
- Exhibit 96: Data Table on UK - Market size and forecast 2023-2028 ($ billion)
- Exhibit 97: Chart on UK - Year-over-year growth 2023-2028 (%)
- Exhibit 98: Data Table on UK - Year-over-year growth 2023-2028 (%)
- 9.12 Japan - Market size and forecast 2023-2028
- Exhibit 99: Chart on Japan - Market size and forecast 2023-2028 ($ billion)
- Exhibit 100: Data Table on Japan - Market size and forecast 2023-2028 ($ billion)
- Exhibit 101: Chart on Japan - Year-over-year growth 2023-2028 (%)
- Exhibit 102: Data Table on Japan - Year-over-year growth 2023-2028 (%)
- 9.13 Market opportunity By Geographical Landscape
- Exhibit 103: Market opportunity By Geographical Landscape ($ billion)
- Exhibit 104: Data Tables on Market opportunity By Geographical Landscape ($ billion)
10 Drivers, Challenges, and Trends
- 10.1 Market drivers
- 10.2 Market challenges
- 10.3 Impact of drivers and challenges
- Exhibit 105: Impact of drivers and challenges in 2023 and 2028
- 10.4 Market trends
11 Vendor Landscape
- 11.1 Overview
- 11.2 Vendor landscape
- Exhibit 106: Overview on Criticality of inputs and Factors of differentiation
- 11.3 Landscape disruption
- Exhibit 107: Overview on factors of disruption
- 11.4 Industry risks
- Exhibit 108: Impact of key risks on business
12 Vendor Analysis
- 12.1 Vendors covered
- Exhibit 109: Vendors covered
- 12.2 Market positioning of vendors
- Exhibit 110: Matrix on vendor position and classification
- 12.3 BlackBerry Ltd.
- Exhibit 111: BlackBerry Ltd. - Overview
- Exhibit 112: BlackBerry Ltd. - Business segments
- Exhibit 113: BlackBerry Ltd. - Key news
- Exhibit 114: BlackBerry Ltd. - Key offerings
- Exhibit 115: BlackBerry Ltd. - Segment focus
- 12.4 Caerbont Automotive Instruments Ltd.
- Exhibit 116: Caerbont Automotive Instruments Ltd. - Overview
- Exhibit 117: Caerbont Automotive Instruments Ltd. - Product / Service
- Exhibit 118: Caerbont Automotive Instruments Ltd. - Key offerings
- 12.5 Continental AG
- Exhibit 119: Continental AG - Overview
- Exhibit 120: Continental AG - Business segments
- Exhibit 121: Continental AG - Key news
- Exhibit 122: Continental AG - Key offerings
- Exhibit 123: Continental AG - Segment focus
- 12.6 DENSO Corp.
- Exhibit 124: DENSO Corp. - Overview
- Exhibit 125: DENSO Corp. - Business segments
- Exhibit 126: DENSO Corp. - Key news
- Exhibit 127: DENSO Corp. - Key offerings
- Exhibit 128: DENSO Corp. - Segment focus
- 12.7 Hyundai Motor Co.
- Exhibit 129: Hyundai Motor Co. - Overview
- Exhibit 130: Hyundai Motor Co. - Business segments
- Exhibit 131: Hyundai Motor Co. - Key news
- Exhibit 132: Hyundai Motor Co. - Key offerings
- Exhibit 133: Hyundai Motor Co. - Segment focus
- 12.8 ID4Motion
- Exhibit 134: ID4Motion - Overview
- Exhibit 135: ID4Motion - Product / Service
- Exhibit 136: ID4Motion - Key offerings
- 12.9 International Automotive Components Group SA
- Exhibit 137: International Automotive Components Group SA - Overview
- Exhibit 138: International Automotive Components Group SA - Product / Service
- Exhibit 139: International Automotive Components Group SA - Key news
- Exhibit 140: International Automotive Components Group SA - Key offerings
- 12.10 Marelli Holdings Co. Ltd.
- Exhibit 141: Marelli Holdings Co. Ltd. - Overview
- Exhibit 142: Marelli Holdings Co. Ltd. - Product / Service
- Exhibit 143: Marelli Holdings Co. Ltd. - Key news
- Exhibit 144: Marelli Holdings Co. Ltd. - Key offerings
- 12.11 Nippon Seiki Co. Ltd.
- Exhibit 145: Nippon Seiki Co. Ltd. - Overview
- Exhibit 146: Nippon Seiki Co. Ltd. - Business segments
- Exhibit 147: Nippon Seiki Co. Ltd. - Key offerings
- Exhibit 148: Nippon Seiki Co. Ltd. - Segment focus
- 12.12 NVIDIA Corp.
- Exhibit 149: NVIDIA Corp. - Overview
- Exhibit 150: NVIDIA Corp. - Business segments
- Exhibit 151: NVIDIA Corp. - Key news
- Exhibit 152: NVIDIA Corp. - Key offerings
- Exhibit 153: NVIDIA Corp. - Segment focus
- 12.13 NXP Semiconductors NV
- Exhibit 154: NXP Semiconductors NV - Overview
- Exhibit 155: NXP Semiconductors NV - Product / Service
- Exhibit 156: NXP Semiconductors NV - Key news
- Exhibit 157: NXP Semiconductors NV - Key offerings
- 12.14 Panasonic Holdings Corp.
- Exhibit 158: Panasonic Holdings Corp. - Overview
- Exhibit 159: Panasonic Holdings Corp. - Business segments
- Exhibit 160: Panasonic Holdings Corp. - Key news
- Exhibit 161: Panasonic Holdings Corp. - Key offerings
- Exhibit 162: Panasonic Holdings Corp. - Segment focus
- 12.15 Pricol Ltd.
- Exhibit 163: Pricol Ltd. - Overview
- Exhibit 164: Pricol Ltd. - Product / Service
- Exhibit 165: Pricol Ltd. - Key offerings
- 12.16 Renesas Electronics Corp.
- Exhibit 166: Renesas Electronics Corp. - Overview
- Exhibit 167: Renesas Electronics Corp. - Business segments
- Exhibit 168: Renesas Electronics Corp. - Key news
- Exhibit 169: Renesas Electronics Corp. - Key offerings
- Exhibit 170: Renesas Electronics Corp. - Segment focus
- 12.17 Robert Bosch GmbH
- Exhibit 171: Robert Bosch GmbH - Overview
- Exhibit 172: Robert Bosch GmbH - Business segments
- Exhibit 173: Robert Bosch GmbH - Key news
- Exhibit 174: Robert Bosch GmbH - Key offerings
- Exhibit 175: Robert Bosch GmbH - Segment focus
13 Appendix
- 13.1 Scope of the report
- 13.2 Inclusions and exclusions checklist
- Exhibit 176: Inclusions checklist
- Exhibit 177: Exclusions checklist
- 13.3 Currency conversion rates for US$
- Exhibit 178: Currency conversion rates for US$
- 13.4 Research methodology
- Exhibit 179: Research methodology
- Exhibit 180: Validation techniques employed for market sizing
- Exhibit 181: Information sources
- 13.5 List of abbreviations
- Exhibit 182: List of abbreviations

