|
|
市場調査レポート
商品コード
1516238
卵加工機器の世界市場 2024-2028Global egg processing equipment market 2024-2028 |
||||||
|
|||||||
カスタマイズ可能
|
|||||||

| 卵加工機器の世界市場 2024-2028 |
|
出版日: 2024年06月12日
発行: TechNavio
ページ情報: 英文 171 Pages
納期: 即納可能
|

全表示
- 概要
- 図表
- 目次
卵加工機器市場は2023-2028年に6,010万米ドル、予測期間中のCAGRは2.09%で成長すると予測されています。
当レポートでは、卵加工機器市場の全体的な分析、市場規模・予測、動向、成長促進要因、課題、約25のベンダーを網羅したベンダー分析などを掲載しています。
現在の市場シナリオ、最新動向と促進要因、市場環境全体に関する最新分析を提供しています。市場は、汚染リスクの低減、様々な産業における卵製品の幅広い用途、卵生産の増加を促進する政府の支援によって牽引されています。
| 市場範囲 | |
|---|---|
| 基準年 | 2024 |
| 終了年 | 2028 |
| 予測期間 | 2024-2028 |
| 成長モメンタム | 加速 |
| 前年比2024年 | 2.03% |
| CAGR | 2.09% |
| 増分額 | 6,010万米ドル |
本調査では、今後数年間の卵加工機器市場の成長を促進する主な要因の1つとして、生産効率の向上と生産時間の短縮をもたらす革新的技術の流入を挙げています。また、栄養補助食品やヘルスケア製品への加工卵の応用や、卵加工へのHPP技術の採用増加は、市場の大きな需要につながります。
目次
第1章 エグゼクティブサマリー
- 市場概要
第2章 市場情勢
- 市場エコシステム
- 市場の特徴
- バリューチェーン分析
第3章 市場規模の評価
- 市場の定義
- 市場セグメント分析
- 市場規模 2023
- 市場の見通し 2023-2028
第4章 市場規模実績
- 世界卵加工機器市場 2018-2022
- 製品別セグメント分析 2018-2022
- タイプ別セグメント分析 2018-2022
- 地域別セグメント分析 2018-2022
- 国別セグメント分析 2018-2022
第5章 ファイブフォース分析
- ファイブフォースの要約
- 買い手の交渉力
- 供給企業の交渉力
- 新規参入業者の脅威
- 代替品の脅威
- 競争の脅威
- 市況
第6章 市場セグメンテーション:製品別
- 市場セグメンテーション
- 比較:製品別
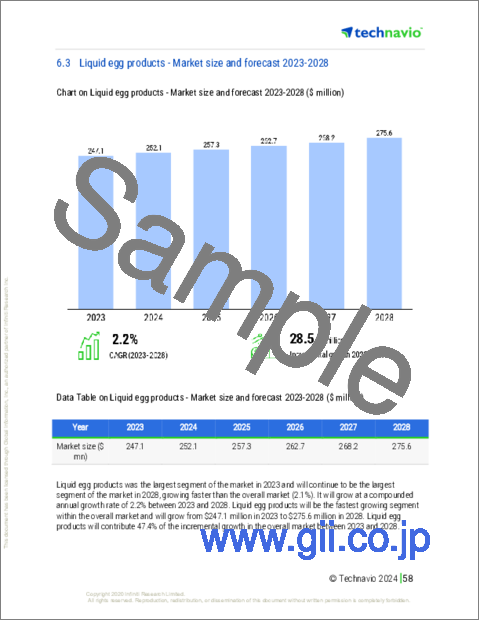
- 液状卵製品:市場規模と予測 2023-2028
- 乾燥卵製品:市場規模と予測 2023-2028
- 冷凍卵製品:市場規模と予測 2023-2028
- 市場機会:製品別
第7章 市場セグメンテーション:タイプ別
- 市場セグメンテーション
- 比較:タイプ別
- 低温殺菌装置:市場規模と予測 2023-2028
- ホモジナイザー:市場規模と予測 2023-2028
- 卵割り機と分離機:市場規模と予測 2023-2028
- 乾燥機:市場規模と予測 2023-2028
- その他:市場規模と予測 2023-2028
- 市場機会:タイプ別
第8章 顧客情勢
- 顧客情勢の概要
第9章 地域別情勢
- 地域別セグメンテーション
- 地域別比較
- 北米:市場規模と予測 2023-2028
- 欧州:市場規模と予測 2023-2028
- アジア太平洋:市場規模と予測 2023-2028
- 南米:市場規模と予測 2023-2028
- 中東・アフリカ:市場規模と予測 2023-2028
- 米国:市場規模と予測 2023-2028
- 中国:市場規模と予測 2023-2028
- フランス:市場規模と予測 2023-2028
- カナダ:市場規模と予測 2023-2028
- 日本:市場規模と予測 2023-2028
- 市場機会:地域情勢別
第10章 促進要因・課題・機会・抑制要因
- 市場促進要因
- 市場の課題
- 促進要因と課題の影響
- 市場の機会・抑制要因
第11章 競合情勢
- 概要
- 競合情勢
- 混乱の状況
- 業界のリスク
第12章 競合分析
- 企業プロファイル
- 企業の市場ポジショニング
- ACTINI SAS
- Big Dutchman AG
- Dion Ltd.
- Egg Machine
- Khalid Majeed Group of Co.
- Midwest BRD Inc.
- Moba Group B.V.
- OVO TECH Sp. z o.o.
- Ovobel Foods Ltd.
- OVOCONCEPT
- Sanovo Technology Group
- SPX FLOW Inc.
- SSP Pvt. Ltd.
- Van Beek Group BV
- Zenyer Egg Machinery Co. Ltd.
第13章 付録
Exhibits:
- Exhibits1: Executive Summary - Chart on Market Overview
- Exhibits2: Executive Summary - Data Table on Market Overview
- Exhibits3: Executive Summary - Chart on Global Market Characteristics
- Exhibits4: Executive Summary - Chart on Market By Geographical Landscape
- Exhibits5: Executive Summary - Chart on Market Segmentation by Product
- Exhibits6: Executive Summary - Chart on Market Segmentation by Type
- Exhibits7: Executive Summary - Chart on Incremental Growth
- Exhibits8: Executive Summary - Data Table on Incremental Growth
- Exhibits9: Executive Summary - Chart on Company Market Positioning
- Exhibits10: Parent Market
- Exhibits11: Data Table on - Parent Market
- Exhibits12: Market characteristics analysis
- Exhibits13: Value Chain Analysis
- Exhibits14: Offerings of companies included in the market definition
- Exhibits15: Market segments
- Exhibits16: Chart on Global - Market size and forecast 2023-2028 ($ million)
- Exhibits17: Data Table on Global - Market size and forecast 2023-2028 ($ million)
- Exhibits18: Chart on Global Market: Year-over-year growth 2023-2028 (%)
- Exhibits19: Data Table on Global Market: Year-over-year growth 2023-2028 (%)
- Exhibits20: Historic Market Size - Data Table on Global Egg Processing Equipment Market 2018 - 2022 ($ million)
- Exhibits21: Historic Market Size - Product Segment 2018 - 2022 ($ million)
- Exhibits22: Historic Market Size - Type Segment 2018 - 2022 ($ million)
- Exhibits23: Historic Market Size - Geography Segment 2018 - 2022 ($ million)
- Exhibits24: Historic Market Size - Country Segment 2018 - 2022 ($ million)
- Exhibits25: Five forces analysis - Comparison between 2023 and 2028
- Exhibits26: Bargaining power of buyers - Impact of key factors 2023 and 2028
- Exhibits27: Bargaining power of suppliers - Impact of key factors in 2023 and 2028
- Exhibits28: Threat of new entrants - Impact of key factors in 2023 and 2028
- Exhibits29: Threat of substitutes - Impact of key factors in 2023 and 2028
- Exhibits30: Threat of rivalry - Impact of key factors in 2023 and 2028
- Exhibits31: Chart on Market condition - Five forces 2023 and 2028
- Exhibits32: Chart on Product - Market share 2023-2028 (%)
- Exhibits33: Data Table on Product - Market share 2023-2028 (%)
- Exhibits34: Chart on Comparison by Product
- Exhibits35: Data Table on Comparison by Product
- Exhibits36: Chart on Liquid egg products - Market size and forecast 2023-2028 ($ million)
- Exhibits37: Data Table on Liquid egg products - Market size and forecast 2023-2028 ($ million)
- Exhibits38: Chart on Liquid egg products - Year-over-year growth 2023-2028 (%)
- Exhibits39: Data Table on Liquid egg products - Year-over-year growth 2023-2028 (%)
- Exhibits40: Chart on Dried egg products - Market size and forecast 2023-2028 ($ million)
- Exhibits41: Data Table on Dried egg products - Market size and forecast 2023-2028 ($ million)
- Exhibits42: Chart on Dried egg products - Year-over-year growth 2023-2028 (%)
- Exhibits43: Data Table on Dried egg products - Year-over-year growth 2023-2028 (%)
- Exhibits44: Chart on Frozen egg products - Market size and forecast 2023-2028 ($ million)
- Exhibits45: Data Table on Frozen egg products - Market size and forecast 2023-2028 ($ million)
- Exhibits46: Chart on Frozen egg products - Year-over-year growth 2023-2028 (%)
- Exhibits47: Data Table on Frozen egg products - Year-over-year growth 2023-2028 (%)
- Exhibits48: Market opportunity by Product ($ million)
- Exhibits49: Data Table on Market opportunity by Product ($ million)
- Exhibits50: Chart on Type - Market share 2023-2028 (%)
- Exhibits51: Data Table on Type - Market share 2023-2028 (%)
- Exhibits52: Chart on Comparison by Type
- Exhibits53: Data Table on Comparison by Type
- Exhibits54: Chart on Pasteurizers - Market size and forecast 2023-2028 ($ million)
- Exhibits55: Data Table on Pasteurizers - Market size and forecast 2023-2028 ($ million)
- Exhibits56: Chart on Pasteurizers - Year-over-year growth 2023-2028 (%)
- Exhibits57: Data Table on Pasteurizers - Year-over-year growth 2023-2028 (%)
- Exhibits58: Chart on Homogenizers - Market size and forecast 2023-2028 ($ million)
- Exhibits59: Data Table on Homogenizers - Market size and forecast 2023-2028 ($ million)
- Exhibits60: Chart on Homogenizers - Year-over-year growth 2023-2028 (%)
- Exhibits61: Data Table on Homogenizers - Year-over-year growth 2023-2028 (%)
- Exhibits62: Chart on Egg breakers and separators - Market size and forecast 2023-2028 ($ million)
- Exhibits63: Data Table on Egg breakers and separators - Market size and forecast 2023-2028 ($ million)
- Exhibits64: Chart on Egg breakers and separators - Year-over-year growth 2023-2028 (%)
- Exhibits65: Data Table on Egg breakers and separators - Year-over-year growth 2023-2028 (%)
- Exhibits66: Chart on Dryers - Market size and forecast 2023-2028 ($ million)
- Exhibits67: Data Table on Dryers - Market size and forecast 2023-2028 ($ million)
- Exhibits68: Chart on Dryers - Year-over-year growth 2023-2028 (%)
- Exhibits69: Data Table on Dryers - Year-over-year growth 2023-2028 (%)
- Exhibits70: Chart on Others - Market size and forecast 2023-2028 ($ million)
- Exhibits71: Data Table on Others - Market size and forecast 2023-2028 ($ million)
- Exhibits72: Chart on Others - Year-over-year growth 2023-2028 (%)
- Exhibits73: Data Table on Others - Year-over-year growth 2023-2028 (%)
- Exhibits74: Market opportunity by Type ($ million)
- Exhibits75: Data Table on Market opportunity by Type ($ million)
- Exhibits76: Analysis of price sensitivity, lifecycle, customer purchase basket, adoption rates, and purchase criteria
- Exhibits77: Chart on Market share By Geographical Landscape 2023-2028 (%)
- Exhibits78: Data Table on Market share By Geographical Landscape 2023-2028 (%)
- Exhibits79: Chart on Geographic comparison
- Exhibits80: Data Table on Geographic comparison
- Exhibits81: Chart on North America - Market size and forecast 2023-2028 ($ million)
- Exhibits82: Data Table on North America - Market size and forecast 2023-2028 ($ million)
- Exhibits83: Chart on North America - Year-over-year growth 2023-2028 (%)
- Exhibits84: Data Table on North America - Year-over-year growth 2023-2028 (%)
- Exhibits85: Chart on Europe - Market size and forecast 2023-2028 ($ million)
- Exhibits86: Data Table on Europe - Market size and forecast 2023-2028 ($ million)
- Exhibits87: Chart on Europe - Year-over-year growth 2023-2028 (%)
- Exhibits88: Data Table on Europe - Year-over-year growth 2023-2028 (%)
- Exhibits89: Chart on APAC - Market size and forecast 2023-2028 ($ million)
- Exhibits90: Data Table on APAC - Market size and forecast 2023-2028 ($ million)
- Exhibits91: Chart on APAC - Year-over-year growth 2023-2028 (%)
- Exhibits92: Data Table on APAC - Year-over-year growth 2023-2028 (%)
- Exhibits93: Chart on South America - Market size and forecast 2023-2028 ($ million)
- Exhibits94: Data Table on South America - Market size and forecast 2023-2028 ($ million)
- Exhibits95: Chart on South America - Year-over-year growth 2023-2028 (%)
- Exhibits96: Data Table on South America - Year-over-year growth 2023-2028 (%)
- Exhibits97: Chart on Middle East and Africa - Market size and forecast 2023-2028 ($ million)
- Exhibits98: Data Table on Middle East and Africa - Market size and forecast 2023-2028 ($ million)
- Exhibits99: Chart on Middle East and Africa - Year-over-year growth 2023-2028 (%)
- Exhibits100: Data Table on Middle East and Africa - Year-over-year growth 2023-2028 (%)
- Exhibits101: Chart on US - Market size and forecast 2023-2028 ($ million)
- Exhibits102: Data Table on US - Market size and forecast 2023-2028 ($ million)
- Exhibits103: Chart on US - Year-over-year growth 2023-2028 (%)
- Exhibits104: Data Table on US - Year-over-year growth 2023-2028 (%)
- Exhibits105: Chart on China - Market size and forecast 2023-2028 ($ million)
- Exhibits106: Data Table on China - Market size and forecast 2023-2028 ($ million)
- Exhibits107: Chart on China - Year-over-year growth 2023-2028 (%)
- Exhibits108: Data Table on China - Year-over-year growth 2023-2028 (%)
- Exhibits109: Chart on France - Market size and forecast 2023-2028 ($ million)
- Exhibits110: Data Table on France - Market size and forecast 2023-2028 ($ million)
- Exhibits111: Chart on France - Year-over-year growth 2023-2028 (%)
- Exhibits112: Data Table on France - Year-over-year growth 2023-2028 (%)
- Exhibits113: Chart on Canada - Market size and forecast 2023-2028 ($ million)
- Exhibits114: Data Table on Canada - Market size and forecast 2023-2028 ($ million)
- Exhibits115: Chart on Canada - Year-over-year growth 2023-2028 (%)
- Exhibits116: Data Table on Canada - Year-over-year growth 2023-2028 (%)
- Exhibits117: Chart on Japan - Market size and forecast 2023-2028 ($ million)
- Exhibits118: Data Table on Japan - Market size and forecast 2023-2028 ($ million)
- Exhibits119: Chart on Japan - Year-over-year growth 2023-2028 (%)
- Exhibits120: Data Table on Japan - Year-over-year growth 2023-2028 (%)
- Exhibits121: Market opportunity By Geographical Landscape ($ million)
- Exhibits122: Data Tables on Market opportunity By Geographical Landscape ($ million)
- Exhibits123: Impact of drivers and challenges in 2023 and 2028
- Exhibits124: Overview on criticality of inputs and factors of differentiation
- Exhibits125: Overview on factors of disruption
- Exhibits126: Impact of key risks on business
- Exhibits127: Companies covered
- Exhibits128: Matrix on companies position and classification
- Exhibits129: ACTINI SAS - Overview
- Exhibits130: ACTINI SAS - Product / Service
- Exhibits131: ACTINI SAS - Key offerings
- Exhibits132: Big Dutchman AG - Overview
- Exhibits133: Big Dutchman AG - Product / Service
- Exhibits134: Big Dutchman AG - Key offerings
- Exhibits135: Dion Ltd. - Overview
- Exhibits136: Dion Ltd. - Product / Service
- Exhibits137: Dion Ltd. - Key offerings
- Exhibits138: Egg Machine - Overview
- Exhibits139: Egg Machine - Product / Service
- Exhibits140: Egg Machine - Key offerings
- Exhibits141: Khalid Majeed Group of Co. - Overview
- Exhibits142: Khalid Majeed Group of Co. - Product / Service
- Exhibits143: Khalid Majeed Group of Co. - Key offerings
- Exhibits144: Midwest BRD Inc. - Overview
- Exhibits145: Midwest BRD Inc. - Product / Service
- Exhibits146: Midwest BRD Inc. - Key offerings
- Exhibits147: Moba Group B.V. - Overview
- Exhibits148: Moba Group B.V. - Product / Service
- Exhibits149: Moba Group B.V. - Key offerings
- Exhibits150: OVO TECH Sp. z o.o. - Overview
- Exhibits151: OVO TECH Sp. z o.o. - Product / Service
- Exhibits152: OVO TECH Sp. z o.o. - Key offerings
- Exhibits153: Ovobel Foods Ltd. - Overview
- Exhibits154: Ovobel Foods Ltd. - Product / Service
- Exhibits155: Ovobel Foods Ltd. - Key offerings
- Exhibits156: OVOCONCEPT - Overview
- Exhibits157: OVOCONCEPT - Product / Service
- Exhibits158: OVOCONCEPT - Key offerings
- Exhibits159: Sanovo Technology Group - Overview
- Exhibits160: Sanovo Technology Group - Product / Service
- Exhibits161: Sanovo Technology Group - Key offerings
- Exhibits162: SPX FLOW Inc. - Overview
- Exhibits163: SPX FLOW Inc. - Product / Service
- Exhibits164: SPX FLOW Inc. - Key news
- Exhibits165: SPX FLOW Inc. - Key offerings
- Exhibits166: SSP Pvt. Ltd. - Overview
- Exhibits167: SSP Pvt. Ltd. - Product / Service
- Exhibits168: SSP Pvt. Ltd. - Key offerings
- Exhibits169: Van Beek Group BV - Overview
- Exhibits170: Van Beek Group BV - Product / Service
- Exhibits171: Van Beek Group BV - Key offerings
- Exhibits172: Zenyer Egg Machinery Co. Ltd. - Overview
- Exhibits173: Zenyer Egg Machinery Co. Ltd. - Product / Service
- Exhibits174: Zenyer Egg Machinery Co. Ltd. - Key offerings
- Exhibits175: Inclusions checklist
- Exhibits176: Exclusions checklist
- Exhibits177: Currency conversion rates for US$
- Exhibits178: Research methodology
- Exhibits179: Information sources
- Exhibits180: Data validation
- Exhibits181: Validation techniques employed for market sizing
- Exhibits182: Data synthesis
- Exhibits183: 360 degree market analysis
- Exhibits184: List of abbreviations
The egg processing equipment market is forecasted to grow by USD 60.1 mn during 2023-2028, accelerating at a CAGR of 2.09% during the forecast period. The report on the egg processing equipment market provides a holistic analysis, market size and forecast, trends, growth drivers, and challenges, as well as vendor analysis covering around 25 vendors.
The report offers an up-to-date analysis regarding the current market scenario, the latest trends and drivers, and the overall market environment. The market is driven by reduced risk of contamination, wide range of applications of egg products in various industries, and government support driving increase in egg production.
Technavio's egg processing equipment market is segmented as below:
| Market Scope | |
|---|---|
| Base Year | 2024 |
| End Year | 2028 |
| Series Year | 2024-2028 |
| Growth Momentum | Accelerate |
| YOY 2024 | 2.03% |
| CAGR | 2.09% |
| Incremental Value | $60.1mn |
By Product
- Liquid egg products
- Dried egg products
- Frozen egg products
By Type
- Pasteurizers
- Homogenizers
- Egg breakers and separators
- Dryers
- Others
By Geographical Landscape
- North America
- Europe
- APAC
- South America
- Middle East and Africa
This study identifies the influx of innovative technologies resulting in higher efficiency and faster production time as one of the prime reasons driving the egg processing equipment market growth during the next few years. Also, application of processed eggs in nutraceuticals and healthcare products and increase in adoption of hpp technology for egg processing will lead to sizable demand in the market.
The report on the egg processing equipment market covers the following areas:
- Egg processing equipment market sizing
- Egg processing equipment market forecast
- Egg processing equipment market industry analysis
The robust vendor analysis is designed to help clients improve their market position, and in line with this, this report provides a detailed analysis of several leading egg processing equipment market vendors that include ACTINI SAS, Big Dutchman AG, Dion Ltd., Egg Machine, EUROVO Srl, Interovo Egg Group BV, Khalid Majeed Group of Co., Midwest BRD Inc., Moba Group B.V., OVO TECH Sp. z o.o., Ovobel Foods Ltd., OVOCONCEPT, Sanovo Technology Group, SPX FLOW Inc., SSP Pvt. Ltd., Van Beek Group BV, Zenyer Egg Machinery Co. Ltd., and Zhengzhou Allance Trading Co. Ltd.. Also, the egg processing equipment market analysis report includes information on upcoming trends and challenges that will influence market growth. This is to help companies strategize and leverage all forthcoming growth opportunities.
The study was conducted using an objective combination of primary and secondary information including inputs from key participants in the industry. The report contains a comprehensive market and vendor landscape in addition to an analysis of the key vendors.
The publisher presents a detailed picture of the market by the way of study, synthesis, and summation of data from multiple sources by an analysis of key parameters such as profit, pricing, competition, and promotions. It presents various market facets by identifying the key industry influencers. The data presented is comprehensive, reliable, and a result of extensive research - both primary and secondary. The market research reports provide a complete competitive landscape and an in-depth vendor selection methodology and analysis using qualitative and quantitative research to forecast the accurate market growth.
Table of Contents
1 Executive Summary
- 1.1 Market overview
- Executive Summary - Chart on Market Overview
- Executive Summary - Data Table on Market Overview
- Executive Summary - Chart on Global Market Characteristics
- Executive Summary - Chart on Market By Geographical Landscape
- Executive Summary - Chart on Market Segmentation by Product
- Executive Summary - Chart on Market Segmentation by Type
- Executive Summary - Chart on Incremental Growth
- Executive Summary - Data Table on Incremental Growth
- Executive Summary - Chart on Company Market Positioning
2 Market Landscape
- 2.1 Market ecosystem
- Parent Market
- Data Table on - Parent Market
- 2.2 Market characteristics
- Market characteristics analysis
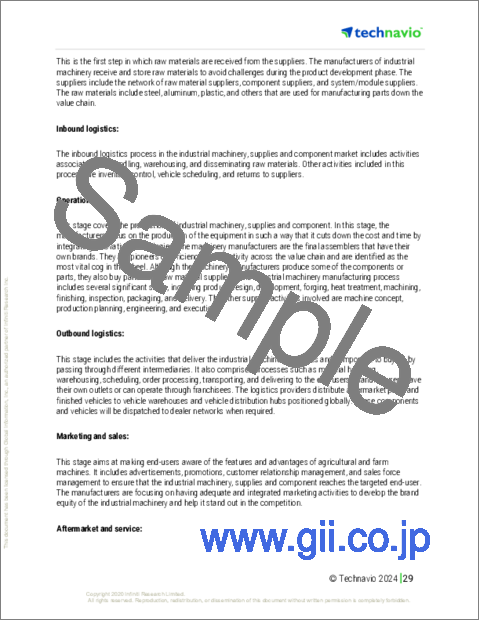
- 2.3 Value chain analysis
- Value Chain Analysis
3 Market Sizing
- 3.1 Market definition
- Offerings of companies included in the market definition
- 3.2 Market segment analysis
- Market segments
- 3.3 Market size 2023
- 3.4 Market outlook: Forecast for 2023-2028
- Chart on Global - Market size and forecast 2023-2028 ($ million)
- Data Table on Global - Market size and forecast 2023-2028 ($ million)
- Chart on Global Market: Year-over-year growth 2023-2028 (%)
- Data Table on Global Market: Year-over-year growth 2023-2028 (%)
4 Historic Market Size
- 4.1 Global Egg Processing Equipment Market 2018 - 2022
- Historic Market Size - Data Table on Global Egg Processing Equipment Market 2018 - 2022 ($ million)
- 4.2 Product segment analysis 2018 - 2022
- Historic Market Size - Product Segment 2018 - 2022 ($ million)
- 4.3 Type segment analysis 2018 - 2022
- Historic Market Size - Type Segment 2018 - 2022 ($ million)
- 4.4 Geography segment analysis 2018 - 2022
- Historic Market Size - Geography Segment 2018 - 2022 ($ million)
- 4.5 Country segment analysis 2018 - 2022
- Historic Market Size - Country Segment 2018 - 2022 ($ million)
5 Five Forces Analysis
- 5.1 Five forces summary
- Five forces analysis - Comparison between 2023 and 2028
- 5.2 Bargaining power of buyers
- Bargaining power of buyers - Impact of key factors 2023 and 2028
- 5.3 Bargaining power of suppliers
- Bargaining power of suppliers - Impact of key factors in 2023 and 2028
- 5.4 Threat of new entrants
- Threat of new entrants - Impact of key factors in 2023 and 2028
- 5.5 Threat of substitutes
- Threat of substitutes - Impact of key factors in 2023 and 2028
- 5.6 Threat of rivalry
- Threat of rivalry - Impact of key factors in 2023 and 2028
- 5.7 Market condition
- Chart on Market condition - Five forces 2023 and 2028
6 Market Segmentation by Product
- 6.1 Market segments
- Chart on Product - Market share 2023-2028 (%)
- Data Table on Product - Market share 2023-2028 (%)
- 6.2 Comparison by Product
- Chart on Comparison by Product
- Data Table on Comparison by Product
- 6.3 Liquid egg products - Market size and forecast 2023-2028
- Chart on Liquid egg products - Market size and forecast 2023-2028 ($ million)
- Data Table on Liquid egg products - Market size and forecast 2023-2028 ($ million)
- Chart on Liquid egg products - Year-over-year growth 2023-2028 (%)
- Data Table on Liquid egg products - Year-over-year growth 2023-2028 (%)
- 6.4 Dried egg products - Market size and forecast 2023-2028
- Chart on Dried egg products - Market size and forecast 2023-2028 ($ million)
- Data Table on Dried egg products - Market size and forecast 2023-2028 ($ million)
- Chart on Dried egg products - Year-over-year growth 2023-2028 (%)
- Data Table on Dried egg products - Year-over-year growth 2023-2028 (%)
- 6.5 Frozen egg products - Market size and forecast 2023-2028
- Chart on Frozen egg products - Market size and forecast 2023-2028 ($ million)
- Data Table on Frozen egg products - Market size and forecast 2023-2028 ($ million)
- Chart on Frozen egg products - Year-over-year growth 2023-2028 (%)
- Data Table on Frozen egg products - Year-over-year growth 2023-2028 (%)
- 6.6 Market opportunity by Product
- Market opportunity by Product ($ million)
- Data Table on Market opportunity by Product ($ million)
7 Market Segmentation by Type
- 7.1 Market segments
- Chart on Type - Market share 2023-2028 (%)
- Data Table on Type - Market share 2023-2028 (%)
- 7.2 Comparison by Type
- Chart on Comparison by Type
- Data Table on Comparison by Type
- 7.3 Pasteurizers - Market size and forecast 2023-2028
- Chart on Pasteurizers - Market size and forecast 2023-2028 ($ million)
- Data Table on Pasteurizers - Market size and forecast 2023-2028 ($ million)
- Chart on Pasteurizers - Year-over-year growth 2023-2028 (%)
- Data Table on Pasteurizers - Year-over-year growth 2023-2028 (%)
- 7.4 Homogenizers - Market size and forecast 2023-2028
- Chart on Homogenizers - Market size and forecast 2023-2028 ($ million)
- Data Table on Homogenizers - Market size and forecast 2023-2028 ($ million)
- Chart on Homogenizers - Year-over-year growth 2023-2028 (%)
- Data Table on Homogenizers - Year-over-year growth 2023-2028 (%)
- 7.5 Egg breakers and separators - Market size and forecast 2023-2028
- Chart on Egg breakers and separators - Market size and forecast 2023-2028 ($ million)
- Data Table on Egg breakers and separators - Market size and forecast 2023-2028 ($ million)
- Chart on Egg breakers and separators - Year-over-year growth 2023-2028 (%)
- Data Table on Egg breakers and separators - Year-over-year growth 2023-2028 (%)
- 7.6 Dryers - Market size and forecast 2023-2028
- Chart on Dryers - Market size and forecast 2023-2028 ($ million)
- Data Table on Dryers - Market size and forecast 2023-2028 ($ million)
- Chart on Dryers - Year-over-year growth 2023-2028 (%)
- Data Table on Dryers - Year-over-year growth 2023-2028 (%)
- 7.7 Others - Market size and forecast 2023-2028
- Chart on Others - Market size and forecast 2023-2028 ($ million)
- Data Table on Others - Market size and forecast 2023-2028 ($ million)
- Chart on Others - Year-over-year growth 2023-2028 (%)
- Data Table on Others - Year-over-year growth 2023-2028 (%)
- 7.8 Market opportunity by Type
- Market opportunity by Type ($ million)
- Data Table on Market opportunity by Type ($ million)
8 Customer Landscape
- 8.1 Customer landscape overview
- Analysis of price sensitivity, lifecycle, customer purchase basket, adoption rates, and purchase criteria
9 Geographic Landscape
- 9.1 Geographic segmentation
- Chart on Market share By Geographical Landscape 2023-2028 (%)
- Data Table on Market share By Geographical Landscape 2023-2028 (%)
- 9.2 Geographic comparison
- Chart on Geographic comparison
- Data Table on Geographic comparison
- 9.3 North America - Market size and forecast 2023-2028
- Chart on North America - Market size and forecast 2023-2028 ($ million)
- Data Table on North America - Market size and forecast 2023-2028 ($ million)
- Chart on North America - Year-over-year growth 2023-2028 (%)
- Data Table on North America - Year-over-year growth 2023-2028 (%)
- 9.4 Europe - Market size and forecast 2023-2028
- Chart on Europe - Market size and forecast 2023-2028 ($ million)
- Data Table on Europe - Market size and forecast 2023-2028 ($ million)
- Chart on Europe - Year-over-year growth 2023-2028 (%)
- Data Table on Europe - Year-over-year growth 2023-2028 (%)
- 9.5 APAC - Market size and forecast 2023-2028
- Chart on APAC - Market size and forecast 2023-2028 ($ million)
- Data Table on APAC - Market size and forecast 2023-2028 ($ million)
- Chart on APAC - Year-over-year growth 2023-2028 (%)
- Data Table on APAC - Year-over-year growth 2023-2028 (%)
- 9.6 South America - Market size and forecast 2023-2028
- Chart on South America - Market size and forecast 2023-2028 ($ million)
- Data Table on South America - Market size and forecast 2023-2028 ($ million)
- Chart on South America - Year-over-year growth 2023-2028 (%)
- Data Table on South America - Year-over-year growth 2023-2028 (%)
- 9.7 Middle East and Africa - Market size and forecast 2023-2028
- Chart on Middle East and Africa - Market size and forecast 2023-2028 ($ million)
- Data Table on Middle East and Africa - Market size and forecast 2023-2028 ($ million)
- Chart on Middle East and Africa - Year-over-year growth 2023-2028 (%)
- Data Table on Middle East and Africa - Year-over-year growth 2023-2028 (%)
- 9.8 US - Market size and forecast 2023-2028
- Chart on US - Market size and forecast 2023-2028 ($ million)
- Data Table on US - Market size and forecast 2023-2028 ($ million)
- Chart on US - Year-over-year growth 2023-2028 (%)
- Data Table on US - Year-over-year growth 2023-2028 (%)
- 9.9 China - Market size and forecast 2023-2028
- Chart on China - Market size and forecast 2023-2028 ($ million)
- Data Table on China - Market size and forecast 2023-2028 ($ million)
- Chart on China - Year-over-year growth 2023-2028 (%)
- Data Table on China - Year-over-year growth 2023-2028 (%)
- 9.10 France - Market size and forecast 2023-2028
- Chart on France - Market size and forecast 2023-2028 ($ million)
- Data Table on France - Market size and forecast 2023-2028 ($ million)
- Chart on France - Year-over-year growth 2023-2028 (%)
- Data Table on France - Year-over-year growth 2023-2028 (%)
- 9.11 Canada - Market size and forecast 2023-2028
- Chart on Canada - Market size and forecast 2023-2028 ($ million)
- Data Table on Canada - Market size and forecast 2023-2028 ($ million)
- Chart on Canada - Year-over-year growth 2023-2028 (%)
- Data Table on Canada - Year-over-year growth 2023-2028 (%)
- 9.12 Japan - Market size and forecast 2023-2028
- Chart on Japan - Market size and forecast 2023-2028 ($ million)
- Data Table on Japan - Market size and forecast 2023-2028 ($ million)
- Chart on Japan - Year-over-year growth 2023-2028 (%)
- Data Table on Japan - Year-over-year growth 2023-2028 (%)
- 9.13 Market opportunity By Geographical Landscape
- Market opportunity By Geographical Landscape ($ million)
- Data Tables on Market opportunity By Geographical Landscape ($ million)
10 Drivers, Challenges, and Opportunity/Restraints
- 10.1 Market drivers
- 10.2 Market challenges
- 10.3 Impact of drivers and challenges
- Impact of drivers and challenges in 2023 and 2028
- 10.4 Market opportunities/restraints
11 Competitive Landscape
- 11.1 Overview
- 11.2 Competitive Landscape
- Overview on criticality of inputs and factors of differentiation
- 11.3 Landscape disruption
- Overview on factors of disruption
- 11.4 Industry risks
- Impact of key risks on business
12 Competitive Analysis
- 12.1 Companies profiled
- Companies covered
- 12.2 Market positioning of companies
- Matrix on companies position and classification
- 12.3 ACTINI SAS
- ACTINI SAS - Overview
- ACTINI SAS - Product / Service
- ACTINI SAS - Key offerings
- 12.4 Big Dutchman AG
- Big Dutchman AG - Overview
- Big Dutchman AG - Product / Service
- Big Dutchman AG - Key offerings
- 12.5 Dion Ltd.
- Dion Ltd. - Overview
- Dion Ltd. - Product / Service
- Dion Ltd. - Key offerings
- 12.6 Egg Machine
- Egg Machine - Overview
- Egg Machine - Product / Service
- Egg Machine - Key offerings
- 12.7 Khalid Majeed Group of Co.
- Khalid Majeed Group of Co. - Overview
- Khalid Majeed Group of Co. - Product / Service
- Khalid Majeed Group of Co. - Key offerings
- 12.8 Midwest BRD Inc.
- Midwest BRD Inc. - Overview
- Midwest BRD Inc. - Product / Service
- Midwest BRD Inc. - Key offerings
- 12.9 Moba Group B.V.
- Moba Group B.V. - Overview
- Moba Group B.V. - Product / Service
- Moba Group B.V. - Key offerings
- 12.10 OVO TECH Sp. z o.o.
- OVO TECH Sp. z o.o. - Overview
- OVO TECH Sp. z o.o. - Product / Service
- OVO TECH Sp. z o.o. - Key offerings
- 12.11 Ovobel Foods Ltd.
- Ovobel Foods Ltd. - Overview
- Ovobel Foods Ltd. - Product / Service
- Ovobel Foods Ltd. - Key offerings
- 12.12 OVOCONCEPT
- OVOCONCEPT - Overview
- OVOCONCEPT - Product / Service
- OVOCONCEPT - Key offerings
- 12.13 Sanovo Technology Group
- Sanovo Technology Group - Overview
- Sanovo Technology Group - Product / Service
- Sanovo Technology Group - Key offerings
- 12.14 SPX FLOW Inc.
- SPX FLOW Inc. - Overview
- SPX FLOW Inc. - Product / Service
- SPX FLOW Inc. - Key news
- SPX FLOW Inc. - Key offerings
- 12.15 SSP Pvt. Ltd.
- SSP Pvt. Ltd. - Overview
- SSP Pvt. Ltd. - Product / Service
- SSP Pvt. Ltd. - Key offerings
- 12.16 Van Beek Group BV
- Van Beek Group BV - Overview
- Van Beek Group BV - Product / Service
- Van Beek Group BV - Key offerings
- 12.17 Zenyer Egg Machinery Co. Ltd.
- Zenyer Egg Machinery Co. Ltd. - Overview
- Zenyer Egg Machinery Co. Ltd. - Product / Service
- Zenyer Egg Machinery Co. Ltd. - Key offerings
13 Appendix
- 13.1 Scope of the report
- 13.2 Inclusions and exclusions checklist
- Inclusions checklist
- Exclusions checklist
- 13.3 Currency conversion rates for US$
- Currency conversion rates for US$
- 13.4 Research methodology
- Research methodology
- 13.5 Data procurement
- Information sources
- 13.6 Data validation
- Data validation
- 13.7 Validation techniques employed for market sizing
- Validation techniques employed for market sizing
- 13.8 Data synthesis
- Data synthesis
- 13.9 360 degree market analysis
- 360 degree market analysis
- 13.10 List of abbreviations
- List of abbreviations
