|
|
市場調査レポート
商品コード
1681211
ポータブルカヤックの世界市場、2025-2029年Global Portable Kayaks Market 2025-2029 |
||||||
|
|||||||
カスタマイズ可能
|
|||||||


| ポータブルカヤックの世界市場、2025-2029年 |
|
出版日: 2025年03月01日
発行: TechNavio
ページ情報: 英文 240 Pages
納期: 即納可能
|

全表示
- 概要
- 目次
ポータブルカヤック市場は2024-2029年に1,180万米ドル、予測期間中のCAGRは1.9%で成長すると予測されます。
当レポートでは、ポータブルカヤック市場の全体的な分析、市場規模・予測、動向、成長促進要因、課題、約25のベンダーを網羅したベンダー分析などを掲載しています。
現在の市場シナリオ、最新動向と促進要因、市場環境全体に関する最新分析を提供しています。レクリエーション用カヤックへの嗜好の高まり、パドルスポーツコンテストの増加、ソフトアドベンチャースポーツ活動への関心の高まりなどが市場を牽引しています。
| 市場範囲 | |
|---|---|
| 基準年 | 2025 |
| 終了年 | 2029 |
| 予測期間 | 2025-2029 |
| 成長モメンタム | 加速 |
| 前年比2025年 | 1.4% |
| CAGR | 1.9% |
| 増分額 | 1,180万米ドル |
本調査は、業界の主要参加者からのインプットを含め、一次情報と二次情報を客観的に組み合わせて実施しました。レポートには、主要企業の分析に加え、包括的な市場規模データ、地域分析によるセグメント、ベンダー情勢が含まれています。レポートにはヒストリカルデータと予測データがあります。
本調査では、今後数年間のポータブルカヤック市場の成長を促進する主な要因の1つとして、人工的なウォータースポーツ体験の普及を挙げています。また、オンラインチャネルや小売店を通じての流通需要の高まりや、カヤックを製造するための新しい革新的な原材料の使用は、市場の大きな需要につながります。
目次
第1章 エグゼクティブサマリー
- 市場概要
第2章 Technavio分析
- 価格・ライフサイクル・顧客購入バスケット・採用率・購入基準の分析
- インプットの重要性と差別化の要因
- 混乱の要因
- 促進要因と課題の影響
第3章 市場情勢
- 市場エコシステム
- 市場の特徴
- バリューチェーン分析
第4章 市場規模
- 市場の定義
- 市場セグメント分析
- 市場規模 2024
- 市場の見通し 2024-2029
第5章 市場規模実績
- ポータブルカヤックの世界市場 2019-2023
- 材料セグメント分析 2019-2023
- 用途別セグメント分析 2019-2023
- 製品セグメント分析 2019-2023
- 流通チャネルセグメント分析 2019-2023
- 地域別セグメント分析 2019-2023
- 国別セグメント分析 2019-2023
第6章 定性分析
- AIの影響ポータブルカヤックの世界市場
第7章 ファイブフォース分析
- ファイブフォースの要約
- 買い手の交渉力
- 供給企業の交渉力
- 新規参入業者の脅威
- 代替品の脅威
- 競争の脅威
- 市況
第8章 市場セグメンテーション:素材別
- 市場セグメント
- 比較:素材別
- ポリエチレン:市場規模と予測 2024-2029
- PVC:市場規模と予測 2024-2029
- ハイパロン:市場規模と予測 2024-2029
- 複合:市場規模と予測 2024-2029
- 市場機会:素材別
第9章 市場セグメンテーション:用途別
- 市場セグメント
- 比較:用途別
- レクリエーション:市場規模と予測 2024-2029
- ツーリング:市場規模と予測 2024-2029
- ホワイトウォーター:市場規模と予測 2024-2029
- 釣り:市場規模と予測 2024-2029
- 市場機会:用途別
第10章 市場セグメンテーション:製品別
- 市場セグメント
- 比較:製品別
- インフレータブルカヤック:市場規模と予測 2024-2029
- 折りたたみカヤック:市場規模と予測 2024-2029
- 市場機会:製品別
第11章 市場セグメンテーション:流通チャネル別
- 市場セグメント
- 比較:流通チャネル別
- スポーツ用品小売店:市場規模と予測 2024-2029
- デパート、大型スーパーマーケット、スーパーマーケット:市場規模と予測 2024-2029
- オンライン小売:市場規模と予測 2024-2029
- その他:市場規模と予測 2024-2029
- 市場機会:流通チャネル別
第12章 顧客情勢
- 顧客情勢の概要
第13章 地域別情勢
- 地域別セグメンテーション
- 地域別比較
- 北米:市場規模と予測 2024-2029
- 欧州:市場規模と予測 2024-2029
- アジア太平洋:市場規模と予測 2024-2029
- 南米:市場規模と予測 2024-2029
- 中東・アフリカ:市場規模と予測 2024-2029
- 米国:市場規模と予測 2024-2029
- カナダ:市場規模と予測 2024-2029
- 中国:市場規模と予測 2024-2029
- 英国:市場規模と予測 2024-2029
- ドイツ:市場規模と予測 2024-2029
- 日本:市場規模と予測 2024-2029
- インド:市場規模と予測 2024-2029
- フランス:市場規模と予測 2024-2029
- イタリア:市場規模と予測 2024-2029
- ブラジル:市場規模と予測 2024-2029
- 市場機会:地域情勢別
第14章 促進要因・課題・機会・抑制要因
- 市場促進要因
- 市場の課題
- 促進要因と課題の影響
- 市場の機会・抑制要因
第15章 競合情勢
- 概要
- 競合情勢
- 混乱の状況
- 業界のリスク
第16章 競合分析
- 企業プロファイル
- 企業ランキング指数
- 企業の市場ポジショニング
- AIRE Inc.
- Aqua Marina
- Aqua Xtreme
- BIG Adventures LLC
- Gumotex Group
- Hangzhou Kudo Outdoors Inc.
- HYSIDE Inflatables
- Klepper Lifestyle GmbH
- Long Haul Folding Kayaks
- NAUTIRAID
- Nova Craft Canoe
- Oru Kayak Inc.
- Pelican International Inc.
- Point 65 Sweden AB
- Tahe Kayaks OU
第17章 付録
The portable kayaks market is forecasted to grow by USD 11.8 million during 2024-2029, accelerating at a CAGR of 1.9% during the forecast period. The report on the portable kayaks market provides a holistic analysis, market size and forecast, trends, growth drivers, and challenges, as well as vendor analysis covering around 25 vendors.
The report offers an up-to-date analysis regarding the current market scenario, the latest trends and drivers, and the overall market environment. The market is driven by growing preference for recreational kayaking, increasing number of paddle sports contests, and rising interest in soft adventure sports activities.
| Market Scope | |
|---|---|
| Base Year | 2025 |
| End Year | 2029 |
| Series Year | 2025-2029 |
| Growth Momentum | Accelerate |
| YOY 2025 | 1.4% |
| CAGR | 1.9% |
| Incremental Value | $11.8 mn |
The study was conducted using an objective combination of primary and secondary information including inputs from key participants in the industry. The report contains a comprehensive market size data, segment with regional analysis and vendor landscape in addition to an analysis of the key companies. Reports have historic and forecast data.
Technavio's portable kayaks market is segmented as below:
By Material
- Polyethylene
- PVC
- Hypalon
- Composite
By Application
- Recreational
- Touring
- Whitewater
- Fishing
By Product
- Inflatable kayaks
- Folding kayaks
By Distribution Channel
- Sports goods retailers
- Department stores/hypermarkets and supermarkets
- Online retail
- Others
By Geographical Landscape
- North America
- Europe
- APAC
- South America
- Middle East and Africa
This study identifies the artificial water sports experiences gaining traction as one of the prime reasons driving the portable kayaks market growth during the next few years. Also, rising demand for distribution through online channels and retailers and use of new innovative raw materials for manufacturing kayaks will lead to sizable demand in the market.
The report on the portable kayaks market covers the following areas:
- Portable Kayaks Market sizing
- Portable Kayaks Market forecast
- Portable Kayaks Market industry analysis
The robust vendor analysis is designed to help clients improve their market position, and in line with this, this report provides a detailed analysis of several leading portable kayaks market vendors that include AIRE Inc., Aqua Marina, Aqua Xtreme, BIG Adventures LLC, Gumotex Group, Hangzhou Kudo Outdoors Inc., HYSIDE Inflatables, Klepper Lifestyle GmbH, Long Haul Folding Kayaks, NAUTIRAID, Nova Craft Canoe, Oru Kayak Inc., Pelican International Inc., Point 65 Sweden AB, rotomod, Sea Eagle Boats Inc., Tahe Kayaks OU, TRAK Outdoors Ltd., WAKA KAYAKS, and WATER SPORT EQUIPMENT GROUP. Also, the portable kayaks market analysis report includes information on upcoming trends and challenges that will influence market growth. This is to help companies strategize and leverage all forthcoming growth opportunities.
The publisher presents a detailed picture of the market by the way of study, synthesis, and summation of data from multiple sources by an analysis of key parameters such as profit, pricing, competition, and promotions. It presents various market facets by identifying the key industry influencers. The data presented is comprehensive, reliable, and a result of extensive primary and secondary research. The market research reports provide a complete competitive landscape and an in-depth vendor selection methodology and analysis using qualitative and quantitative research to forecast accurate market growth.
Table of Contents
1 Executive Summary
- 1.1 Market overview
- Executive Summary - Chart on Market Overview
- Executive Summary - Data Table on Market Overview
- Executive Summary - Chart on Global Market Characteristics
- Executive Summary - Chart on Market By Geographical Landscape
- Executive Summary - Chart on Market Segmentation by Material
- Executive Summary - Chart on Market Segmentation by Application
- Executive Summary - Chart on Market Segmentation by Product
- Executive Summary - Chart on Market Segmentation by Distribution Channel
- Executive Summary - Chart on Incremental Growth
- Executive Summary - Data Table on Incremental Growth
- Executive Summary - Chart on Company Market Positioning
2 Technavio Analysis
- 2.1 Analysis of price sensitivity, lifecycle, customer purchase basket, adoption rates, and purchase criteria
- Analysis of price sensitivity, lifecycle, customer purchase basket, adoption rates, and purchase criteria
- 2.2 Criticality of inputs and Factors of differentiation
- Overview on criticality of inputs and factors of differentiation
- 2.3 Factors of disruption
- Overview on factors of disruption
- 2.4 Impact of drivers and challenges
- Impact of drivers and challenges in 2024 and 2029
3 Market Landscape
- 3.1 Market ecosystem
- Parent Market
- Data Table on - Parent Market
- 3.2 Market characteristics
- Market characteristics analysis
- 3.3 Value chain analysis
- Value chain analysis
4 Market Sizing
- 4.1 Market definition
- Offerings of companies included in the market definition
- 4.2 Market segment analysis
- Market segments
- 4.3 Market size 2024
- 4.4 Market outlook: Forecast for 2024-2029
- Chart on Global - Market size and forecast 2024-2029 ($ million)
- Data Table on Global - Market size and forecast 2024-2029 ($ million)
- Chart on Global Market: Year-over-year growth 2024-2029 (%)
- Data Table on Global Market: Year-over-year growth 2024-2029 (%)
5 Historic Market Size
- 5.1 Global Portable Kayaks Market 2019 - 2023
- Historic Market Size - Data Table on Global Portable Kayaks Market 2019 - 2023 ($ million)
- 5.2 Material segment analysis 2019 - 2023
- Historic Market Size - Material Segment 2019 - 2023 ($ million)
- 5.3 Application segment analysis 2019 - 2023
- Historic Market Size - Application Segment 2019 - 2023 ($ million)
- 5.4 Product segment analysis 2019 - 2023
- Historic Market Size - Product Segment 2019 - 2023 ($ million)
- 5.5 Distribution Channel segment analysis 2019 - 2023
- Historic Market Size - Distribution Channel Segment 2019 - 2023 ($ million)
- 5.6 Geography segment analysis 2019 - 2023
- Historic Market Size - Geography Segment 2019 - 2023 ($ million)
- 5.7 Country segment analysis 2019 - 2023
- Historic Market Size - Country Segment 2019 - 2023 ($ million)
6 Qualitative Analysis
- 6.1 Impact of AI on the global portable kayaks market
7 Five Forces Analysis
- 7.1 Five forces summary
- Five forces analysis - Comparison between 2024 and 2029
- 7.2 Bargaining power of buyers
- Bargaining power of buyers - Impact of key factors 2024 and 2029
- 7.3 Bargaining power of suppliers
- Bargaining power of suppliers - Impact of key factors in 2024 and 2029
- 7.4 Threat of new entrants
- Threat of new entrants - Impact of key factors in 2024 and 2029
- 7.5 Threat of substitutes
- Threat of substitutes - Impact of key factors in 2024 and 2029
- 7.6 Threat of rivalry
- Threat of rivalry - Impact of key factors in 2024 and 2029
- 7.7 Market condition
- Chart on Market condition - Five forces 2024 and 2029
8 Market Segmentation by Material
- 8.1 Market segments
- Chart on Material - Market share 2024-2029 (%)
- Data Table on Material - Market share 2024-2029 (%)
- 8.2 Comparison by Material
- Chart on Comparison by Material
- Data Table on Comparison by Material
- 8.3 Polyethylene - Market size and forecast 2024-2029
- Chart on Polyethylene - Market size and forecast 2024-2029 ($ million)
- Data Table on Polyethylene - Market size and forecast 2024-2029 ($ million)
- Chart on Polyethylene - Year-over-year growth 2024-2029 (%)
- Data Table on Polyethylene - Year-over-year growth 2024-2029 (%)
- 8.4 PVC - Market size and forecast 2024-2029
- Chart on PVC - Market size and forecast 2024-2029 ($ million)
- Data Table on PVC - Market size and forecast 2024-2029 ($ million)
- Chart on PVC - Year-over-year growth 2024-2029 (%)
- Data Table on PVC - Year-over-year growth 2024-2029 (%)
- 8.5 Hypalon - Market size and forecast 2024-2029
- Chart on Hypalon - Market size and forecast 2024-2029 ($ million)
- Data Table on Hypalon - Market size and forecast 2024-2029 ($ million)
- Chart on Hypalon - Year-over-year growth 2024-2029 (%)
- Data Table on Hypalon - Year-over-year growth 2024-2029 (%)
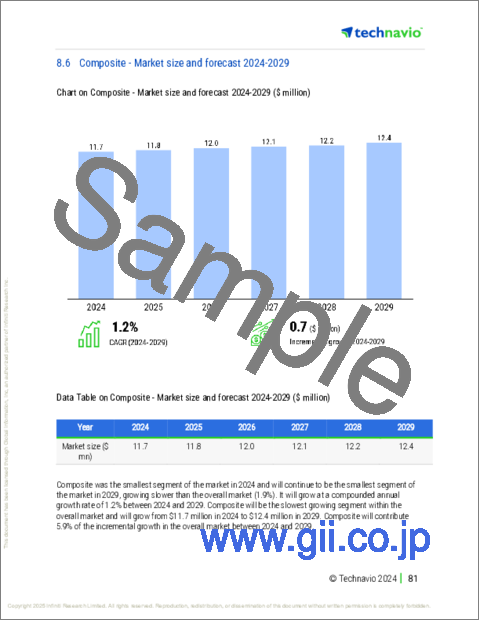
- 8.6 Composite - Market size and forecast 2024-2029
- Chart on Composite - Market size and forecast 2024-2029 ($ million)
- Data Table on Composite - Market size and forecast 2024-2029 ($ million)
- Chart on Composite - Year-over-year growth 2024-2029 (%)
- Data Table on Composite - Year-over-year growth 2024-2029 (%)
- 8.7 Market opportunity by Material
- Market opportunity by Material ($ million)
- Data Table on Market opportunity by Material ($ million)
9 Market Segmentation by Application
- 9.1 Market segments
- Chart on Application - Market share 2024-2029 (%)
- Data Table on Application - Market share 2024-2029 (%)
- 9.2 Comparison by Application
- Chart on Comparison by Application
- Data Table on Comparison by Application
- 9.3 Recreational - Market size and forecast 2024-2029
- Chart on Recreational - Market size and forecast 2024-2029 ($ million)
- Data Table on Recreational - Market size and forecast 2024-2029 ($ million)
- Chart on Recreational - Year-over-year growth 2024-2029 (%)
- Data Table on Recreational - Year-over-year growth 2024-2029 (%)
- 9.4 Touring - Market size and forecast 2024-2029
- Chart on Touring - Market size and forecast 2024-2029 ($ million)
- Data Table on Touring - Market size and forecast 2024-2029 ($ million)
- Chart on Touring - Year-over-year growth 2024-2029 (%)
- Data Table on Touring - Year-over-year growth 2024-2029 (%)
- 9.5 Whitewater - Market size and forecast 2024-2029
- Chart on Whitewater - Market size and forecast 2024-2029 ($ million)
- Data Table on Whitewater - Market size and forecast 2024-2029 ($ million)
- Chart on Whitewater - Year-over-year growth 2024-2029 (%)
- Data Table on Whitewater - Year-over-year growth 2024-2029 (%)
- 9.6 Fishing - Market size and forecast 2024-2029
- Chart on Fishing - Market size and forecast 2024-2029 ($ million)
- Data Table on Fishing - Market size and forecast 2024-2029 ($ million)
- Chart on Fishing - Year-over-year growth 2024-2029 (%)
- Data Table on Fishing - Year-over-year growth 2024-2029 (%)
- 9.7 Market opportunity by Application
- Market opportunity by Application ($ million)
- Data Table on Market opportunity by Application ($ million)
10 Market Segmentation by Product
- 10.1 Market segments
- Chart on Product - Market share 2024-2029 (%)
- Data Table on Product - Market share 2024-2029 (%)
- 10.2 Comparison by Product
- Chart on Comparison by Product
- Data Table on Comparison by Product
- 10.3 Inflatable kayaks - Market size and forecast 2024-2029
- Chart on Inflatable kayaks - Market size and forecast 2024-2029 ($ million)
- Data Table on Inflatable kayaks - Market size and forecast 2024-2029 ($ million)
- Chart on Inflatable kayaks - Year-over-year growth 2024-2029 (%)
- Data Table on Inflatable kayaks - Year-over-year growth 2024-2029 (%)
- 10.4 Folding kayaks - Market size and forecast 2024-2029
- Chart on Folding kayaks - Market size and forecast 2024-2029 ($ million)
- Data Table on Folding kayaks - Market size and forecast 2024-2029 ($ million)
- Chart on Folding kayaks - Year-over-year growth 2024-2029 (%)
- Data Table on Folding kayaks - Year-over-year growth 2024-2029 (%)
- 10.5 Market opportunity by Product
- Market opportunity by Product ($ million)
- Data Table on Market opportunity by Product ($ million)
11 Market Segmentation by Distribution Channel
- 11.1 Market segments
- Chart on Distribution Channel - Market share 2024-2029 (%)
- Data Table on Distribution Channel - Market share 2024-2029 (%)
- 11.2 Comparison by Distribution Channel
- Chart on Comparison by Distribution Channel
- Data Table on Comparison by Distribution Channel
- 11.3 Sports goods retailers - Market size and forecast 2024-2029
- Chart on Sports goods retailers - Market size and forecast 2024-2029 ($ million)
- Data Table on Sports goods retailers - Market size and forecast 2024-2029 ($ million)
- Chart on Sports goods retailers - Year-over-year growth 2024-2029 (%)
- Data Table on Sports goods retailers - Year-over-year growth 2024-2029 (%)
- 11.4 Department stores/hypermarkets and supermarkets - Market size and forecast 2024-2029
- Chart on Department stores/hypermarkets and supermarkets - Market size and forecast 2024-2029 ($ million)
- Data Table on Department stores/hypermarkets and supermarkets - Market size and forecast 2024-2029 ($ million)
- Chart on Department stores/hypermarkets and supermarkets - Year-over-year growth 2024-2029 (%)
- Data Table on Department stores/hypermarkets and supermarkets - Year-over-year growth 2024-2029 (%)
- 11.5 Online retail - Market size and forecast 2024-2029
- Chart on Online retail - Market size and forecast 2024-2029 ($ million)
- Data Table on Online retail - Market size and forecast 2024-2029 ($ million)
- Chart on Online retail - Year-over-year growth 2024-2029 (%)
- Data Table on Online retail - Year-over-year growth 2024-2029 (%)
- 11.6 Others - Market size and forecast 2024-2029
- Chart on Others - Market size and forecast 2024-2029 ($ million)
- Data Table on Others - Market size and forecast 2024-2029 ($ million)
- Chart on Others - Year-over-year growth 2024-2029 (%)
- Data Table on Others - Year-over-year growth 2024-2029 (%)
- 11.7 Market opportunity by Distribution Channel
- Market opportunity by Distribution Channel ($ million)
- Data Table on Market opportunity by Distribution Channel ($ million)
12 Customer Landscape
- 12.1 Customer landscape overview
- Analysis of price sensitivity, lifecycle, customer purchase basket, adoption rates, and purchase criteria
13 Geographic Landscape
- 13.1 Geographic segmentation
- Chart on Market share By Geographical Landscape 2024-2029 (%)
- Data Table on Market share By Geographical Landscape 2024-2029 (%)
- 13.2 Geographic comparison
- Chart on Geographic comparison
- Data Table on Geographic comparison
- 13.3 North America - Market size and forecast 2024-2029
- Chart on North America - Market size and forecast 2024-2029 ($ million)
- Data Table on North America - Market size and forecast 2024-2029 ($ million)
- Chart on North America - Year-over-year growth 2024-2029 (%)
- Data Table on North America - Year-over-year growth 2024-2029 (%)
- 13.4 Europe - Market size and forecast 2024-2029
- Chart on Europe - Market size and forecast 2024-2029 ($ million)
- Data Table on Europe - Market size and forecast 2024-2029 ($ million)
- Chart on Europe - Year-over-year growth 2024-2029 (%)
- Data Table on Europe - Year-over-year growth 2024-2029 (%)
- 13.5 APAC - Market size and forecast 2024-2029
- Chart on APAC - Market size and forecast 2024-2029 ($ million)
- Data Table on APAC - Market size and forecast 2024-2029 ($ million)
- Chart on APAC - Year-over-year growth 2024-2029 (%)
- Data Table on APAC - Year-over-year growth 2024-2029 (%)
- 13.6 South America - Market size and forecast 2024-2029
- Chart on South America - Market size and forecast 2024-2029 ($ million)
- Data Table on South America - Market size and forecast 2024-2029 ($ million)
- Chart on South America - Year-over-year growth 2024-2029 (%)
- Data Table on South America - Year-over-year growth 2024-2029 (%)
- 13.7 Middle East and Africa - Market size and forecast 2024-2029
- Chart on Middle East and Africa - Market size and forecast 2024-2029 ($ million)
- Data Table on Middle East and Africa - Market size and forecast 2024-2029 ($ million)
- Chart on Middle East and Africa - Year-over-year growth 2024-2029 (%)
- Data Table on Middle East and Africa - Year-over-year growth 2024-2029 (%)
- 13.8 US - Market size and forecast 2024-2029
- Chart on US - Market size and forecast 2024-2029 ($ million)
- Data Table on US - Market size and forecast 2024-2029 ($ million)
- Chart on US - Year-over-year growth 2024-2029 (%)
- Data Table on US - Year-over-year growth 2024-2029 (%)
- 13.9 Canada - Market size and forecast 2024-2029
- Chart on Canada - Market size and forecast 2024-2029 ($ million)
- Data Table on Canada - Market size and forecast 2024-2029 ($ million)
- Chart on Canada - Year-over-year growth 2024-2029 (%)
- Data Table on Canada - Year-over-year growth 2024-2029 (%)
- 13.10 China - Market size and forecast 2024-2029
- Chart on China - Market size and forecast 2024-2029 ($ million)
- Data Table on China - Market size and forecast 2024-2029 ($ million)
- Chart on China - Year-over-year growth 2024-2029 (%)
- Data Table on China - Year-over-year growth 2024-2029 (%)
- 13.11 UK - Market size and forecast 2024-2029
- Chart on UK - Market size and forecast 2024-2029 ($ million)
- Data Table on UK - Market size and forecast 2024-2029 ($ million)
- Chart on UK - Year-over-year growth 2024-2029 (%)
- Data Table on UK - Year-over-year growth 2024-2029 (%)
- 13.12 Germany - Market size and forecast 2024-2029
- Chart on Germany - Market size and forecast 2024-2029 ($ million)
- Data Table on Germany - Market size and forecast 2024-2029 ($ million)
- Chart on Germany - Year-over-year growth 2024-2029 (%)
- Data Table on Germany - Year-over-year growth 2024-2029 (%)
- 13.13 Japan - Market size and forecast 2024-2029
- Chart on Japan - Market size and forecast 2024-2029 ($ million)
- Data Table on Japan - Market size and forecast 2024-2029 ($ million)
- Chart on Japan - Year-over-year growth 2024-2029 (%)
- Data Table on Japan - Year-over-year growth 2024-2029 (%)
- 13.14 India - Market size and forecast 2024-2029
- Chart on India - Market size and forecast 2024-2029 ($ million)
- Data Table on India - Market size and forecast 2024-2029 ($ million)
- Chart on India - Year-over-year growth 2024-2029 (%)
- Data Table on India - Year-over-year growth 2024-2029 (%)
- 13.15 France - Market size and forecast 2024-2029
- Chart on France - Market size and forecast 2024-2029 ($ million)
- Data Table on France - Market size and forecast 2024-2029 ($ million)
- Chart on France - Year-over-year growth 2024-2029 (%)
- Data Table on France - Year-over-year growth 2024-2029 (%)
- 13.16 Italy - Market size and forecast 2024-2029
- Chart on Italy - Market size and forecast 2024-2029 ($ million)
- Data Table on Italy - Market size and forecast 2024-2029 ($ million)
- Chart on Italy - Year-over-year growth 2024-2029 (%)
- Data Table on Italy - Year-over-year growth 2024-2029 (%)
- 13.17 Brazil - Market size and forecast 2024-2029
- Chart on Brazil - Market size and forecast 2024-2029 ($ million)
- Data Table on Brazil - Market size and forecast 2024-2029 ($ million)
- Chart on Brazil - Year-over-year growth 2024-2029 (%)
- Data Table on Brazil - Year-over-year growth 2024-2029 (%)
- 13.18 Market opportunity By Geographical Landscape
- Market opportunity By Geographical Landscape ($ million)
- Data Tables on Market opportunity By Geographical Landscape ($ million)
14 Drivers, Challenges, and Opportunity/Restraints
- 14.1 Market drivers
- 14.2 Market challenges
- 14.3 Impact of drivers and challenges
- Impact of drivers and challenges in 2024 and 2029
- 14.4 Market opportunities/restraints
15 Competitive Landscape
- 15.1 Overview
- 15.2 Competitive Landscape
- Overview on criticality of inputs and factors of differentiation
- 15.3 Landscape disruption
- Overview on factors of disruption
- 15.4 Industry risks
- Impact of key risks on business
16 Competitive Analysis
- 16.1 Companies profiled
- Companies covered
- 16.2 Company ranking index
- Company ranking index
- 16.3 Market positioning of companies
- Matrix on companies position and classification
- 16.4 AIRE Inc.
- AIRE Inc. - Overview
- AIRE Inc. - Product / Service
- AIRE Inc. - Key offerings
- SWOT
- 16.5 Aqua Marina
- Aqua Marina - Overview
- Aqua Marina - Product / Service
- Aqua Marina - Key offerings
- SWOT
- 16.6 Aqua Xtreme
- Aqua Xtreme - Overview
- Aqua Xtreme - Product / Service
- Aqua Xtreme - Key offerings
- SWOT
- 16.7 BIG Adventures LLC
- BIG Adventures LLC - Overview
- BIG Adventures LLC - Product / Service
- BIG Adventures LLC - Key offerings
- SWOT
- 16.8 Gumotex Group
- Gumotex Group - Overview
- Gumotex Group - Product / Service
- Gumotex Group - Key offerings
- SWOT
- 16.9 Hangzhou Kudo Outdoors Inc.
- Hangzhou Kudo Outdoors Inc. - Overview
- Hangzhou Kudo Outdoors Inc. - Product / Service
- Hangzhou Kudo Outdoors Inc. - Key offerings
- SWOT
- 16.10 HYSIDE Inflatables
- HYSIDE Inflatables - Overview
- HYSIDE Inflatables - Product / Service
- HYSIDE Inflatables - Key offerings
- SWOT
- 16.11 Klepper Lifestyle GmbH
- Klepper Lifestyle GmbH - Overview
- Klepper Lifestyle GmbH - Product / Service
- Klepper Lifestyle GmbH - Key offerings
- SWOT
- 16.12 Long Haul Folding Kayaks
- Long Haul Folding Kayaks - Overview
- Long Haul Folding Kayaks - Product / Service
- Long Haul Folding Kayaks - Key offerings
- SWOT
- 16.13 NAUTIRAID
- NAUTIRAID - Overview
- NAUTIRAID - Product / Service
- NAUTIRAID - Key offerings
- SWOT
- 16.14 Nova Craft Canoe
- Nova Craft Canoe - Overview
- Nova Craft Canoe - Product / Service
- Nova Craft Canoe - Key offerings
- SWOT
- 16.15 Oru Kayak Inc.
- Oru Kayak Inc. - Overview
- Oru Kayak Inc. - Product / Service
- Oru Kayak Inc. - Key offerings
- SWOT
- 16.16 Pelican International Inc.
- Pelican International Inc. - Overview
- Pelican International Inc. - Product / Service
- Pelican International Inc. - Key offerings
- SWOT
- 16.17 Point 65 Sweden AB
- Point 65 Sweden AB - Overview
- Point 65 Sweden AB - Product / Service
- Point 65 Sweden AB - Key offerings
- SWOT
- 16.18 Tahe Kayaks OU
- Tahe Kayaks OU - Overview
- Tahe Kayaks OU - Product / Service
- Tahe Kayaks OU - Key offerings
- SWOT
17 Appendix
- 17.1 Scope of the report
- 17.2 Inclusions and exclusions checklist
- Inclusions checklist
- Exclusions checklist
- 17.3 Currency conversion rates for US$
- Currency conversion rates for US$
- 17.4 Research methodology
- Research methodology
- 17.5 Data procurement
- Information sources
- 17.6 Data validation
- Data validation
- 17.7 Validation techniques employed for market sizing
- Validation techniques employed for market sizing
- 17.8 Data synthesis
- Data synthesis
- 17.9 360 degree market analysis
- 360 degree market analysis
- 17.10 List of abbreviations
- List of abbreviations

