|
|
市場調査レポート
商品コード
1714131
石油・ガスパイプラインの世界市場 2025-2029年Global Offshore Oil and Gas Pipeline Market 2025-2029 |
||||||

|
|||||||
カスタマイズ可能
|
|||||||


| 石油・ガスパイプラインの世界市場 2025-2029年 |
|
出版日: 2025年04月16日
発行: TechNavio
ページ情報: 英文 238 Pages
納期: 即納可能
|

全表示
- 概要
- 図表
- 目次
石油・ガスパイプライン市場は2024-2029年に 44億5,580万米ドル、予測期間中のCAGRは5.7%で成長すると予測されます。
この調査レポートは、石油・ガスパイプライン市場の全体分析、市場規模・予測、動向、成長促進要因、課題、約25のベンダーを網羅したベンダー分析などを掲載しています。
現在の市場シナリオ、最新動向と促進要因、市場環境全体に関する最新分析を提供しています。市場を牽引しているのは、その他の石油・ガス輸送手段よりも海上パイプラインの方が経済的メリットが大きいこと、探査・生産活動の急増、世界のエネルギー需要の高まりなどです。
| 市場範囲 | |
|---|---|
| 基準年 | 2025年 |
| 終了年 | 2029年 |
| 予測期間 | 2025-2029年 |
| 成長モメンタム | 加速 |
| 前年比2025年 | 5.3% |
| CAGR | 5.7% |
| 増分額 | 44億5,580万米ドル |
本調査は、業界の主要参加者からのインプットを含め、一次情報と二次情報を客観的に組み合わせて実施しました。本レポートには、主要企業の分析に加え、包括的な市場規模データ、地域分析によるセグメント、ベンダー情勢が含まれています。レポートには過去データと予測データがあります。
本調査では、今後数年間の石油・ガスパイプライン市場の成長を促進する主な理由の一つとして、オフショアパイプライン検査における進歩を挙げています。また、洋上石油・ガスパイプラインの技術的進歩や国境を越えた洋上石油・ガスパイプラインの増加は、市場の大きな需要につながります。
目次
第1章 エグゼクティブサマリー
- 市場概要
第2章 Technavio分析
- 価格・ライフサイクル・顧客購入バスケット・採用率・購入基準の分析
- インプットの重要性と差別化の要因
- 混乱の要因
- 促進要因と課題の影響
第3章 市場情勢
- 市場エコシステム
- 市場の特徴
- バリューチェーン分析
第4章 市場規模
- 市場の定義
- 市場セグメント分析
- 市場規模 2024年
- 市場の見通し 2024-2029年
第5章 市場規模実績
- 石油・ガスパイプラインの世界市場 2019-2023年
- セクター別セグメント分析 2019-2023年
- 製品別セグメント分析 2019-2023年
- タイプ別セグメント分析 2019-2023年
- 製品タイプ別セグメント分析 2019-2023年
- 地域別セグメント分析 2019-2023年
- 国別セグメント分析 2019-2023年
第6章 定性分析
- AIの影響:石油・ガスパイプラインの世界市場
第7章 ファイブフォース分析
- ファイブフォースの要約
- 買い手の交渉力
- 供給企業の交渉力
- 新規参入業者の脅威
- 代替品の脅威
- 競争の脅威
- 市況
第8章 市場セグメンテーション:セクター別
- 市場セグメント
- 比較:セクター別
- 上流:市場規模と予測 2024-2029年
- 中流:市場規模と予測 2024-2029年
- 下流:市場規模と予測 2024-2029年
- 市場機会:セクター別
第9章 市場セグメンテーション:製品別
- 市場セグメント
- 比較:製品別
- 油:市場規模と予測 2024-2029年
- ガス:市場規模と予測 2024-2029年
- 精製製品:市場規模と予測 2024-2029年
- 市場機会:製品別
第10章 市場セグメンテーション:タイプ別
- 市場セグメント
- 比較:タイプ別
- 交通路線:市場規模と予測 2024-2029年
- 輸出ライン:市場規模と予測 2024-2029年
- その他:市場規模と予測 2024-2029年
- 市場機会:タイプ別
第11章 市場セグメンテーション:製品タイプ別
- 市場セグメント
- 比較:製品タイプ別
- 24インチ以上:市場規模と予測 2024-2029年
- 24インチ以下:市場規模と予測 2024-2029年
- 市場機会:製品タイプ別
第12章 顧客情勢
- 顧客情勢の概要
第13章 地域別情勢
- 地域別セグメンテーション
- 比較:地域別
- 欧州:市場規模と予測 2024-2029年
- 中東・アフリカ:市場規模と予測 2024-2029年
- アジア太平洋:市場規模と予測 2024-2029年
- 南米:市場規模と予測 2024-2029年
- 北米:市場規模と予測 2024-2029年
- ロシア:市場規模と予測 2024-2029年
- トルコ:市場規模と予測 2024-2029年
- ノルウェー:市場規模と予測 2024-2029年
- サウジアラビア:市場規模と予測 2024-2029年
- 中国:市場規模と予測 2024-2029年
- イタリア:市場規模と予測 2024-2029年
- アラブ首長国連邦:市場規模と予測 2024-2029年
- スペイン:市場規模と予測 2024-2029年
- 日本:市場規模と予測 2024-2029年
- ブラジル:市場規模と予測 2024-2029年
- 市場機会:地域情勢別
第14章 促進要因・課題・機会・抑制要因
- 市場促進要因
- 市場の課題
- 促進要因と課題の影響
- 市場の機会・抑制要因
第15章 競合情勢
- 概要
- 競合情勢
- 混乱の状況
- 業界のリスク
第16章 競合分析
- 企業プロファイル
- 企業ランキング指数
- 企業の市場ポジショニング
- Allseas Group SA
- ArcelorMittal SA
- Atteris Pty. Ltd.
- Fugro NV
- JFE Holdings Inc.
- John Wood Group PLC
- Larsen and Toubro Ltd.
- McDermott International Ltd.
- National Petroleum Construction Co.
- Nippon Steel Corp.
- PAO Severstal
- Saipem S.p.A.
- Salzgitter AG
- Tenaris SA
- TMK
第17章 付録
Exhibits:
- Exhibits1: Executive Summary - Chart on Market Overview
- Exhibits2: Executive Summary - Data Table on Market Overview
- Exhibits3: Executive Summary - Chart on Global Market Characteristics
- Exhibits4: Executive Summary - Chart on Market By Geographical Landscape
- Exhibits5: Executive Summary - Chart on Market Segmentation by Sector
- Exhibits6: Executive Summary - Chart on Market Segmentation by Product
- Exhibits7: Executive Summary - Chart on Market Segmentation by Type
- Exhibits8: Executive Summary - Chart on Market Segmentation by Product Type
- Exhibits9: Executive Summary - Chart on Incremental Growth
- Exhibits10: Executive Summary - Data Table on Incremental Growth
- Exhibits11: Executive Summary - Chart on Company Market Positioning
- Exhibits12: Analysis of price sensitivity, lifecycle, customer purchase basket, adoption rates, and purchase criteria
- Exhibits13: Overview on criticality of inputs and factors of differentiation
- Exhibits14: Overview on factors of disruption
- Exhibits15: Impact of drivers and challenges in 2024 and 2029
- Exhibits16: Parent Market
- Exhibits17: Data Table on - Parent Market
- Exhibits18: Market characteristics analysis
- Exhibits19: Value chain analysis
- Exhibits20: Offerings of companies included in the market definition
- Exhibits21: Market segments
- Exhibits22: Chart on Global - Market size and forecast 2024-2029 ($ million)
- Exhibits23: Data Table on Global - Market size and forecast 2024-2029 ($ million)
- Exhibits24: Chart on Global Market: Year-over-year growth 2024-2029 (%)
- Exhibits25: Data Table on Global Market: Year-over-year growth 2024-2029 (%)
- Exhibits26: Historic Market Size - Data Table on Global Offshore Oil And Gas Pipeline Market 2019 - 2023 ($ million)
- Exhibits27: Historic Market Size - Sector Segment 2019 - 2023 ($ million)
- Exhibits28: Historic Market Size - Product Segment 2019 - 2023 ($ million)
- Exhibits29: Historic Market Size - Type Segment 2019 - 2023 ($ million)
- Exhibits30: Historic Market Size - Product Type Segment 2019 - 2023 ($ million)
- Exhibits31: Historic Market Size - Geography Segment 2019 - 2023 ($ million)
- Exhibits32: Historic Market Size - Country Segment 2019 - 2023 ($ million)
- Exhibits33: Five forces analysis - Comparison between 2024 and 2029
- Exhibits34: Bargaining power of buyers - Impact of key factors 2024 and 2029
- Exhibits35: Bargaining power of suppliers - Impact of key factors in 2024 and 2029
- Exhibits36: Threat of new entrants - Impact of key factors in 2024 and 2029
- Exhibits37: Threat of substitutes - Impact of key factors in 2024 and 2029
- Exhibits38: Threat of rivalry - Impact of key factors in 2024 and 2029
- Exhibits39: Chart on Market condition - Five forces 2024 and 2029
- Exhibits40: Chart on Sector - Market share 2024-2029 (%)
- Exhibits41: Data Table on Sector - Market share 2024-2029 (%)
- Exhibits42: Chart on Comparison by Sector
- Exhibits43: Data Table on Comparison by Sector
- Exhibits44: Chart on Up stream - Market size and forecast 2024-2029 ($ million)
- Exhibits45: Data Table on Up stream - Market size and forecast 2024-2029 ($ million)
- Exhibits46: Chart on Up stream - Year-over-year growth 2024-2029 (%)
- Exhibits47: Data Table on Up stream - Year-over-year growth 2024-2029 (%)
- Exhibits48: Chart on Mid stream - Market size and forecast 2024-2029 ($ million)
- Exhibits49: Data Table on Mid stream - Market size and forecast 2024-2029 ($ million)
- Exhibits50: Chart on Mid stream - Year-over-year growth 2024-2029 (%)
- Exhibits51: Data Table on Mid stream - Year-over-year growth 2024-2029 (%)
- Exhibits52: Chart on Down stream - Market size and forecast 2024-2029 ($ million)
- Exhibits53: Data Table on Down stream - Market size and forecast 2024-2029 ($ million)
- Exhibits54: Chart on Down stream - Year-over-year growth 2024-2029 (%)
- Exhibits55: Data Table on Down stream - Year-over-year growth 2024-2029 (%)
- Exhibits56: Market opportunity by Sector ($ million)
- Exhibits57: Data Table on Market opportunity by Sector ($ million)
- Exhibits58: Chart on Product - Market share 2024-2029 (%)
- Exhibits59: Data Table on Product - Market share 2024-2029 (%)
- Exhibits60: Chart on Comparison by Product
- Exhibits61: Data Table on Comparison by Product
- Exhibits62: Chart on Oil - Market size and forecast 2024-2029 ($ million)
- Exhibits63: Data Table on Oil - Market size and forecast 2024-2029 ($ million)
- Exhibits64: Chart on Oil - Year-over-year growth 2024-2029 (%)
- Exhibits65: Data Table on Oil - Year-over-year growth 2024-2029 (%)
- Exhibits66: Chart on Gas - Market size and forecast 2024-2029 ($ million)
- Exhibits67: Data Table on Gas - Market size and forecast 2024-2029 ($ million)
- Exhibits68: Chart on Gas - Year-over-year growth 2024-2029 (%)
- Exhibits69: Data Table on Gas - Year-over-year growth 2024-2029 (%)
- Exhibits70: Chart on Refined products - Market size and forecast 2024-2029 ($ million)
- Exhibits71: Data Table on Refined products - Market size and forecast 2024-2029 ($ million)
- Exhibits72: Chart on Refined products - Year-over-year growth 2024-2029 (%)
- Exhibits73: Data Table on Refined products - Year-over-year growth 2024-2029 (%)
- Exhibits74: Market opportunity by Product ($ million)
- Exhibits75: Data Table on Market opportunity by Product ($ million)
- Exhibits76: Chart on Type - Market share 2024-2029 (%)
- Exhibits77: Data Table on Type - Market share 2024-2029 (%)
- Exhibits78: Chart on Comparison by Type
- Exhibits79: Data Table on Comparison by Type
- Exhibits80: Chart on Transport lines - Market size and forecast 2024-2029 ($ million)
- Exhibits81: Data Table on Transport lines - Market size and forecast 2024-2029 ($ million)
- Exhibits82: Chart on Transport lines - Year-over-year growth 2024-2029 (%)
- Exhibits83: Data Table on Transport lines - Year-over-year growth 2024-2029 (%)
- Exhibits84: Chart on Export lines - Market size and forecast 2024-2029 ($ million)
- Exhibits85: Data Table on Export lines - Market size and forecast 2024-2029 ($ million)
- Exhibits86: Chart on Export lines - Year-over-year growth 2024-2029 (%)
- Exhibits87: Data Table on Export lines - Year-over-year growth 2024-2029 (%)
- Exhibits88: Chart on Others - Market size and forecast 2024-2029 ($ million)
- Exhibits89: Data Table on Others - Market size and forecast 2024-2029 ($ million)
- Exhibits90: Chart on Others - Year-over-year growth 2024-2029 (%)
- Exhibits91: Data Table on Others - Year-over-year growth 2024-2029 (%)
- Exhibits92: Market opportunity by Type ($ million)
- Exhibits93: Data Table on Market opportunity by Type ($ million)
- Exhibits94: Chart on Product Type - Market share 2024-2029 (%)
- Exhibits95: Data Table on Product Type - Market share 2024-2029 (%)
- Exhibits96: Chart on Comparison by Product Type
- Exhibits97: Data Table on Comparison by Product Type
- Exhibits98: Chart on Greater than 24 inches - Market size and forecast 2024-2029 ($ million)
- Exhibits99: Data Table on Greater than 24 inches - Market size and forecast 2024-2029 ($ million)
- Exhibits100: Chart on Greater than 24 inches - Year-over-year growth 2024-2029 (%)
- Exhibits101: Data Table on Greater than 24 inches - Year-over-year growth 2024-2029 (%)
- Exhibits102: Chart on Below 24 inches - Market size and forecast 2024-2029 ($ million)
- Exhibits103: Data Table on Below 24 inches - Market size and forecast 2024-2029 ($ million)
- Exhibits104: Chart on Below 24 inches - Year-over-year growth 2024-2029 (%)
- Exhibits105: Data Table on Below 24 inches - Year-over-year growth 2024-2029 (%)
- Exhibits106: Market opportunity by Product Type ($ million)
- Exhibits107: Data Table on Market opportunity by Product Type ($ million)
- Exhibits108: Analysis of price sensitivity, lifecycle, customer purchase basket, adoption rates, and purchase criteria
- Exhibits109: Chart on Market share By Geographical Landscape 2024-2029 (%)
- Exhibits110: Data Table on Market share By Geographical Landscape 2024-2029 (%)
- Exhibits111: Chart on Geographic comparison
- Exhibits112: Data Table on Geographic comparison
- Exhibits113: Chart on Europe - Market size and forecast 2024-2029 ($ million)
- Exhibits114: Data Table on Europe - Market size and forecast 2024-2029 ($ million)
- Exhibits115: Chart on Europe - Year-over-year growth 2024-2029 (%)
- Exhibits116: Data Table on Europe - Year-over-year growth 2024-2029 (%)
- Exhibits117: Chart on Middle East and Africa - Market size and forecast 2024-2029 ($ million)
- Exhibits118: Data Table on Middle East and Africa - Market size and forecast 2024-2029 ($ million)
- Exhibits119: Chart on Middle East and Africa - Year-over-year growth 2024-2029 (%)
- Exhibits120: Data Table on Middle East and Africa - Year-over-year growth 2024-2029 (%)
- Exhibits121: Chart on APAC - Market size and forecast 2024-2029 ($ million)
- Exhibits122: Data Table on APAC - Market size and forecast 2024-2029 ($ million)
- Exhibits123: Chart on APAC - Year-over-year growth 2024-2029 (%)
- Exhibits124: Data Table on APAC - Year-over-year growth 2024-2029 (%)
- Exhibits125: Chart on South America - Market size and forecast 2024-2029 ($ million)
- Exhibits126: Data Table on South America - Market size and forecast 2024-2029 ($ million)
- Exhibits127: Chart on South America - Year-over-year growth 2024-2029 (%)
- Exhibits128: Data Table on South America - Year-over-year growth 2024-2029 (%)
- Exhibits129: Chart on North America - Market size and forecast 2024-2029 ($ million)
- Exhibits130: Data Table on North America - Market size and forecast 2024-2029 ($ million)
- Exhibits131: Chart on North America - Year-over-year growth 2024-2029 (%)
- Exhibits132: Data Table on North America - Year-over-year growth 2024-2029 (%)
- Exhibits133: Chart on Russia - Market size and forecast 2024-2029 ($ million)
- Exhibits134: Data Table on Russia - Market size and forecast 2024-2029 ($ million)
- Exhibits135: Chart on Russia - Year-over-year growth 2024-2029 (%)
- Exhibits136: Data Table on Russia - Year-over-year growth 2024-2029 (%)
- Exhibits137: Chart on Turkey - Market size and forecast 2024-2029 ($ million)
- Exhibits138: Data Table on Turkey - Market size and forecast 2024-2029 ($ million)
- Exhibits139: Chart on Turkey - Year-over-year growth 2024-2029 (%)
- Exhibits140: Data Table on Turkey - Year-over-year growth 2024-2029 (%)
- Exhibits141: Chart on Norway - Market size and forecast 2024-2029 ($ million)
- Exhibits142: Data Table on Norway - Market size and forecast 2024-2029 ($ million)
- Exhibits143: Chart on Norway - Year-over-year growth 2024-2029 (%)
- Exhibits144: Data Table on Norway - Year-over-year growth 2024-2029 (%)
- Exhibits145: Chart on Saudi Arabia - Market size and forecast 2024-2029 ($ million)
- Exhibits146: Data Table on Saudi Arabia - Market size and forecast 2024-2029 ($ million)
- Exhibits147: Chart on Saudi Arabia - Year-over-year growth 2024-2029 (%)
- Exhibits148: Data Table on Saudi Arabia - Year-over-year growth 2024-2029 (%)
- Exhibits149: Chart on China - Market size and forecast 2024-2029 ($ million)
- Exhibits150: Data Table on China - Market size and forecast 2024-2029 ($ million)
- Exhibits151: Chart on China - Year-over-year growth 2024-2029 (%)
- Exhibits152: Data Table on China - Year-over-year growth 2024-2029 (%)
- Exhibits153: Chart on Italy - Market size and forecast 2024-2029 ($ million)
- Exhibits154: Data Table on Italy - Market size and forecast 2024-2029 ($ million)
- Exhibits155: Chart on Italy - Year-over-year growth 2024-2029 (%)
- Exhibits156: Data Table on Italy - Year-over-year growth 2024-2029 (%)
- Exhibits157: Chart on UAE - Market size and forecast 2024-2029 ($ million)
- Exhibits158: Data Table on UAE - Market size and forecast 2024-2029 ($ million)
- Exhibits159: Chart on UAE - Year-over-year growth 2024-2029 (%)
- Exhibits160: Data Table on UAE - Year-over-year growth 2024-2029 (%)
- Exhibits161: Chart on Spain - Market size and forecast 2024-2029 ($ million)
- Exhibits162: Data Table on Spain - Market size and forecast 2024-2029 ($ million)
- Exhibits163: Chart on Spain - Year-over-year growth 2024-2029 (%)
- Exhibits164: Data Table on Spain - Year-over-year growth 2024-2029 (%)
- Exhibits165: Chart on Japan - Market size and forecast 2024-2029 ($ million)
- Exhibits166: Data Table on Japan - Market size and forecast 2024-2029 ($ million)
- Exhibits167: Chart on Japan - Year-over-year growth 2024-2029 (%)
- Exhibits168: Data Table on Japan - Year-over-year growth 2024-2029 (%)
- Exhibits169: Chart on Brazil - Market size and forecast 2024-2029 ($ million)
- Exhibits170: Data Table on Brazil - Market size and forecast 2024-2029 ($ million)
- Exhibits171: Chart on Brazil - Year-over-year growth 2024-2029 (%)
- Exhibits172: Data Table on Brazil - Year-over-year growth 2024-2029 (%)
- Exhibits173: Market opportunity By Geographical Landscape ($ million)
- Exhibits174: Data Tables on Market opportunity By Geographical Landscape ($ million)
- Exhibits175: Impact of drivers and challenges in 2024 and 2029
- Exhibits176: Overview on criticality of inputs and factors of differentiation
- Exhibits177: Overview on factors of disruption
- Exhibits178: Impact of key risks on business
- Exhibits179: Companies covered
- Exhibits180: Company ranking index
- Exhibits181: Matrix on companies position and classification
- Exhibits182: Allseas Group SA - Overview
- Exhibits183: Allseas Group SA - Product / Service
- Exhibits184: Allseas Group SA - Key offerings
- Exhibits185: SWOT
- Exhibits186: ArcelorMittal SA - Overview
- Exhibits187: ArcelorMittal SA - Business segments
- Exhibits188: ArcelorMittal SA - Key news
- Exhibits189: ArcelorMittal SA - Key offerings
- Exhibits190: ArcelorMittal SA - Segment focus
- Exhibits191: SWOT
- Exhibits192: Atteris Pty. Ltd. - Overview
- Exhibits193: Atteris Pty. Ltd. - Product / Service
- Exhibits194: Atteris Pty. Ltd. - Key offerings
- Exhibits195: SWOT
- Exhibits196: Fugro NV - Overview
- Exhibits197: Fugro NV - Business segments
- Exhibits198: Fugro NV - Key offerings
- Exhibits199: Fugro NV - Segment focus
- Exhibits200: SWOT
- Exhibits201: JFE Holdings Inc. - Overview
- Exhibits202: JFE Holdings Inc. - Business segments
- Exhibits203: JFE Holdings Inc. - Key news
- Exhibits204: JFE Holdings Inc. - Key offerings
- Exhibits205: JFE Holdings Inc. - Segment focus
- Exhibits206: SWOT
- Exhibits207: John Wood Group PLC - Overview
- Exhibits208: John Wood Group PLC - Business segments
- Exhibits209: John Wood Group PLC - Key offerings
- Exhibits210: John Wood Group PLC - Segment focus
- Exhibits211: SWOT
- Exhibits212: Larsen and Toubro Ltd. - Overview
- Exhibits213: Larsen and Toubro Ltd. - Business segments
- Exhibits214: Larsen and Toubro Ltd. - Key news
- Exhibits215: Larsen and Toubro Ltd. - Key offerings
- Exhibits216: Larsen and Toubro Ltd. - Segment focus
- Exhibits217: SWOT
- Exhibits218: McDermott International Ltd. - Overview
- Exhibits219: McDermott International Ltd. - Product / Service
- Exhibits220: McDermott International Ltd. - Key offerings
- Exhibits221: SWOT
- Exhibits222: National Petroleum Construction Co. - Overview
- Exhibits223: National Petroleum Construction Co. - Product / Service
- Exhibits224: National Petroleum Construction Co. - Key offerings
- Exhibits225: SWOT
- Exhibits226: Nippon Steel Corp. - Overview
- Exhibits227: Nippon Steel Corp. - Business segments
- Exhibits228: Nippon Steel Corp. - Key news
- Exhibits229: Nippon Steel Corp. - Key offerings
- Exhibits230: Nippon Steel Corp. - Segment focus
- Exhibits231: SWOT
- Exhibits232: PAO Severstal - Overview
- Exhibits233: PAO Severstal - Business segments
- Exhibits234: PAO Severstal - Key offerings
- Exhibits235: PAO Severstal - Segment focus
- Exhibits236: SWOT
- Exhibits237: Saipem S.p.A. - Overview
- Exhibits238: Saipem S.p.A. - Business segments
- Exhibits239: Saipem S.p.A. - Key offerings
- Exhibits240: Saipem S.p.A. - Segment focus
- Exhibits241: SWOT
- Exhibits242: Salzgitter AG - Overview
- Exhibits243: Salzgitter AG - Business segments
- Exhibits244: Salzgitter AG - Key offerings
- Exhibits245: Salzgitter AG - Segment focus
- Exhibits246: SWOT
- Exhibits247: Tenaris SA - Overview
- Exhibits248: Tenaris SA - Product / Service
- Exhibits249: Tenaris SA - Key news
- Exhibits250: Tenaris SA - Key offerings
- Exhibits251: SWOT
- Exhibits252: TMK - Overview
- Exhibits253: TMK - Product / Service
- Exhibits254: TMK - Key offerings
- Exhibits255: SWOT
- Exhibits256: Inclusions checklist
- Exhibits257: Exclusions checklist
- Exhibits258: Currency conversion rates for US$
- Exhibits259: Research methodology
- Exhibits260: Information sources
- Exhibits261: Data validation
- Exhibits262: Validation techniques employed for market sizing
- Exhibits263: Data synthesis
- Exhibits264: 360 degree market analysis
- Exhibits265: List of abbreviations
The offshore oil and gas pipeline market is forecasted to grow by USD 4455.8 mn during 2024-2029, accelerating at a CAGR of 5.7% during the forecast period. The report on the offshore oil and gas pipeline market provides a holistic analysis, market size and forecast, trends, growth drivers, and challenges, as well as vendor analysis covering around 25 vendors.
The report offers an up-to-date analysis regarding the current market scenario, the latest trends and drivers, and the overall market environment. The market is driven by economic benefits of offshore pipelines than other oil and gas transportation modes, surge in e and p activities, and rising global energy demand.
| Market Scope | |
|---|---|
| Base Year | 2025 |
| End Year | 2029 |
| Series Year | 2025-2029 |
| Growth Momentum | Accelerate |
| YOY 2025 | 5.3% |
| CAGR | 5.7% |
| Incremental Value | $4455.8 mn |
The study was conducted using an objective combination of primary and secondary information including inputs from key participants in the industry. The report contains a comprehensive market size data, segment with regional analysis and vendor landscape in addition to an analysis of the key companies. Reports have historic and forecast data.
Technavio's offshore oil and gas pipeline market is segmented as below:
By Sector
- Up stream
- Mid stream
- Down stream
By Product
- Oil
- Gas
- Refined products
By Type
- Transport lines
- Export lines
- Others
By Product Type
- Below 24 inches
- Greater than 24 inches
By Geographical Landscape
- Europe
- Middle East and Africa
- APAC
- South America
- North America
This study identifies the advents in offshore pipeline inspection as one of the prime reasons driving the offshore oil and gas pipeline market growth during the next few years. Also, technological advents in offshore oil and gas pipelines and increasing number of cross-border offshore oil and gas pipelines will lead to sizable demand in the market.
The report on the offshore oil and gas pipeline market covers the following areas:
- Offshore Oil And Gas Pipeline Market sizing
- Offshore Oil And Gas Pipeline Market forecast
- Offshore Oil And Gas Pipeline Market industry analysis
The robust vendor analysis is designed to help clients improve their market position, and in line with this, this report provides a detailed analysis of several leading offshore oil and gas pipeline market vendors that include Allseas Group SA, ArcelorMittal SA, Atteris Pty. Ltd., Fugro NV, JFE Holdings Inc., John Wood Group PLC, Larsen and Toubro Ltd., McDermott International Ltd., National Petroleum Construction Co., Nippon Steel Corp., PAO Severstal, Saipem S.p.A., Salzgitter AG, Sapura Energy Berhad, Shengli Oil and Gas Pipe Holdings Ltd., Subsea 7 SA, TechnipFMC plc, Tenaris SA, TMK, and United Metallurgical Co.. Also, the offshore oil and gas pipeline market analysis report includes information on upcoming trends and challenges that will influence market growth. This is to help companies strategize and leverage all forthcoming growth opportunities.
The publisher presents a detailed picture of the market by the way of study, synthesis, and summation of data from multiple sources by an analysis of key parameters such as profit, pricing, competition, and promotions. It presents various market facets by identifying the key industry influencers. The data presented is comprehensive, reliable, and a result of extensive primary and secondary research. The market research reports provide a complete competitive landscape and an in-depth vendor selection methodology and analysis using qualitative and quantitative research to forecast accurate market growth.
Table of Contents
1 Executive Summary
- 1.1 Market overview
- Executive Summary - Chart on Market Overview
- Executive Summary - Data Table on Market Overview
- Executive Summary - Chart on Global Market Characteristics
- Executive Summary - Chart on Market By Geographical Landscape
- Executive Summary - Chart on Market Segmentation by Sector
- Executive Summary - Chart on Market Segmentation by Product
- Executive Summary - Chart on Market Segmentation by Type
- Executive Summary - Chart on Market Segmentation by Product Type
- Executive Summary - Chart on Incremental Growth
- Executive Summary - Data Table on Incremental Growth
- Executive Summary - Chart on Company Market Positioning
2 Technavio Analysis
- 2.1 Analysis of price sensitivity, lifecycle, customer purchase basket, adoption rates, and purchase criteria
- Analysis of price sensitivity, lifecycle, customer purchase basket, adoption rates, and purchase criteria
- 2.2 Criticality of inputs and Factors of differentiation
- Overview on criticality of inputs and factors of differentiation
- 2.3 Factors of disruption
- Overview on factors of disruption
- 2.4 Impact of drivers and challenges
- Impact of drivers and challenges in 2024 and 2029
3 Market Landscape
- 3.1 Market ecosystem
- Parent Market
- Data Table on - Parent Market
- 3.2 Market characteristics
- Market characteristics analysis
- 3.3 Value chain analysis
- Value chain analysis
4 Market Sizing
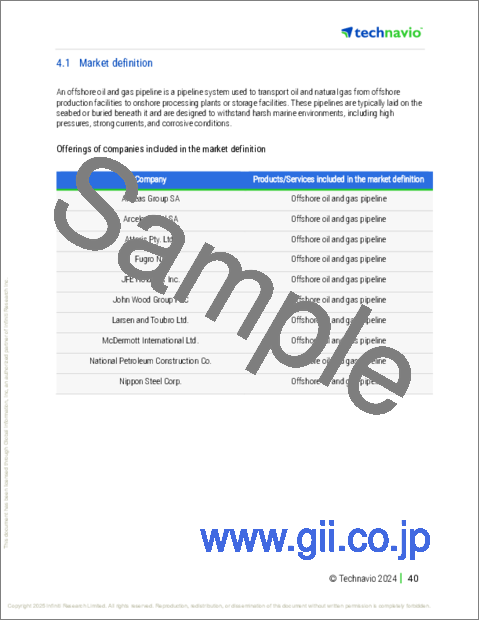
- 4.1 Market definition
- Offerings of companies included in the market definition
- 4.2 Market segment analysis
- Market segments
- 4.3 Market size 2024
- 4.4 Market outlook: Forecast for 2024-2029
- Chart on Global - Market size and forecast 2024-2029 ($ million)
- Data Table on Global - Market size and forecast 2024-2029 ($ million)
- Chart on Global Market: Year-over-year growth 2024-2029 (%)
- Data Table on Global Market: Year-over-year growth 2024-2029 (%)
5 Historic Market Size
- 5.1 Global Offshore Oil And Gas Pipeline Market 2019 - 2023
- Historic Market Size - Data Table on Global Offshore Oil And Gas Pipeline Market 2019 - 2023 ($ million)
- 5.2 Sector segment analysis 2019 - 2023
- Historic Market Size - Sector Segment 2019 - 2023 ($ million)
- 5.3 Product segment analysis 2019 - 2023
- Historic Market Size - Product Segment 2019 - 2023 ($ million)
- 5.4 Type segment analysis 2019 - 2023
- Historic Market Size - Type Segment 2019 - 2023 ($ million)
- 5.5 Product Type segment analysis 2019 - 2023
- Historic Market Size - Product Type Segment 2019 - 2023 ($ million)
- 5.6 Geography segment analysis 2019 - 2023
- Historic Market Size - Geography Segment 2019 - 2023 ($ million)
- 5.7 Country segment analysis 2019 - 2023
- Historic Market Size - Country Segment 2019 - 2023 ($ million)
6 Qualitative Analysis
- 6.1 Impact of AI on Global Offshore Oil and Gas Pipeline Market
7 Five Forces Analysis
- 7.1 Five forces summary
- Five forces analysis - Comparison between 2024 and 2029
- 7.2 Bargaining power of buyers
- Bargaining power of buyers - Impact of key factors 2024 and 2029
- 7.3 Bargaining power of suppliers
- Bargaining power of suppliers - Impact of key factors in 2024 and 2029
- 7.4 Threat of new entrants
- Threat of new entrants - Impact of key factors in 2024 and 2029
- 7.5 Threat of substitutes
- Threat of substitutes - Impact of key factors in 2024 and 2029
- 7.6 Threat of rivalry
- Threat of rivalry - Impact of key factors in 2024 and 2029
- 7.7 Market condition
- Chart on Market condition - Five forces 2024 and 2029
8 Market Segmentation by Sector
- 8.1 Market segments
- Chart on Sector - Market share 2024-2029 (%)
- Data Table on Sector - Market share 2024-2029 (%)
- 8.2 Comparison by Sector
- Chart on Comparison by Sector
- Data Table on Comparison by Sector
- 8.3 Up stream - Market size and forecast 2024-2029
- Chart on Up stream - Market size and forecast 2024-2029 ($ million)
- Data Table on Up stream - Market size and forecast 2024-2029 ($ million)
- Chart on Up stream - Year-over-year growth 2024-2029 (%)
- Data Table on Up stream - Year-over-year growth 2024-2029 (%)
- 8.4 Mid stream - Market size and forecast 2024-2029
- Chart on Mid stream - Market size and forecast 2024-2029 ($ million)
- Data Table on Mid stream - Market size and forecast 2024-2029 ($ million)
- Chart on Mid stream - Year-over-year growth 2024-2029 (%)
- Data Table on Mid stream - Year-over-year growth 2024-2029 (%)
- 8.5 Down stream - Market size and forecast 2024-2029
- Chart on Down stream - Market size and forecast 2024-2029 ($ million)
- Data Table on Down stream - Market size and forecast 2024-2029 ($ million)
- Chart on Down stream - Year-over-year growth 2024-2029 (%)
- Data Table on Down stream - Year-over-year growth 2024-2029 (%)
- 8.6 Market opportunity by Sector
- Market opportunity by Sector ($ million)
- Data Table on Market opportunity by Sector ($ million)
9 Market Segmentation by Product
- 9.1 Market segments
- Chart on Product - Market share 2024-2029 (%)
- Data Table on Product - Market share 2024-2029 (%)
- 9.2 Comparison by Product
- Chart on Comparison by Product
- Data Table on Comparison by Product
- 9.3 Oil - Market size and forecast 2024-2029
- Chart on Oil - Market size and forecast 2024-2029 ($ million)
- Data Table on Oil - Market size and forecast 2024-2029 ($ million)
- Chart on Oil - Year-over-year growth 2024-2029 (%)
- Data Table on Oil - Year-over-year growth 2024-2029 (%)
- 9.4 Gas - Market size and forecast 2024-2029
- Chart on Gas - Market size and forecast 2024-2029 ($ million)
- Data Table on Gas - Market size and forecast 2024-2029 ($ million)
- Chart on Gas - Year-over-year growth 2024-2029 (%)
- Data Table on Gas - Year-over-year growth 2024-2029 (%)
- 9.5 Refined products - Market size and forecast 2024-2029
- Chart on Refined products - Market size and forecast 2024-2029 ($ million)
- Data Table on Refined products - Market size and forecast 2024-2029 ($ million)
- Chart on Refined products - Year-over-year growth 2024-2029 (%)
- Data Table on Refined products - Year-over-year growth 2024-2029 (%)
- 9.6 Market opportunity by Product
- Market opportunity by Product ($ million)
- Data Table on Market opportunity by Product ($ million)
10 Market Segmentation by Type
- 10.1 Market segments
- Chart on Type - Market share 2024-2029 (%)
- Data Table on Type - Market share 2024-2029 (%)
- 10.2 Comparison by Type
- Chart on Comparison by Type
- Data Table on Comparison by Type
- 10.3 Transport lines - Market size and forecast 2024-2029
- Chart on Transport lines - Market size and forecast 2024-2029 ($ million)
- Data Table on Transport lines - Market size and forecast 2024-2029 ($ million)
- Chart on Transport lines - Year-over-year growth 2024-2029 (%)
- Data Table on Transport lines - Year-over-year growth 2024-2029 (%)
- 10.4 Export lines - Market size and forecast 2024-2029
- Chart on Export lines - Market size and forecast 2024-2029 ($ million)
- Data Table on Export lines - Market size and forecast 2024-2029 ($ million)
- Chart on Export lines - Year-over-year growth 2024-2029 (%)
- Data Table on Export lines - Year-over-year growth 2024-2029 (%)
- 10.5 Others - Market size and forecast 2024-2029
- Chart on Others - Market size and forecast 2024-2029 ($ million)
- Data Table on Others - Market size and forecast 2024-2029 ($ million)
- Chart on Others - Year-over-year growth 2024-2029 (%)
- Data Table on Others - Year-over-year growth 2024-2029 (%)
- 10.6 Market opportunity by Type
- Market opportunity by Type ($ million)
- Data Table on Market opportunity by Type ($ million)
11 Market Segmentation by Product Type
- 11.1 Market segments
- Chart on Product Type - Market share 2024-2029 (%)
- Data Table on Product Type - Market share 2024-2029 (%)
- 11.2 Comparison by Product Type
- Chart on Comparison by Product Type
- Data Table on Comparison by Product Type
- 11.3 Greater than 24 inches - Market size and forecast 2024-2029
- Chart on Greater than 24 inches - Market size and forecast 2024-2029 ($ million)
- Data Table on Greater than 24 inches - Market size and forecast 2024-2029 ($ million)
- Chart on Greater than 24 inches - Year-over-year growth 2024-2029 (%)
- Data Table on Greater than 24 inches - Year-over-year growth 2024-2029 (%)
- 11.4 Below 24 inches - Market size and forecast 2024-2029
- Chart on Below 24 inches - Market size and forecast 2024-2029 ($ million)
- Data Table on Below 24 inches - Market size and forecast 2024-2029 ($ million)
- Chart on Below 24 inches - Year-over-year growth 2024-2029 (%)
- Data Table on Below 24 inches - Year-over-year growth 2024-2029 (%)
- 11.5 Market opportunity by Product Type
- Market opportunity by Product Type ($ million)
- Data Table on Market opportunity by Product Type ($ million)
12 Customer Landscape
- 12.1 Customer landscape overview
- Analysis of price sensitivity, lifecycle, customer purchase basket, adoption rates, and purchase criteria
13 Geographic Landscape
- 13.1 Geographic segmentation
- Chart on Market share By Geographical Landscape 2024-2029 (%)
- Data Table on Market share By Geographical Landscape 2024-2029 (%)
- 13.2 Geographic comparison
- Chart on Geographic comparison
- Data Table on Geographic comparison
- 13.3 Europe - Market size and forecast 2024-2029
- Chart on Europe - Market size and forecast 2024-2029 ($ million)
- Data Table on Europe - Market size and forecast 2024-2029 ($ million)
- Chart on Europe - Year-over-year growth 2024-2029 (%)
- Data Table on Europe - Year-over-year growth 2024-2029 (%)
- 13.4 Middle East and Africa - Market size and forecast 2024-2029
- Chart on Middle East and Africa - Market size and forecast 2024-2029 ($ million)
- Data Table on Middle East and Africa - Market size and forecast 2024-2029 ($ million)
- Chart on Middle East and Africa - Year-over-year growth 2024-2029 (%)
- Data Table on Middle East and Africa - Year-over-year growth 2024-2029 (%)
- 13.5 APAC - Market size and forecast 2024-2029
- Chart on APAC - Market size and forecast 2024-2029 ($ million)
- Data Table on APAC - Market size and forecast 2024-2029 ($ million)
- Chart on APAC - Year-over-year growth 2024-2029 (%)
- Data Table on APAC - Year-over-year growth 2024-2029 (%)
- 13.6 South America - Market size and forecast 2024-2029
- Chart on South America - Market size and forecast 2024-2029 ($ million)
- Data Table on South America - Market size and forecast 2024-2029 ($ million)
- Chart on South America - Year-over-year growth 2024-2029 (%)
- Data Table on South America - Year-over-year growth 2024-2029 (%)
- 13.7 North America - Market size and forecast 2024-2029
- Chart on North America - Market size and forecast 2024-2029 ($ million)
- Data Table on North America - Market size and forecast 2024-2029 ($ million)
- Chart on North America - Year-over-year growth 2024-2029 (%)
- Data Table on North America - Year-over-year growth 2024-2029 (%)
- 13.8 Russia - Market size and forecast 2024-2029
- Chart on Russia - Market size and forecast 2024-2029 ($ million)
- Data Table on Russia - Market size and forecast 2024-2029 ($ million)
- Chart on Russia - Year-over-year growth 2024-2029 (%)
- Data Table on Russia - Year-over-year growth 2024-2029 (%)
- 13.9 Turkey - Market size and forecast 2024-2029
- Chart on Turkey - Market size and forecast 2024-2029 ($ million)
- Data Table on Turkey - Market size and forecast 2024-2029 ($ million)
- Chart on Turkey - Year-over-year growth 2024-2029 (%)
- Data Table on Turkey - Year-over-year growth 2024-2029 (%)
- 13.10 Norway - Market size and forecast 2024-2029
- Chart on Norway - Market size and forecast 2024-2029 ($ million)
- Data Table on Norway - Market size and forecast 2024-2029 ($ million)
- Chart on Norway - Year-over-year growth 2024-2029 (%)
- Data Table on Norway - Year-over-year growth 2024-2029 (%)
- 13.11 Saudi Arabia - Market size and forecast 2024-2029
- Chart on Saudi Arabia - Market size and forecast 2024-2029 ($ million)
- Data Table on Saudi Arabia - Market size and forecast 2024-2029 ($ million)
- Chart on Saudi Arabia - Year-over-year growth 2024-2029 (%)
- Data Table on Saudi Arabia - Year-over-year growth 2024-2029 (%)
- 13.12 China - Market size and forecast 2024-2029
- Chart on China - Market size and forecast 2024-2029 ($ million)
- Data Table on China - Market size and forecast 2024-2029 ($ million)
- Chart on China - Year-over-year growth 2024-2029 (%)
- Data Table on China - Year-over-year growth 2024-2029 (%)
- 13.13 Italy - Market size and forecast 2024-2029
- Chart on Italy - Market size and forecast 2024-2029 ($ million)
- Data Table on Italy - Market size and forecast 2024-2029 ($ million)
- Chart on Italy - Year-over-year growth 2024-2029 (%)
- Data Table on Italy - Year-over-year growth 2024-2029 (%)
- 13.14 UAE - Market size and forecast 2024-2029
- Chart on UAE - Market size and forecast 2024-2029 ($ million)
- Data Table on UAE - Market size and forecast 2024-2029 ($ million)
- Chart on UAE - Year-over-year growth 2024-2029 (%)
- Data Table on UAE - Year-over-year growth 2024-2029 (%)
- 13.15 Spain - Market size and forecast 2024-2029
- Chart on Spain - Market size and forecast 2024-2029 ($ million)
- Data Table on Spain - Market size and forecast 2024-2029 ($ million)
- Chart on Spain - Year-over-year growth 2024-2029 (%)
- Data Table on Spain - Year-over-year growth 2024-2029 (%)
- 13.16 Japan - Market size and forecast 2024-2029
- Chart on Japan - Market size and forecast 2024-2029 ($ million)
- Data Table on Japan - Market size and forecast 2024-2029 ($ million)
- Chart on Japan - Year-over-year growth 2024-2029 (%)
- Data Table on Japan - Year-over-year growth 2024-2029 (%)
- 13.17 Brazil - Market size and forecast 2024-2029
- Chart on Brazil - Market size and forecast 2024-2029 ($ million)
- Data Table on Brazil - Market size and forecast 2024-2029 ($ million)
- Chart on Brazil - Year-over-year growth 2024-2029 (%)
- Data Table on Brazil - Year-over-year growth 2024-2029 (%)
- 13.18 Market opportunity By Geographical Landscape
- Market opportunity By Geographical Landscape ($ million)
- Data Tables on Market opportunity By Geographical Landscape ($ million)
14 Drivers, Challenges, and Opportunity/Restraints
- 14.1 Market drivers
- 14.2 Market challenges
- 14.3 Impact of drivers and challenges
- Impact of drivers and challenges in 2024 and 2029
- 14.4 Market opportunities/restraints
15 Competitive Landscape
- 15.1 Overview
- 15.2 Competitive Landscape
- Overview on criticality of inputs and factors of differentiation
- 15.3 Landscape disruption
- Overview on factors of disruption
- 15.4 Industry risks
- Impact of key risks on business
16 Competitive Analysis
- 16.1 Companies profiled
- Companies covered
- 16.2 Company ranking index
- Company ranking index
- 16.3 Market positioning of companies
- Matrix on companies position and classification
- 16.4 Allseas Group SA
- Allseas Group SA - Overview
- Allseas Group SA - Product / Service
- Allseas Group SA - Key offerings
- SWOT
- 16.5 ArcelorMittal SA
- ArcelorMittal SA - Overview
- ArcelorMittal SA - Business segments
- ArcelorMittal SA - Key news
- ArcelorMittal SA - Key offerings
- ArcelorMittal SA - Segment focus
- SWOT
- 16.6 Atteris Pty. Ltd.
- Atteris Pty. Ltd. - Overview
- Atteris Pty. Ltd. - Product / Service
- Atteris Pty. Ltd. - Key offerings
- SWOT
- 16.7 Fugro NV
- Fugro NV - Overview
- Fugro NV - Business segments
- Fugro NV - Key offerings
- Fugro NV - Segment focus
- SWOT
- 16.8 JFE Holdings Inc.
- JFE Holdings Inc. - Overview
- JFE Holdings Inc. - Business segments
- JFE Holdings Inc. - Key news
- JFE Holdings Inc. - Key offerings
- JFE Holdings Inc. - Segment focus
- SWOT
- 16.9 John Wood Group PLC
- John Wood Group PLC - Overview
- John Wood Group PLC - Business segments
- John Wood Group PLC - Key offerings
- John Wood Group PLC - Segment focus
- SWOT
- 16.10 Larsen and Toubro Ltd.
- Larsen and Toubro Ltd. - Overview
- Larsen and Toubro Ltd. - Business segments
- Larsen and Toubro Ltd. - Key news
- Larsen and Toubro Ltd. - Key offerings
- Larsen and Toubro Ltd. - Segment focus
- SWOT
- 16.11 McDermott International Ltd.
- McDermott International Ltd. - Overview
- McDermott International Ltd. - Product / Service
- McDermott International Ltd. - Key offerings
- SWOT
- 16.12 National Petroleum Construction Co.
- National Petroleum Construction Co. - Overview
- National Petroleum Construction Co. - Product / Service
- National Petroleum Construction Co. - Key offerings
- SWOT
- 16.13 Nippon Steel Corp.
- Nippon Steel Corp. - Overview
- Nippon Steel Corp. - Business segments
- Nippon Steel Corp. - Key news
- Nippon Steel Corp. - Key offerings
- Nippon Steel Corp. - Segment focus
- SWOT
- 16.14 PAO Severstal
- PAO Severstal - Overview
- PAO Severstal - Business segments
- PAO Severstal - Key offerings
- PAO Severstal - Segment focus
- SWOT
- 16.15 Saipem S.p.A.
- Saipem S.p.A. - Overview
- Saipem S.p.A. - Business segments
- Saipem S.p.A. - Key offerings
- Saipem S.p.A. - Segment focus
- SWOT
- 16.16 Salzgitter AG
- Salzgitter AG - Overview
- Salzgitter AG - Business segments
- Salzgitter AG - Key offerings
- Salzgitter AG - Segment focus
- SWOT
- 16.17 Tenaris SA
- Tenaris SA - Overview
- Tenaris SA - Product / Service
- Tenaris SA - Key news
- Tenaris SA - Key offerings
- SWOT
- 16.18 TMK
- TMK - Overview
- TMK - Product / Service
- TMK - Key offerings
- SWOT
17 Appendix
- 17.1 Scope of the report
- 17.2 Inclusions and exclusions checklist
- Inclusions checklist
- Exclusions checklist
- 17.3 Currency conversion rates for US$
- Currency conversion rates for US$
- 17.4 Research methodology
- Research methodology
- 17.5 Data procurement
- Information sources
- 17.6 Data validation
- Data validation
- 17.7 Validation techniques employed for market sizing
- Validation techniques employed for market sizing
- 17.8 Data synthesis
- Data synthesis
- 17.9 360 degree market analysis
- 360 degree market analysis
- 17.10 List of abbreviations
- List of abbreviations

