|
|
市場調査レポート
商品コード
1502387
産業用高効率微粒子空気(HEPA)フィルターの世界市場 2024-2028Global industrial high-efficiency particulate air (HEPA) filters market 2024-2028 |
||||||
|
|||||||
カスタマイズ可能
|
|||||||


| 産業用高効率微粒子空気(HEPA)フィルターの世界市場 2024-2028 |
|
出版日: 2024年05月20日
発行: TechNavio
ページ情報: 英文 173 Pages
納期: 即納可能
|

全表示
- 概要
- 図表
- 目次
産業用高効率微粒子空気(HEPA)フィルター市場2024-2028
Technavio社は、産業用高効率微粒子空気(HEPA)フィルター市場をモニターしており、2023年から2028年にかけて6億9,780万米ドル、予測期間中のCAGRは5.85%で成長すると予測しています。当レポートでは、産業用高効率微粒子空気(HEPA)フィルター市場の全体的な分析、市場規模・予測、動向、成長促進要因、課題、約25のベンダーを網羅したベンダー分析などを掲載しています。
現在の市場シナリオ、最新動向と促進要因、市場環境全体に関する最新分析を提供しています。市場を牽引するのは、分散型発電基盤の成長、産業界におけるプロセスおよび環境安全対策の採用ニーズの高まり、産業界全体におけるクリーンルームアプリケーションの採用増加などです。
| 市場範囲 | |
|---|---|
| 基準年 | 2024 |
| 終了年 | 2028 |
| 予測期間 | 2024-2028 |
| 成長モメンタム | 加速 |
| 前年比2024年 | 5.44% |
| CAGR | 5.85% |
| 増分額 | 6億9,780万米ドル |
本調査では、今後数年間の産業用高効率微粒子空気(HEPA)フィルター市場成長を牽引する主な要因の1つとして、石油・ガスパイプライン活動の活発化を挙げています。また、予防保守への注目の高まりと市場統合の進展は、市場の大きな需要につながります。
目次
第1章 エグゼクティブサマリー
- 市場概要
第2章 市場情勢
- 市場エコシステム
- 市場の特徴
- バリューチェーン分析
第3章 市場規模の評価
- 市場の定義
- 市場セグメント分析
- 市場規模 2023
- 市場の見通し 2023-2028
第4章 市場規模実績
- 世界産業用高効率微粒子空気(HEPA)フィルター市場 2018-2022
- 用途別セグメント分析 2018-2022
- エンドユーザー別セグメント分析 2018-2022
- 地域別セグメント分析 2018-2022
- 国別セグメント分析 2018-2022
第5章 ファイブフォース分析
- ファイブフォースの要約
- 買い手の交渉力
- 供給企業の交渉力
- 新規参入業者の脅威
- 代替品の脅威
- 競争の脅威
- 市況
第6章 市場セグメンテーション:用途別
- 市場セグメンテーション
- 比較:用途別
- エアーフィルター:市場規模と予測 2023-2028
- クリーンルーム:市場規模と予測 2023-2028
- ガスタービン:市場規模と予測 2023-2028
- 市場機会:用途別
第7章 市場セグメンテーション:エンドユーザー別
- 市場セグメンテーション
- 比較:エンドユーザー別
- 商業用:市場規模と予測 2023-2028
- 産業用:市場規模と予測 2023-2028
- 住宅用:市場規模と予測 2023-2028
- 市場機会:エンドユーザー別
第8章 顧客情勢
- 顧客情勢の概要
第9章 地域別情勢
- 地域別セグメンテーション
- 地域別比較
- アジア太平洋:市場規模と予測 2023-2028
- 欧州:市場規模と予測 2023-2028
- 北米:市場規模と予測 2023-2028
- 南米:市場規模と予測 2023-2028
- 中東・アフリカ:市場規模と予測 2023-2028
- 中国:市場規模と予測 2023-2028
- 米国:市場規模と予測 2023-2028
- ドイツ:市場規模と予測 2023-2028
- 日本:市場規模と予測 2023-2028
- 英国:市場規模と予測 2023-2028
- 市場機会:地域別
第10章 促進要因・課題・機会・抑制要因
- 市場促進要因
- 市場の課題
- 促進要因と課題の影響
- 市場の機会・抑制要因
第11章 競合情勢
- 概要
- 競合情勢
- 混乱の状況
- 業界のリスク
第12章 競合分析
- 企業プロファイル
- 企業の市場ポジショニング
- Air Clean Deviser Taiwan Corp.
- Camfil AB
- Daikin Industries Ltd.
- Donaldson Co. Inc.
- Filtration Group Corp.
- Freudenberg and Co. KG
- Johnson Controls International Plc.
- Komline Sanderson Corp.
- MayAir Group
- Parker Hannifin Corp.
- Synder Filtration Inc.
- Troy Filters Ltd.
- W. L. Gore and Associates Inc.
- Webasto SE
- Wujiang Deshengxin Purification Equipment Co. Ltd.
第13章 付録
Exhibits:
- Exhibits1: Executive Summary - Chart on Market Overview
- Exhibits2: Executive Summary - Data Table on Market Overview
- Exhibits3: Executive Summary - Chart on Global Market Characteristics
- Exhibits4: Executive Summary - Chart on Market by Geography
- Exhibits5: Executive Summary - Chart on Market Segmentation by Application
- Exhibits6: Executive Summary - Chart on Market Segmentation by End-user
- Exhibits7: Executive Summary - Chart on Incremental Growth
- Exhibits8: Executive Summary - Data Table on Incremental Growth
- Exhibits9: Executive Summary - Chart on Company Market Positioning
- Exhibits10: Parent Market
- Exhibits11: Data Table on - Parent Market
- Exhibits12: Market characteristics analysis
- Exhibits13: Value Chain Analysis
- Exhibits14: Offerings of companies included in the market definition
- Exhibits15: Market segments
- Exhibits16: Chart on Global - Market size and forecast 2023-2028 ($ million)
- Exhibits17: Data Table on Global - Market size and forecast 2023-2028 ($ million)
- Exhibits18: Chart on Global Market: Year-over-year growth 2023-2028 (%)
- Exhibits19: Data Table on Global Market: Year-over-year growth 2023-2028 (%)
- Exhibits20: Historic Market Size - Data Table on Global Industrial High-Efficiency Particulate Air (HEPA) Filters Market 2018 - 2022 ($ million)
- Exhibits21: Historic Market Size - Application Segment 2018 - 2022 ($ million)
- Exhibits22: Historic Market Size - End-user Segment 2018 - 2022 ($ million)
- Exhibits23: Historic Market Size - Geography Segment 2018 - 2022 ($ million)
- Exhibits24: Historic Market Size - Country Segment 2018 - 2022 ($ million)
- Exhibits25: Five forces analysis - Comparison between 2023 and 2028
- Exhibits26: Bargaining power of buyers - Impact of key factors 2023 and 2028
- Exhibits27: Bargaining power of suppliers - Impact of key factors in 2023 and 2028
- Exhibits28: Threat of new entrants - Impact of key factors in 2023 and 2028
- Exhibits29: Threat of substitutes - Impact of key factors in 2023 and 2028
- Exhibits30: Threat of rivalry - Impact of key factors in 2023 and 2028
- Exhibits31: Chart on Market condition - Five forces 2023 and 2028
- Exhibits32: Chart on Application - Market share 2023-2028 (%)
- Exhibits33: Data Table on Application - Market share 2023-2028 (%)
- Exhibits34: Chart on Comparison by Application
- Exhibits35: Data Table on Comparison by Application
- Exhibits36: Chart on Air filtration - Market size and forecast 2023-2028 ($ million)
- Exhibits37: Data Table on Air filtration - Market size and forecast 2023-2028 ($ million)
- Exhibits38: Chart on Air filtration - Year-over-year growth 2023-2028 (%)
- Exhibits39: Data Table on Air filtration - Year-over-year growth 2023-2028 (%)
- Exhibits40: Chart on Cleanroom - Market size and forecast 2023-2028 ($ million)
- Exhibits41: Data Table on Cleanroom - Market size and forecast 2023-2028 ($ million)
- Exhibits42: Chart on Cleanroom - Year-over-year growth 2023-2028 (%)
- Exhibits43: Data Table on Cleanroom - Year-over-year growth 2023-2028 (%)
- Exhibits44: Chart on Gas turbines - Market size and forecast 2023-2028 ($ million)
- Exhibits45: Data Table on Gas turbines - Market size and forecast 2023-2028 ($ million)
- Exhibits46: Chart on Gas turbines - Year-over-year growth 2023-2028 (%)
- Exhibits47: Data Table on Gas turbines - Year-over-year growth 2023-2028 (%)
- Exhibits48: Market opportunity by Application ($ million)
- Exhibits49: Data Table on Market opportunity by Application ($ million)
- Exhibits50: Chart on End-user - Market share 2023-2028 (%)
- Exhibits51: Data Table on End-user - Market share 2023-2028 (%)
- Exhibits52: Chart on Comparison by End-user
- Exhibits53: Data Table on Comparison by End-user
- Exhibits54: Chart on Commercial - Market size and forecast 2023-2028 ($ million)
- Exhibits55: Data Table on Commercial - Market size and forecast 2023-2028 ($ million)
- Exhibits56: Chart on Commercial - Year-over-year growth 2023-2028 (%)
- Exhibits57: Data Table on Commercial - Year-over-year growth 2023-2028 (%)
- Exhibits58: Chart on Industrial - Market size and forecast 2023-2028 ($ million)
- Exhibits59: Data Table on Industrial - Market size and forecast 2023-2028 ($ million)
- Exhibits60: Chart on Industrial - Year-over-year growth 2023-2028 (%)
- Exhibits61: Data Table on Industrial - Year-over-year growth 2023-2028 (%)
- Exhibits62: Chart on Residential - Market size and forecast 2023-2028 ($ million)
- Exhibits63: Data Table on Residential - Market size and forecast 2023-2028 ($ million)
- Exhibits64: Chart on Residential - Year-over-year growth 2023-2028 (%)
- Exhibits65: Data Table on Residential - Year-over-year growth 2023-2028 (%)
- Exhibits66: Market opportunity by End-user ($ million)
- Exhibits67: Data Table on Market opportunity by End-user ($ million)
- Exhibits68: Analysis of price sensitivity, lifecycle, customer purchase basket, adoption rates, and purchase criteria
- Exhibits69: Chart on Market share By Geographical Landscape2023-2028 (%)
- Exhibits70: Data Table on Market share By Geographical Landscape2023-2028 (%)
- Exhibits71: Chart on Geographic comparison
- Exhibits72: Data Table on Geographic comparison
- Exhibits73: Chart on APAC - Market size and forecast 2023-2028 ($ million)
- Exhibits74: Data Table on APAC - Market size and forecast 2023-2028 ($ million)
- Exhibits75: Chart on APAC - Year-over-year growth 2023-2028 (%)
- Exhibits76: Data Table on APAC - Year-over-year growth 2023-2028 (%)
- Exhibits77: Chart on Europe - Market size and forecast 2023-2028 ($ million)
- Exhibits78: Data Table on Europe - Market size and forecast 2023-2028 ($ million)
- Exhibits79: Chart on Europe - Year-over-year growth 2023-2028 (%)
- Exhibits80: Data Table on Europe - Year-over-year growth 2023-2028 (%)
- Exhibits81: Chart on North America - Market size and forecast 2023-2028 ($ million)
- Exhibits82: Data Table on North America - Market size and forecast 2023-2028 ($ million)
- Exhibits83: Chart on North America - Year-over-year growth 2023-2028 (%)
- Exhibits84: Data Table on North America - Year-over-year growth 2023-2028 (%)
- Exhibits85: Chart on South America - Market size and forecast 2023-2028 ($ million)
- Exhibits86: Data Table on South America - Market size and forecast 2023-2028 ($ million)
- Exhibits87: Chart on South America - Year-over-year growth 2023-2028 (%)
- Exhibits88: Data Table on South America - Year-over-year growth 2023-2028 (%)
- Exhibits89: Chart on Middle East and Africa - Market size and forecast 2023-2028 ($ million)
- Exhibits90: Data Table on Middle East and Africa - Market size and forecast 2023-2028 ($ million)
- Exhibits91: Chart on Middle East and Africa - Year-over-year growth 2023-2028 (%)
- Exhibits92: Data Table on Middle East and Africa - Year-over-year growth 2023-2028 (%)
- Exhibits93: Chart on China - Market size and forecast 2023-2028 ($ million)
- Exhibits94: Data Table on China - Market size and forecast 2023-2028 ($ million)
- Exhibits95: Chart on China - Year-over-year growth 2023-2028 (%)
- Exhibits96: Data Table on China - Year-over-year growth 2023-2028 (%)
- Exhibits97: Chart on US - Market size and forecast 2023-2028 ($ million)
- Exhibits98: Data Table on US - Market size and forecast 2023-2028 ($ million)
- Exhibits99: Chart on US - Year-over-year growth 2023-2028 (%)
- Exhibits100: Data Table on US - Year-over-year growth 2023-2028 (%)
- Exhibits101: Chart on Germany - Market size and forecast 2023-2028 ($ million)
- Exhibits102: Data Table on Germany - Market size and forecast 2023-2028 ($ million)
- Exhibits103: Chart on Germany - Year-over-year growth 2023-2028 (%)
- Exhibits104: Data Table on Germany - Year-over-year growth 2023-2028 (%)
- Exhibits105: Chart on Japan - Market size and forecast 2023-2028 ($ million)
- Exhibits106: Data Table on Japan - Market size and forecast 2023-2028 ($ million)
- Exhibits107: Chart on Japan - Year-over-year growth 2023-2028 (%)
- Exhibits108: Data Table on Japan - Year-over-year growth 2023-2028 (%)
- Exhibits109: Chart on UK - Market size and forecast 2023-2028 ($ million)
- Exhibits110: Data Table on UK - Market size and forecast 2023-2028 ($ million)
- Exhibits111: Chart on UK - Year-over-year growth 2023-2028 (%)
- Exhibits112: Data Table on UK - Year-over-year growth 2023-2028 (%)
- Exhibits113: Market opportunity By Geographical Landscape($ million)
- Exhibits114: Data Tables on Market opportunity By Geographical Landscape($ million)
- Exhibits115: Impact of drivers and challenges in 2023 and 2028
- Exhibits116: Overview on criticality of inputs and factors of differentiation
- Exhibits117: Overview on factors of disruption
- Exhibits118: Impact of key risks on business
- Exhibits119: Companies covered
- Exhibits120: Matrix on companies position and classification
- Exhibits121: Air Clean Deviser Taiwan Corp. - Overview
- Exhibits122: Air Clean Deviser Taiwan Corp. - Product / Service
- Exhibits123: Air Clean Deviser Taiwan Corp. - Key offerings
- Exhibits124: Camfil AB - Overview
- Exhibits125: Camfil AB - Product / Service
- Exhibits126: Camfil AB - Key offerings
- Exhibits127: Daikin Industries Ltd. - Overview
- Exhibits128: Daikin Industries Ltd. - Business segments
- Exhibits129: Daikin Industries Ltd. - Key news
- Exhibits130: Daikin Industries Ltd. - Key offerings
- Exhibits131: Daikin Industries Ltd. - Segment focus
- Exhibits132: Donaldson Co. Inc. - Overview
- Exhibits133: Donaldson Co. Inc. - Business segments
- Exhibits134: Donaldson Co. Inc. - Key news
- Exhibits135: Donaldson Co. Inc. - Key offerings
- Exhibits136: Donaldson Co. Inc. - Segment focus
- Exhibits137: Filtration Group Corp. - Overview
- Exhibits138: Filtration Group Corp. - Product / Service
- Exhibits139: Filtration Group Corp. - Key news
- Exhibits140: Filtration Group Corp. - Key offerings
- Exhibits141: Freudenberg and Co. KG - Overview
- Exhibits142: Freudenberg and Co. KG - Product / Service
- Exhibits143: Freudenberg and Co. KG - Key news
- Exhibits144: Freudenberg and Co. KG - Key offerings
- Exhibits145: Johnson Controls International Plc. - Overview
- Exhibits146: Johnson Controls International Plc. - Business segments
- Exhibits147: Johnson Controls International Plc. - Key news
- Exhibits148: Johnson Controls International Plc. - Key offerings
- Exhibits149: Johnson Controls International Plc. - Segment focus
- Exhibits150: Komline Sanderson Corp. - Overview
- Exhibits151: Komline Sanderson Corp. - Product / Service
- Exhibits152: Komline Sanderson Corp. - Key offerings
- Exhibits153: MayAir Group - Overview
- Exhibits154: MayAir Group - Product / Service
- Exhibits155: MayAir Group - Key offerings
- Exhibits156: Parker Hannifin Corp. - Overview
- Exhibits157: Parker Hannifin Corp. - Business segments
- Exhibits158: Parker Hannifin Corp. - Key news
- Exhibits159: Parker Hannifin Corp. - Key offerings
- Exhibits160: Parker Hannifin Corp. - Segment focus
- Exhibits161: Synder Filtration Inc. - Overview
- Exhibits162: Synder Filtration Inc. - Product / Service
- Exhibits163: Synder Filtration Inc. - Key offerings
- Exhibits164: Troy Filters Ltd. - Overview
- Exhibits165: Troy Filters Ltd. - Product / Service
- Exhibits166: Troy Filters Ltd. - Key offerings
- Exhibits167: W. L. Gore and Associates Inc. - Overview
- Exhibits168: W. L. Gore and Associates Inc. - Product / Service
- Exhibits169: W. L. Gore and Associates Inc. - Key news
- Exhibits170: W. L. Gore and Associates Inc. - Key offerings
- Exhibits171: Webasto SE - Overview
- Exhibits172: Webasto SE - Product / Service
- Exhibits173: Webasto SE - Key news
- Exhibits174: Webasto SE - Key offerings
- Exhibits175: Wujiang Deshengxin Purification Equipment Co. Ltd. - Overview
- Exhibits176: Wujiang Deshengxin Purification Equipment Co. Ltd. - Product / Service
- Exhibits177: Wujiang Deshengxin Purification Equipment Co. Ltd. - Key offerings
- Exhibits178: Inclusions checklist
- Exhibits179: Exclusions checklist
- Exhibits180: Currency conversion rates for US$
- Exhibits181: Research methodology
- Exhibits182: Information sources
- Exhibits183: Data validation
- Exhibits184: Validation techniques employed for market sizing
- Exhibits185: Data synthesis
- Exhibits186: 360 degree market analysis
- Exhibits187: List of abbreviations
Industrial High-Efficiency Particulate Air (HEPA) Filters Market 2024-2028
Technavio has been monitoring the industrial high-efficiency particulate air (HEPA) filters market and is forecast to grow by USD 697.8 mn during 2023-2028, accelerating at a CAGR of 5.85% during the forecast period. Our report on the industrial high-efficiency particulate air (HEPA) filters market provides a holistic analysis, market size and forecast, trends, growth drivers, and challenges, as well as vendor analysis covering around 25 vendors.
The report offers an up-to-date analysis regarding the current market scenario, the latest trends and drivers, and the overall market environment. The market is driven by growth of distributed power generation base, increasing need for adoption of process and environmental safety measures in industries, and rising adoption of cleanroom applications across industries.
| Market Scope | |
|---|---|
| Base Year | 2024 |
| End Year | 2028 |
| Series Year | 2024-2028 |
| Growth Momentum | Accelerate |
| YOY 2024 | 5.44% |
| CAGR | 5.85% |
| Incremental Value | $697.8mn |
Technavio's industrial high-efficiency particulate air (HEPA) filters market is segmented as below:
By Application
- Air filtration
- Cleanroom
- Gas turbines
By End-user
- Commercial
- Industrial
- Residential
By Geography
- APAC
- Europe
- North America
- South America
- Middle East and Africa
This study identifies the increasing oil and gas pipeline activity as one of the prime reasons driving the industrial high-efficiency particulate air (HEPA) filters market growth during the next few years. Also, rising focus on preventive maintenance and growing market consolidation will lead to sizable demand in the market.
Technavio presents a detailed picture of the market by the way of study, synthesis, and summation of data from multiple sources by an analysis of key parameters. Our report on the industrial high-efficiency particulate air (HEPA) filters market covers the following areas:
- Industrial high-efficiency particulate air (HEPA) filters market sizing
- Industrial high-efficiency particulate air (HEPA) filters market forecast
- Industrial high-efficiency particulate air (HEPA) filters market industry analysis
Technavio's robust vendor analysis is designed to help clients improve their market position, and in line with this, this report provides a detailed analysis of several leading industrial high-efficiency particulate air (HEPA) filters market vendors that include Air Clean Deviser Taiwan Corp., Camfil AB, Daikin Industries Ltd., Donaldson Co. Inc., Filtration Group Corp., Freudenberg and Co. KG, GVS S.p.A., HEPA Corp., Johnson Controls International Plc., Komline Sanderson Corp., MANN HUMMEL International GmbH and Co. KG, MayAir Group, Nederman Holding AB, Parker Hannifin Corp., Porvair Filtration Group, Synder Filtration Inc., Troy Filters Ltd., W. L. Gore and Associates Inc., Webasto SE, and Wujiang Deshengxin Purification Equipment Co. Ltd.. Also, the industrial high-efficiency particulate air (HEPA) filters market analysis report includes information on upcoming trends and challenges that will influence market growth. This is to help companies strategize and leverage all forthcoming growth opportunities.
The study was conducted using an objective combination of primary and secondary information including inputs from key participants in the industry. The report contains a comprehensive market and vendor landscape in addition to an analysis of the key vendors.
Technavio presents a detailed picture of the market by the way of study, synthesis, and summation of data from multiple sources by an analysis of key parameters such as profit, pricing, competition, and promotions. It presents various market facets by identifying the key industry influencers. The data presented is comprehensive, reliable, and a result of extensive research - both primary and secondary. Technavio's market research reports provide a complete competitive landscape and an in-depth vendor selection methodology and analysis using qualitative and quantitative research to forecast accurate market growth.
Table of Contents
1 Executive Summary
- 1.1 Market overview
- Executive Summary - Chart on Market Overview
- Executive Summary - Data Table on Market Overview
- Executive Summary - Chart on Global Market Characteristics
- Executive Summary - Chart on Market by Geography
- Executive Summary - Chart on Market Segmentation by Application
- Executive Summary - Chart on Market Segmentation by End-user
- Executive Summary - Chart on Incremental Growth
- Executive Summary - Data Table on Incremental Growth
- Executive Summary - Chart on Company Market Positioning
2 Market Landscape
- 2.1 Market ecosystem
- Parent Market
- Data Table on - Parent Market
- 2.2 Market characteristics
- Market characteristics analysis
- 2.3 Value chain analysis
- Value Chain Analysis
3 Market Sizing
- 3.1 Market definition
- Offerings of companies included in the market definition
- 3.2 Market segment analysis
- Market segments
- 3.3 Market size 2023
- 3.4 Market outlook: Forecast for 2023-2028
- Chart on Global - Market size and forecast 2023-2028 ($ million)
- Data Table on Global - Market size and forecast 2023-2028 ($ million)
- Chart on Global Market: Year-over-year growth 2023-2028 (%)
- Data Table on Global Market: Year-over-year growth 2023-2028 (%)
4 Historic Market Size
- 4.1 Global Industrial High-Efficiency Particulate Air (HEPA) Filters Market 2018 - 2022
- Historic Market Size - Data Table on Global Industrial High-Efficiency Particulate Air (HEPA) Filters Market 2018 - 2022 ($ million)
- 4.2 Application segment analysis 2018 - 2022
- Historic Market Size - Application Segment 2018 - 2022 ($ million)
- 4.3 End-user segment analysis 2018 - 2022
- Historic Market Size - End-user Segment 2018 - 2022 ($ million)
- 4.4 Geography segment analysis 2018 - 2022
- Historic Market Size - Geography Segment 2018 - 2022 ($ million)
- 4.5 Country segment analysis 2018 - 2022
- Historic Market Size - Country Segment 2018 - 2022 ($ million)
5 Five Forces Analysis
- 5.1 Five forces summary
- Five forces analysis - Comparison between 2023 and 2028
- 5.2 Bargaining power of buyers
- Bargaining power of buyers - Impact of key factors 2023 and 2028
- 5.3 Bargaining power of suppliers
- Bargaining power of suppliers - Impact of key factors in 2023 and 2028
- 5.4 Threat of new entrants
- Threat of new entrants - Impact of key factors in 2023 and 2028
- 5.5 Threat of substitutes
- Threat of substitutes - Impact of key factors in 2023 and 2028
- 5.6 Threat of rivalry
- Threat of rivalry - Impact of key factors in 2023 and 2028
- 5.7 Market condition
- Chart on Market condition - Five forces 2023 and 2028
6 Market Segmentation by Application
- 6.1 Market segments
- Chart on Application - Market share 2023-2028 (%)
- Data Table on Application - Market share 2023-2028 (%)
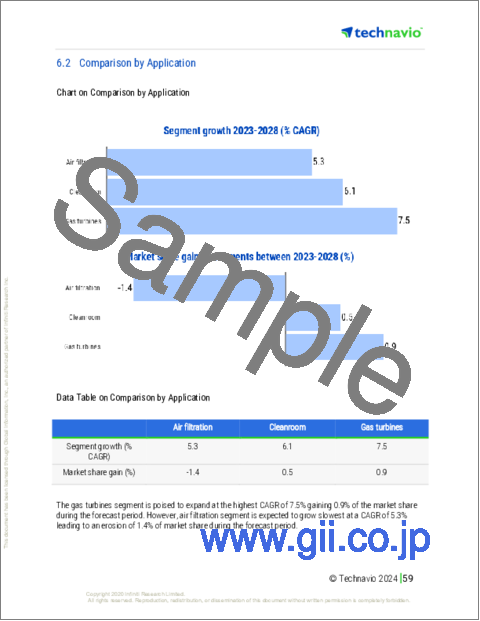
- 6.2 Comparison by Application
- Chart on Comparison by Application
- Data Table on Comparison by Application
- 6.3 Air filtration - Market size and forecast 2023-2028
- Chart on Air filtration - Market size and forecast 2023-2028 ($ million)
- Data Table on Air filtration - Market size and forecast 2023-2028 ($ million)
- Chart on Air filtration - Year-over-year growth 2023-2028 (%)
- Data Table on Air filtration - Year-over-year growth 2023-2028 (%)
- 6.4 Cleanroom - Market size and forecast 2023-2028
- Chart on Cleanroom - Market size and forecast 2023-2028 ($ million)
- Data Table on Cleanroom - Market size and forecast 2023-2028 ($ million)
- Chart on Cleanroom - Year-over-year growth 2023-2028 (%)
- Data Table on Cleanroom - Year-over-year growth 2023-2028 (%)
- 6.5 Gas turbines - Market size and forecast 2023-2028
- Chart on Gas turbines - Market size and forecast 2023-2028 ($ million)
- Data Table on Gas turbines - Market size and forecast 2023-2028 ($ million)
- Chart on Gas turbines - Year-over-year growth 2023-2028 (%)
- Data Table on Gas turbines - Year-over-year growth 2023-2028 (%)
- 6.6 Market opportunity by Application
- Market opportunity by Application ($ million)
- Data Table on Market opportunity by Application ($ million)
7 Market Segmentation by End-user
- 7.1 Market segments
- Chart on End-user - Market share 2023-2028 (%)
- Data Table on End-user - Market share 2023-2028 (%)
- 7.2 Comparison by End-user
- Chart on Comparison by End-user
- Data Table on Comparison by End-user
- 7.3 Commercial - Market size and forecast 2023-2028
- Chart on Commercial - Market size and forecast 2023-2028 ($ million)
- Data Table on Commercial - Market size and forecast 2023-2028 ($ million)
- Chart on Commercial - Year-over-year growth 2023-2028 (%)
- Data Table on Commercial - Year-over-year growth 2023-2028 (%)
- 7.4 Industrial - Market size and forecast 2023-2028
- Chart on Industrial - Market size and forecast 2023-2028 ($ million)
- Data Table on Industrial - Market size and forecast 2023-2028 ($ million)
- Chart on Industrial - Year-over-year growth 2023-2028 (%)
- Data Table on Industrial - Year-over-year growth 2023-2028 (%)
- 7.5 Residential - Market size and forecast 2023-2028
- Chart on Residential - Market size and forecast 2023-2028 ($ million)
- Data Table on Residential - Market size and forecast 2023-2028 ($ million)
- Chart on Residential - Year-over-year growth 2023-2028 (%)
- Data Table on Residential - Year-over-year growth 2023-2028 (%)
- 7.6 Market opportunity by End-user
- Market opportunity by End-user ($ million)
- Data Table on Market opportunity by End-user ($ million)
8 Customer Landscape
- 8.1 Customer landscape overview
- Analysis of price sensitivity, lifecycle, customer purchase basket, adoption rates, and purchase criteria
9 Geographic Landscape
- 9.1 Geographic segmentation
- Chart on Market share By Geographical Landscape2023-2028 (%)
- Data Table on Market share By Geographical Landscape2023-2028 (%)
- 9.2 Geographic comparison
- Chart on Geographic comparison
- Data Table on Geographic comparison
- 9.3 APAC - Market size and forecast 2023-2028
- Chart on APAC - Market size and forecast 2023-2028 ($ million)
- Data Table on APAC - Market size and forecast 2023-2028 ($ million)
- Chart on APAC - Year-over-year growth 2023-2028 (%)
- Data Table on APAC - Year-over-year growth 2023-2028 (%)
- 9.4 Europe - Market size and forecast 2023-2028
- Chart on Europe - Market size and forecast 2023-2028 ($ million)
- Data Table on Europe - Market size and forecast 2023-2028 ($ million)
- Chart on Europe - Year-over-year growth 2023-2028 (%)
- Data Table on Europe - Year-over-year growth 2023-2028 (%)
- 9.5 North America - Market size and forecast 2023-2028
- Chart on North America - Market size and forecast 2023-2028 ($ million)
- Data Table on North America - Market size and forecast 2023-2028 ($ million)
- Chart on North America - Year-over-year growth 2023-2028 (%)
- Data Table on North America - Year-over-year growth 2023-2028 (%)
- 9.6 South America - Market size and forecast 2023-2028
- Chart on South America - Market size and forecast 2023-2028 ($ million)
- Data Table on South America - Market size and forecast 2023-2028 ($ million)
- Chart on South America - Year-over-year growth 2023-2028 (%)
- Data Table on South America - Year-over-year growth 2023-2028 (%)
- 9.7 Middle East and Africa - Market size and forecast 2023-2028
- Chart on Middle East and Africa - Market size and forecast 2023-2028 ($ million)
- Data Table on Middle East and Africa - Market size and forecast 2023-2028 ($ million)
- Chart on Middle East and Africa - Year-over-year growth 2023-2028 (%)
- Data Table on Middle East and Africa - Year-over-year growth 2023-2028 (%)
- 9.8 China - Market size and forecast 2023-2028
- Chart on China - Market size and forecast 2023-2028 ($ million)
- Data Table on China - Market size and forecast 2023-2028 ($ million)
- Chart on China - Year-over-year growth 2023-2028 (%)
- Data Table on China - Year-over-year growth 2023-2028 (%)
- 9.9 US - Market size and forecast 2023-2028
- Chart on US - Market size and forecast 2023-2028 ($ million)
- Data Table on US - Market size and forecast 2023-2028 ($ million)
- Chart on US - Year-over-year growth 2023-2028 (%)
- Data Table on US - Year-over-year growth 2023-2028 (%)
- 9.10 Germany - Market size and forecast 2023-2028
- Chart on Germany - Market size and forecast 2023-2028 ($ million)
- Data Table on Germany - Market size and forecast 2023-2028 ($ million)
- Chart on Germany - Year-over-year growth 2023-2028 (%)
- Data Table on Germany - Year-over-year growth 2023-2028 (%)
- 9.11 Japan - Market size and forecast 2023-2028
- Chart on Japan - Market size and forecast 2023-2028 ($ million)
- Data Table on Japan - Market size and forecast 2023-2028 ($ million)
- Chart on Japan - Year-over-year growth 2023-2028 (%)
- Data Table on Japan - Year-over-year growth 2023-2028 (%)
- 9.12 UK - Market size and forecast 2023-2028
- Chart on UK - Market size and forecast 2023-2028 ($ million)
- Data Table on UK - Market size and forecast 2023-2028 ($ million)
- Chart on UK - Year-over-year growth 2023-2028 (%)
- Data Table on UK - Year-over-year growth 2023-2028 (%)
- 9.13 Market opportunity by geography
- Market opportunity By Geographical Landscape($ million)
- Data Tables on Market opportunity By Geographical Landscape($ million)
10 Drivers, Challenges, and Opportunity/Restraints
- 10.1 Market drivers
- 10.2 Market challenges
- 10.3 Impact of drivers and challenges
- Impact of drivers and challenges in 2023 and 2028
- 10.4 Market opportunities/restraints
11 Competitive Landscape
- 11.1 Overview
- 11.2 Competitive Landscape
- Overview on criticality of inputs and factors of differentiation
- 11.3 Landscape disruption
- Overview on factors of disruption
- 11.4 Industry risks
- Impact of key risks on business
12 Competitive Analysis
- 12.1 Companies profiled
- Companies covered
- 12.2 Market positioning of companies
- Matrix on companies position and classification
- 12.3 Air Clean Deviser Taiwan Corp.
- Air Clean Deviser Taiwan Corp. - Overview
- Air Clean Deviser Taiwan Corp. - Product / Service
- Air Clean Deviser Taiwan Corp. - Key offerings
- 12.4 Camfil AB
- Camfil AB - Overview
- Camfil AB - Product / Service
- Camfil AB - Key offerings
- 12.5 Daikin Industries Ltd.
- Daikin Industries Ltd. - Overview
- Daikin Industries Ltd. - Business segments
- Daikin Industries Ltd. - Key news
- Daikin Industries Ltd. - Key offerings
- Daikin Industries Ltd. - Segment focus
- 12.6 Donaldson Co. Inc.
- Donaldson Co. Inc. - Overview
- Donaldson Co. Inc. - Business segments
- Donaldson Co. Inc. - Key news
- Donaldson Co. Inc. - Key offerings
- Donaldson Co. Inc. - Segment focus
- 12.7 Filtration Group Corp.
- Filtration Group Corp. - Overview
- Filtration Group Corp. - Product / Service
- Filtration Group Corp. - Key news
- Filtration Group Corp. - Key offerings
- 12.8 Freudenberg and Co. KG
- Freudenberg and Co. KG - Overview
- Freudenberg and Co. KG - Product / Service
- Freudenberg and Co. KG - Key news
- Freudenberg and Co. KG - Key offerings
- 12.9 Johnson Controls International Plc.
- Johnson Controls International Plc. - Overview
- Johnson Controls International Plc. - Business segments
- Johnson Controls International Plc. - Key news
- Johnson Controls International Plc. - Key offerings
- Johnson Controls International Plc. - Segment focus
- 12.10 Komline Sanderson Corp.
- Komline Sanderson Corp. - Overview
- Komline Sanderson Corp. - Product / Service
- Komline Sanderson Corp. - Key offerings
- 12.11 MayAir Group
- MayAir Group - Overview
- MayAir Group - Product / Service
- MayAir Group - Key offerings
- 12.12 Parker Hannifin Corp.
- Parker Hannifin Corp. - Overview
- Parker Hannifin Corp. - Business segments
- Parker Hannifin Corp. - Key news
- Parker Hannifin Corp. - Key offerings
- Parker Hannifin Corp. - Segment focus
- 12.13 Synder Filtration Inc.
- Synder Filtration Inc. - Overview
- Synder Filtration Inc. - Product / Service
- Synder Filtration Inc. - Key offerings
- 12.14 Troy Filters Ltd.
- Troy Filters Ltd. - Overview
- Troy Filters Ltd. - Product / Service
- Troy Filters Ltd. - Key offerings
- 12.15 W. L. Gore and Associates Inc.
- W. L. Gore and Associates Inc. - Overview
- W. L. Gore and Associates Inc. - Product / Service
- W. L. Gore and Associates Inc. - Key news
- W. L. Gore and Associates Inc. - Key offerings
- 12.16 Webasto SE
- Webasto SE - Overview
- Webasto SE - Product / Service
- Webasto SE - Key news
- Webasto SE - Key offerings
- 12.17 Wujiang Deshengxin Purification Equipment Co. Ltd.
- Wujiang Deshengxin Purification Equipment Co. Ltd. - Overview
- Wujiang Deshengxin Purification Equipment Co. Ltd. - Product / Service
- Wujiang Deshengxin Purification Equipment Co. Ltd. - Key offerings
13 Appendix
- 13.1 Scope of the report
- 13.2 Inclusions and exclusions checklist
- Inclusions checklist
- Exclusions checklist
- 13.3 Currency conversion rates for US$
- Currency conversion rates for US$
- 13.4 Research methodology
- Research methodology
- 13.5 Data procurement
- Information sources
- 13.6 Data validation
- Data validation
- 13.7 Validation techniques employed for market sizing
- Validation techniques employed for market sizing
- 13.8 Data synthesis
- Data synthesis
- 13.9 360 degree market analysis
- 360 degree market analysis
- 13.10 List of abbreviations
- List of abbreviations

