|
|
市場調査レポート
商品コード
1975384
ポストプロダクションの世界市場 2026年~2030年Global Post Production Market 2026-2030 |
||||||

|
|||||||
カスタマイズ可能
|
|||||||

| ポストプロダクションの世界市場 2026年~2030年 |
|
出版日: 2026年03月09日
発行: TechNavio
ページ情報: 英文 308 Pages
納期: 即納可能
|

概要
世界のポストプロダクション市場は、2025年から2030年にかけて182億350万米ドルの成長が見込まれ、予測期間中のCAGRは12.9%と予測されています。
本レポートでは、世界のポストプロダクション市場に関する包括的な分析、市場規模と予測、動向、成長要因、課題に加え、約25社のベンダー分析を提供しております。
本レポートは、現在の市場状況、最新の動向と促進要因、市場環境全般に関する最新の分析を提供します。市場は、没入型かつ高解像度のメディアコンテンツに対する消費者の期待の高まり、ポストプロダクション効率化のためのAI技術の進歩、世界の共同作業ワークフローのための堅牢なクラウドインフラの導入によって牽引されています。
本調査は、業界の主要関係者からの情報を含む、一次情報と二次情報の客観的な組み合わせを用いて実施されました。本レポートには、主要企業の分析に加え、包括的な市場規模データ、地域別分析を伴うセグメント、ベンダー情勢が含まれています。レポートには過去データと予測データが掲載されています。
| 市場範囲 | |
|---|---|
| 基準年 | 2026年 |
| 終了年 | 2030年 |
| 予測期間 | 2026年~2030年 |
| 成長モメンタム | 加速 |
| 前年比2026年 | 12.3% |
| CAGR | 12.9% |
| 増分額 | 182億350万米ドル |
本調査では、創造的パイプラインへの生成AIの統合が、今後数年間における世界のポストプロダクション市場成長を牽引する主要な要因の一つであると特定しております。また、クラウドネイティブのコラボレーションプラットフォームの普及と、ゲームエンジン技術と映画的ポストプロダクションの融合が、市場において相当な需要を生み出すことになると予測されます。
目次
第1章 エグゼクティブサマリー
第2章 Technavio分析
- 価格・ライフサイクル・顧客購入バスケット・採用率・購入基準の分析
- インプットの重要性と差別化の要因
- 混乱の要因
- 促進要因と課題の影響
第3章 市場情勢
- 市場エコシステム
- 市場の特徴
- バリューチェーン分析
第4章 市場規模
- 市場の定義
- 市場セグメント分析
- 市場規模、2025年
- 市場の見通し、2025年~2030年
第5章 市場規模実績
- ポストプロダクションの世界市場、2020年~2024年
- 技術セグメント分析、2020年~2024年
- 用途セグメント分析、2020年~2024年
- エンドユーザーセグメント分析、2020年~2024年
- 地域別セグメント分析、2020年~2024年
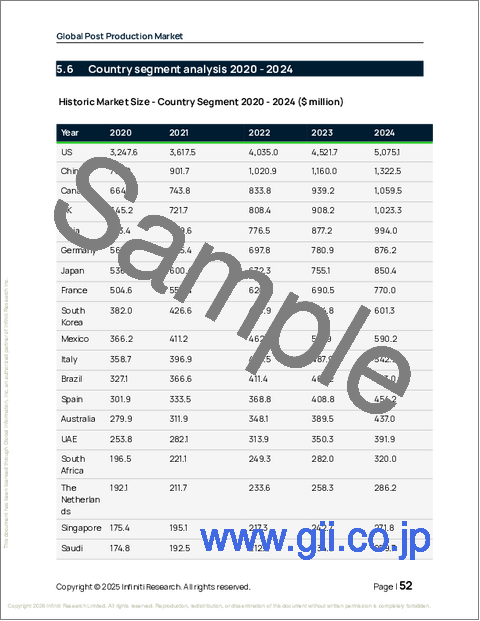
- 国別セグメント分析、2020年~2024年
第6章 定性分析
- AIの影響:ポストプロダクションの世界市場
第7章 ファイブフォース分析
- ファイブフォースの要約
- 買い手の交渉力
- 供給企業の交渉力
- 新規参入業者の脅威
- 代替品の脅威
- 競争の脅威
- 市況
第8章 市場セグメンテーション:技術別
- 比較:技術別
- VFX
- 音声処理
- 2Dと3Dの変換
- 編集
- その他
- 市場機会:技術別
第9章 市場セグメンテーション:用途別
- 比較:用途別
- フィルム
- テレビ
- コマーシャル
- オンライン動画
- 市場機会:用途別
第10章 市場セグメンテーション:エンドユーザー別
- 比較:エンドユーザー別
- 制作会社
- 独立系映画製作者
- テレビスタジオ
- 市場機会:エンドユーザー別
第11章 顧客情勢
第12章 地域別情勢
- 地域別セグメンテーション
- 比較:地域別
- 北米
- 米国
- カナダ
- メキシコ
- アジア太平洋
- 中国
- インド
- 日本
- 韓国
- オーストラリア
- シンガポール
- 欧州
- 英国
- ドイツ
- フランス
- イタリア
- スペイン
- オランダ
- 中東・アフリカ
- アラブ首長国連邦
- 南アフリカ
- サウジアラビア
- エジプト
- イスラエル
- 南米
- ブラジル
- アルゼンチン
- チリ
- 市場機会:地域別
第13章 促進要因・課題・機会
- 市場促進要因
- 市場の課題
- 促進要因と課題の影響
- 市場機会
第14章 競合情勢
- 概要
- 競合情勢
- 混乱の状況
- 業界のリスク
第15章 競合分析
- 企業プロファイル
- 企業ランキング指標
- 企業の市場ポジショニング
- Amazon.com Inc.
- AT and T Inc.
- Comcast Corp.
- Deluxe Media Inc.
- Framestore Ltd.
- Lantern Entertainment
- Lions Gate Entertainment Corp.
- Netflix Inc.
- Paramount Global
- Prime Focus Ltd.
- Red Chillies Entertainments
- Sony Group Corp.
- Streamland Media Inc.
- STUDIO GHIBLI Inc.
- The Walt Disney Co.
