|
|
市場調査レポート
商品コード
1132225
コグニティブメディアソリューションの世界市場 2022-2026Global Cognitive Media Solutions Market 2022-2026 |
||||||
|
|
|||||||
|
● お客様のご希望に応じて、既存データの加工や未掲載情報(例:国別セグメント)の追加などの対応が可能です。 詳細はお問い合わせください。 |
|||||||


| コグニティブメディアソリューションの世界市場 2022-2026 |
|
出版日: 2022年09月01日
発行: TechNavio
ページ情報: 英文 120 Pages
納期: 即納可能
|
- 全表示
- 概要
- 図表
- 目次
当レポートによるとコグニティブメディアソリューションの市場規模は、2022年から2026年の間にCAGR27.14%で44億9000万米ドルの成長が見込まれると予測しています。
当レポートでは、コグニティブメディアソリューション市場の全体分析、市場規模と予測、動向、成長促進要因・課題、約25社のベンダーを網羅したベンダー分析などをお届けします。
また、現在の世界の市場動向と促進要因、市場全体の環境について最新の分析を提供しています。市場は、デジタル変革、技術的に高度なモバイルデバイスの採用拡大、データ統合とビジュアル分析の需要拡大が原動力となっています。
本調査では、ソーシャルメディアの高い利用率が、今後数年間のコグニティブメディアソリューション市場の成長を促進する主要な理由の1つであることを明らかにしています。また、次世代ネットワークのイントロダクションやプログラマティック広告バイイングの進化は、市場の大きな需要につながるでしょう。
目次
第1章 エグゼクティブサマリー
- 市場概要
第2章 市場情勢
- 市場エコシステム
第3章 市場規模
- 市場の定義
- 市場セグメント分析
- 市場規模 2021
- 市場の見通し:2021-2026年の予測
第4章 ファイブフォース分析
- ファイブフォースの要約
- 買い手の交渉力
- 供給企業の交渉力
- 新規参入業者の脅威
- 代替品の脅威
- 競争の脅威
- 市況
第5章 エンドユーザー別市場セグメンテーション
- 市場内訳
- エンドユーザー別比較
- 中小企業 - 市場規模と予測 2021-2026
- 大企業 - 市場規模と予測 2021-2026
- エンドユーザー別の市場機会
第6章 顧客情勢
- 顧客情勢の概要
第7章 地域別情勢
- 地域別セグメンテーション
- 地域別比較
- 北米 - 市場規模と予測 2021-2026
- 欧州 - 市場規模と予測 2021-2026
- APAC - 市場規模と予測 2021-2026
- 中東およびアフリカ - 市場規模と予測 2021-2026
- 南米 - 市場規模と予測 2021-2026
- 米国 - 市場規模と予測 2021-2026
- 中国 - 市場規模と予測 2021-2026
- 英国 - 市場規模と予測 2021-2026
- ドイツ - 市場規模と予測 2021-2026
- 日本 - 市場規模と予測 2021-2026
- 地域情勢別の市場機会
第8章 促進要因、課題、および動向
- 市場促進要因
- 市場の課題
- 促進要因と課題の影響
- 市場動向
第9章 ベンダー情勢
- 概要
- ベンダー情勢
- 混乱の状況
- 業界のリスク
第10章 ベンダー分析
- 対象ベンダー
- ベンダーの市場ポジショニング
- Adobe Inc.
- Alphabet Inc.
- Amazon.com Inc.
- Baidu Inc
- Cision Ltd
- International Business Machines Corp.
- Microsoft Corp.
- NVIDIA Corp.
- Salesforce Inc.
- Veritone Inc
第11章 付録
Exhibits:
- Exhibits1: Executive Summary - Chart on Market Overview
- Exhibits2: Executive Summary - Data Table on Market Overview
- Exhibits3: Executive Summary - Chart on Global Market Characteristics
- Exhibits4: Executive Summary - Chart on Market By Geographical Landscape
- Exhibits5: Executive Summary - Chart on Market Segmentation by End-user
- Exhibits6: Executive Summary - Chart on Incremental Growth
- Exhibits7: Executive Summary - Data Table on Incremental Growth
- Exhibits8: Executive Summary - Chart on Vendor Market Positioning
- Exhibits9: Parent market
- Exhibits10: Market Characteristics
- Exhibits11: Offerings of vendors included in the market definition
- Exhibits12: Market segments
- Exhibits13: Chart on Global - Market size and forecast 2021-2026 ($ million)
- Exhibits14: Data Table on Global - Market size and forecast 2021-2026 ($ million)
- Exhibits15: Chart on Global Market: Year-over-year growth 2021-2026 (%)
- Exhibits16: Data Table on Global Market: Year-over-year growth 2021-2026 (%)
- Exhibits17: Five forces analysis - Comparison between 2021 and 2026
- Exhibits18: Chart on Bargaining power of buyers - Impact of key factors 2021 and 2026
- Exhibits19: Bargaining power of suppliers - Impact of key factors in 2021 and 2026
- Exhibits20: Threat of new entrants - Impact of key factors in 2021 and 2026
- Exhibits21: Threat of substitutes - Impact of key factors in 2021 and 2026
- Exhibits22: Threat of rivalry - Impact of key factors in 2021 and 2026
- Exhibits23: Chart on Market condition - Five forces 2021 and 2026
- Exhibits24: Chart on End-user - Market share 2021-2026 (%)
- Exhibits25: Data Table on End-user - Market share 2021-2026 (%)
- Exhibits26: Chart on Comparison by End-user
- Exhibits27: Data Table on Comparison by End-user
- Exhibits28: Chart on SME - Market size and forecast 2021-2026 ($ million)
- Exhibits29: Data Table on SME - Market size and forecast 2021-2026 ($ million)
- Exhibits30: Chart on SME - Year-over-year growth 2021-2026 (%)
- Exhibits31: Data Table on SME - Year-over-year growth 2021-2026 (%)
- Exhibits32: Chart on Large enterprises - Market size and forecast 2021-2026 ($ million)
- Exhibits33: Data Table on Large enterprises - Market size and forecast 2021-2026 ($ million)
- Exhibits34: Chart on Large enterprises - Year-over-year growth 2021-2026 (%)
- Exhibits35: Data Table on Large enterprises - Year-over-year growth 2021-2026 (%)
- Exhibits36: Market opportunity by End-user ($ million)
- Exhibits37: Analysis of price sensitivity, lifecycle, customer purchase basket, adoption rates, and purchase criteria
- Exhibits38: Chart on Market share By Geographical Landscape 2021-2026 (%)
- Exhibits39: Data Table on Market share By Geographical Landscape 2021-2026 (%)
- Exhibits40: Chart on Geographic comparison
- Exhibits41: Data Table on Geographic comparison
- Exhibits42: Chart on North America - Market size and forecast 2021-2026 ($ million)
- Exhibits43: Data Table on North America - Market size and forecast 2021-2026 ($ million)
- Exhibits44: Chart on North America - Year-over-year growth 2021-2026 (%)
- Exhibits45: Data Table on North America - Year-over-year growth 2021-2026 (%)
- Exhibits46: Chart on Europe - Market size and forecast 2021-2026 ($ million)
- Exhibits47: Data Table on Europe - Market size and forecast 2021-2026 ($ million)
- Exhibits48: Chart on Europe - Year-over-year growth 2021-2026 (%)
- Exhibits49: Data Table on Europe - Year-over-year growth 2021-2026 (%)
- Exhibits50: Chart on APAC - Market size and forecast 2021-2026 ($ million)
- Exhibits51: Data Table on APAC - Market size and forecast 2021-2026 ($ million)
- Exhibits52: Chart on APAC - Year-over-year growth 2021-2026 (%)
- Exhibits53: Data Table on APAC - Year-over-year growth 2021-2026 (%)
- Exhibits54: Chart on Middle East and Africa - Market size and forecast 2021-2026 ($ million)
- Exhibits55: Data Table on Middle East and Africa - Market size and forecast 2021-2026 ($ million)
- Exhibits56: Chart on Middle East and Africa - Year-over-year growth 2021-2026 (%)
- Exhibits57: Data Table on Middle East and Africa - Year-over-year growth 2021-2026 (%)
- Exhibits58: Chart on South America - Market size and forecast 2021-2026 ($ million)
- Exhibits59: Data Table on South America - Market size and forecast 2021-2026 ($ million)
- Exhibits60: Chart on South America - Year-over-year growth 2021-2026 (%)
- Exhibits61: Data Table on South America - Year-over-year growth 2021-2026 (%)
- Exhibits62: Chart on US - Market size and forecast 2021-2026 ($ million)
- Exhibits63: Data Table on US - Market size and forecast 2021-2026 ($ million)
- Exhibits64: Chart on US - Year-over-year growth 2021-2026 (%)
- Exhibits65: Data Table on US - Year-over-year growth 2021-2026 (%)
- Exhibits66: Chart on China - Market size and forecast 2021-2026 ($ million)
- Exhibits67: Data Table on China - Market size and forecast 2021-2026 ($ million)
- Exhibits68: Chart on China - Year-over-year growth 2021-2026 (%)
- Exhibits69: Data Table on China - Year-over-year growth 2021-2026 (%)
- Exhibits70: Chart on UK - Market size and forecast 2021-2026 ($ million)
- Exhibits71: Data Table on UK - Market size and forecast 2021-2026 ($ million)
- Exhibits72: Chart on UK - Year-over-year growth 2021-2026 (%)
- Exhibits73: Data Table on UK - Year-over-year growth 2021-2026 (%)
- Exhibits74: Chart on Germany - Market size and forecast 2021-2026 ($ million)
- Exhibits75: Data Table on Germany - Market size and forecast 2021-2026 ($ million)
- Exhibits76: Chart on Germany - Year-over-year growth 2021-2026 (%)
- Exhibits77: Data Table on Germany - Year-over-year growth 2021-2026 (%)
- Exhibits78: Chart on Japan - Market size and forecast 2021-2026 ($ million)
- Exhibits79: Data Table on Japan - Market size and forecast 2021-2026 ($ million)
- Exhibits80: Chart on Japan - Year-over-year growth 2021-2026 (%)
- Exhibits81: Data Table on Japan - Year-over-year growth 2021-2026 (%)
- Exhibits82: Market opportunity By Geographical Landscape ($ million)
- Exhibits83: Impact of drivers and challenges in 2021 and 2026
- Exhibits84: Overview on Criticality of inputs and Factors of differentiation
- Exhibits85: Overview on factors of disruption
- Exhibits86: Impact of key risks on business
- Exhibits87: Vendors covered
- Exhibits88: Matrix on vendor position and classification
- Exhibits89: Adobe Inc. - Overview
- Exhibits90: Adobe Inc. - Business segments
- Exhibits91: Adobe Inc. - Key news
- Exhibits92: Adobe Inc. - Key offerings
- Exhibits93: Adobe Inc. - Segment focus
- Exhibits94: Alphabet Inc. - Overview
- Exhibits95: Alphabet Inc. - Business segments
- Exhibits96: Alphabet Inc. - Key news
- Exhibits97: Alphabet Inc. - Key offerings
- Exhibits98: Alphabet Inc. - Segment focus
- Exhibits99: Amazon.com Inc. - Overview
- Exhibits100: Amazon.com Inc. - Business segments
- Exhibits101: Amazon.com Inc. - Key news
- Exhibits102: Amazon.com Inc. - Key offerings
- Exhibits103: Amazon.com Inc. - Segment focus
- Exhibits104: Baidu Inc - Overview
- Exhibits105: Baidu Inc - Business segments
- Exhibits106: Baidu Inc - Key offerings
- Exhibits107: Baidu Inc - Segment focus
- Exhibits108: Cision Ltd - Overview
- Exhibits109: Cision Ltd - Product / Service
- Exhibits110: Cision Ltd - Key offerings
- Exhibits111: International Business Machines Corp. - Overview
- Exhibits112: International Business Machines Corp. - Business segments
- Exhibits113: International Business Machines Corp. - Key offerings
- Exhibits114: International Business Machines Corp. - Segment focus
- Exhibits115: Microsoft Corp. - Overview
- Exhibits116: Microsoft Corp. - Business segments
- Exhibits117: Microsoft Corp. - Key news
- Exhibits118: Microsoft Corp. - Key offerings
- Exhibits119: Microsoft Corp. - Segment focus
- Exhibits120: NVIDIA Corp. - Overview
- Exhibits121: NVIDIA Corp. - Business segments
- Exhibits122: NVIDIA Corp. - Key news
- Exhibits123: NVIDIA Corp. - Key offerings
- Exhibits124: NVIDIA Corp. - Segment focus
- Exhibits125: Salesforce Inc. - Overview
- Exhibits126: Salesforce Inc. - Product / Service
- Exhibits127: Salesforce Inc. - Key news
- Exhibits128: Salesforce Inc. - Key offerings
- Exhibits129: Veritone Inc - Overview
- Exhibits130: Veritone Inc - Product / Service
- Exhibits131: Veritone Inc - Key offerings
- Exhibits132: Inclusions checklist
- Exhibits133: Exclusions checklist
- Exhibits134: Currency conversion rates for US$
- Exhibits135: Research methodology
- Exhibits136: Validation techniques employed for market sizing
- Exhibits137: Information sources
- Exhibits138: List of abbreviations
Technavio has been monitoring the cognitive media solutions market and it is poised to grow by $4.49 bn during 2022-2026, decelerating at a CAGR of 27.14% during the forecast period. Our report on the cognitive media solutions market provides a holistic analysis, market size and forecast, trends, growth drivers, and challenges, as well as vendor analysis covering around 25 vendors.
The report offers an up-to-date analysis of the current global market scenario, the latest trends and drivers, and the overall market environment. The market is driven by digital transformation, increasing adoption of technologically advanced mobile devices, and growing demand for data integration and visual analytics.
The cognitive media solutions market analysis includes the end-user segment and geographic landscape.
Technavio's cognitive media solutions market is segmented as below:
By End-user
- SME
- Large enterprises
By Geographical Landscape
- North America
- Europe
- APAC
- The Middle East and Africa
- South America
This study identifies the high utilization of social media as one of the prime reasons driving the cognitive media solutions market growth during the next few years. Also, the introduction of next-generation networks and the evolution of programmatic advertisement buying will lead to sizable demand in the market.
Technavio presents a detailed picture of the market by the way of study, synthesis, and summation of data from multiple sources by an analysis of key parameters. Our report on the cognitive media solutions market covers the following areas:
- Cognitive media solutions market sizing
- Cognitive media solutions market forecast
- Cognitive media solutions market industry analysis
Technavio's robust vendor analysis is designed to help clients improve their market position, and in line with this, this report provides a detailed analysis of several leading cognitive media solutions market vendors that include Acrolinx GmbH, Adobe Inc., Albert Technologies, Alphabet Inc., Amazon.com Inc., Axle Ai Inc, Baidu Inc, ByteDance Ltd., Cision Ltd, Clarifai Inc., International Business Machines Corp., Kenshoo Ltd. dba Skai, Microsoft Corp., MiQ Digital Ltd, NVIDIA Corp., Phrasee Ltd, Salesforce Inc., SAP SE, SoundHound Inc, Valossa Labs Ltd, and Veritone Inc. Also, the cognitive media solutions market analysis report includes information on upcoming trends and challenges that will influence market growth. This is to help companies strategize and leverage all forthcoming growth opportunities.
The study was conducted using an objective combination of primary and secondary information including inputs from key participants in the industry. The report contains a comprehensive market and vendor landscape in addition to an analysis of the key vendors.
Technavio presents a detailed picture of the market by the way of study, synthesis, and summation of data from multiple sources by an analysis of key parameters such as profit, pricing, competition, and promotions. It presents various market facets by identifying the key industry influencers. The data presented is comprehensive, reliable, and a result of extensive research - both primary and secondary. Technavio's market research reports provide a complete competitive landscape and an in-depth vendor selection methodology and analysis using qualitative and quantitative research to forecast accurate market growth.
Table of Contents
1 Executive Summary
- 1.1 Market overview
- Exhibit 01: Executive Summary - Chart on Market Overview
- Exhibit 02: Executive Summary - Data Table on Market Overview
- Exhibit 03: Executive Summary - Chart on Global Market Characteristics
- Exhibit 04: Executive Summary - Chart on Market By Geographical Landscape
- Exhibit 05: Executive Summary - Chart on Market Segmentation by End-user
- Exhibit 06: Executive Summary - Chart on Incremental Growth
- Exhibit 07: Executive Summary - Data Table on Incremental Growth
- Exhibit 08: Executive Summary - Chart on Vendor Market Positioning
2 Market Landscape
- 2.1 Market ecosystem
- Exhibit 09: Parent market
- Exhibit 10: Market Characteristics
3 Market Sizing
- 3.1 Market definition
- Exhibit 11: Offerings of vendors included in the market definition
- 3.2 Market segment analysis
- Exhibit 12: Market segments
- 3.3 Market size 2021
- 3.4 Market outlook: Forecast for 2021-2026
- Exhibit 13: Chart on Global - Market size and forecast 2021-2026 ($ million)
- Exhibit 14: Data Table on Global - Market size and forecast 2021-2026 ($ million)
- Exhibit 15: Chart on Global Market: Year-over-year growth 2021-2026 (%)
- Exhibit 16: Data Table on Global Market: Year-over-year growth 2021-2026 (%)
4 Five Forces Analysis
- 4.1 Five forces summary
- Exhibit 17: Five forces analysis - Comparison between 2021 and 2026
- 4.2 Bargaining power of buyers
- Exhibit 18: Chart on Bargaining power of buyers - Impact of key factors 2021 and 2026
- 4.3 Bargaining power of suppliers
- Exhibit 19: Bargaining power of suppliers - Impact of key factors in 2021 and 2026
- 4.4 Threat of new entrants
- Exhibit 20: Threat of new entrants - Impact of key factors in 2021 and 2026
- 4.5 Threat of substitutes
- Exhibit 21: Threat of substitutes - Impact of key factors in 2021 and 2026
- 4.6 Threat of rivalry
- Exhibit 22: Threat of rivalry - Impact of key factors in 2021 and 2026
- 4.7 Market condition
- Exhibit 23: Chart on Market condition - Five forces 2021 and 2026
5 Market Segmentation by End-user
- 5.1 Market segments
- Exhibit 24: Chart on End-user - Market share 2021-2026 (%)
- Exhibit 25: Data Table on End-user - Market share 2021-2026 (%)
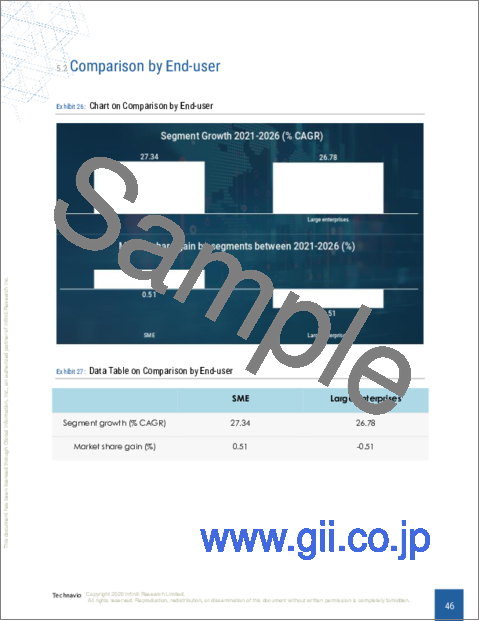
- 5.2 Comparison by End-user
- Exhibit 26: Chart on Comparison by End-user
- Exhibit 27: Data Table on Comparison by End-user
- 5.3 SME - Market size and forecast 2021-2026
- Exhibit 28: Chart on SME - Market size and forecast 2021-2026 ($ million)
- Exhibit 29: Data Table on SME - Market size and forecast 2021-2026 ($ million)
- Exhibit 30: Chart on SME - Year-over-year growth 2021-2026 (%)
- Exhibit 31: Data Table on SME - Year-over-year growth 2021-2026 (%)
- 5.4 Large enterprises - Market size and forecast 2021-2026
- Exhibit 32: Chart on Large enterprises - Market size and forecast 2021-2026 ($ million)
- Exhibit 33: Data Table on Large enterprises - Market size and forecast 2021-2026 ($ million)
- Exhibit 34: Chart on Large enterprises - Year-over-year growth 2021-2026 (%)
- Exhibit 35: Data Table on Large enterprises - Year-over-year growth 2021-2026 (%)
- 5.5 Market opportunity by End-user
- Exhibit 36: Market opportunity by End-user ($ million)
6 Customer Landscape
- 6.1 Customer landscape overview
- Exhibit 37: Analysis of price sensitivity, lifecycle, customer purchase basket, adoption rates, and purchase criteria
7 Geographic Landscape
- 7.1 Geographic segmentation
- Exhibit 38: Chart on Market share By Geographical Landscape 2021-2026 (%)
- Exhibit 39: Data Table on Market share By Geographical Landscape 2021-2026 (%)
- 7.2 Geographic comparison
- Exhibit 40: Chart on Geographic comparison
- Exhibit 41: Data Table on Geographic comparison
- 7.3 North America - Market size and forecast 2021-2026
- Exhibit 42: Chart on North America - Market size and forecast 2021-2026 ($ million)
- Exhibit 43: Data Table on North America - Market size and forecast 2021-2026 ($ million)
- Exhibit 44: Chart on North America - Year-over-year growth 2021-2026 (%)
- Exhibit 45: Data Table on North America - Year-over-year growth 2021-2026 (%)
- 7.4 Europe - Market size and forecast 2021-2026
- Exhibit 46: Chart on Europe - Market size and forecast 2021-2026 ($ million)
- Exhibit 47: Data Table on Europe - Market size and forecast 2021-2026 ($ million)
- Exhibit 48: Chart on Europe - Year-over-year growth 2021-2026 (%)
- Exhibit 49: Data Table on Europe - Year-over-year growth 2021-2026 (%)
- 7.5 APAC - Market size and forecast 2021-2026
- Exhibit 50: Chart on APAC - Market size and forecast 2021-2026 ($ million)
- Exhibit 51: Data Table on APAC - Market size and forecast 2021-2026 ($ million)
- Exhibit 52: Chart on APAC - Year-over-year growth 2021-2026 (%)
- Exhibit 53: Data Table on APAC - Year-over-year growth 2021-2026 (%)
- 7.6 Middle East and Africa - Market size and forecast 2021-2026
- Exhibit 54: Chart on Middle East and Africa - Market size and forecast 2021-2026 ($ million)
- Exhibit 55: Data Table on Middle East and Africa - Market size and forecast 2021-2026 ($ million)
- Exhibit 56: Chart on Middle East and Africa - Year-over-year growth 2021-2026 (%)
- Exhibit 57: Data Table on Middle East and Africa - Year-over-year growth 2021-2026 (%)
- 7.7 South America - Market size and forecast 2021-2026
- Exhibit 58: Chart on South America - Market size and forecast 2021-2026 ($ million)
- Exhibit 59: Data Table on South America - Market size and forecast 2021-2026 ($ million)
- Exhibit 60: Chart on South America - Year-over-year growth 2021-2026 (%)
- Exhibit 61: Data Table on South America - Year-over-year growth 2021-2026 (%)
- 7.8 US - Market size and forecast 2021-2026
- Exhibit 62: Chart on US - Market size and forecast 2021-2026 ($ million)
- Exhibit 63: Data Table on US - Market size and forecast 2021-2026 ($ million)
- Exhibit 64: Chart on US - Year-over-year growth 2021-2026 (%)
- Exhibit 65: Data Table on US - Year-over-year growth 2021-2026 (%)
- 7.9 China - Market size and forecast 2021-2026
- Exhibit 66: Chart on China - Market size and forecast 2021-2026 ($ million)
- Exhibit 67: Data Table on China - Market size and forecast 2021-2026 ($ million)
- Exhibit 68: Chart on China - Year-over-year growth 2021-2026 (%)
- Exhibit 69: Data Table on China - Year-over-year growth 2021-2026 (%)
- 7.10 UK - Market size and forecast 2021-2026
- Exhibit 70: Chart on UK - Market size and forecast 2021-2026 ($ million)
- Exhibit 71: Data Table on UK - Market size and forecast 2021-2026 ($ million)
- Exhibit 72: Chart on UK - Year-over-year growth 2021-2026 (%)
- Exhibit 73: Data Table on UK - Year-over-year growth 2021-2026 (%)
- 7.11 Germany - Market size and forecast 2021-2026
- Exhibit 74: Chart on Germany - Market size and forecast 2021-2026 ($ million)
- Exhibit 75: Data Table on Germany - Market size and forecast 2021-2026 ($ million)
- Exhibit 76: Chart on Germany - Year-over-year growth 2021-2026 (%)
- Exhibit 77: Data Table on Germany - Year-over-year growth 2021-2026 (%)
- 7.12 Japan - Market size and forecast 2021-2026
- Exhibit 78: Chart on Japan - Market size and forecast 2021-2026 ($ million)
- Exhibit 79: Data Table on Japan - Market size and forecast 2021-2026 ($ million)
- Exhibit 80: Chart on Japan - Year-over-year growth 2021-2026 (%)
- Exhibit 81: Data Table on Japan - Year-over-year growth 2021-2026 (%)
- 7.13 Market opportunity By Geographical Landscape
- Exhibit 82: Market opportunity By Geographical Landscape ($ million)
8 Drivers, Challenges, and Trends
- 8.1 Market drivers
- 8.2 Market challenges
- 8.3 Impact of drivers and challenges
- Exhibit 83: Impact of drivers and challenges in 2021 and 2026
- 8.4 Market trends
9 Vendor Landscape
- 9.1 Overview
- 9.2 Vendor landscape
- Exhibit 84: Overview on Criticality of inputs and Factors of differentiation
- 9.3 Landscape disruption
- Exhibit 85: Overview on factors of disruption
- 9.4 Industry risks
- Exhibit 86: Impact of key risks on business
10 Vendor Analysis
- 10.1 Vendors covered
- Exhibit 87: Vendors covered
- 10.2 Market positioning of vendors
- Exhibit 88: Matrix on vendor position and classification
- 10.3 Adobe Inc.
- Exhibit 89: Adobe Inc. - Overview
- Exhibit 90: Adobe Inc. - Business segments
- Exhibit 91: Adobe Inc. - Key news
- Exhibit 92: Adobe Inc. - Key offerings
- Exhibit 93: Adobe Inc. - Segment focus
- 10.4 Alphabet Inc.
- Exhibit 94: Alphabet Inc. - Overview
- Exhibit 95: Alphabet Inc. - Business segments
- Exhibit 96: Alphabet Inc. - Key news
- Exhibit 97: Alphabet Inc. - Key offerings
- Exhibit 98: Alphabet Inc. - Segment focus
- 10.5 Amazon.com Inc.
- Exhibit 99: Amazon.com Inc. - Overview
- Exhibit 100: Amazon.com Inc. - Business segments
- Exhibit 101: Amazon.com Inc. - Key news
- Exhibit 102: Amazon.com Inc. - Key offerings
- Exhibit 103: Amazon.com Inc. - Segment focus
- 10.6 Baidu Inc
- Exhibit 104: Baidu Inc - Overview
- Exhibit 105: Baidu Inc - Business segments
- Exhibit 106: Baidu Inc - Key offerings
- Exhibit 107: Baidu Inc - Segment focus
- 10.7 Cision Ltd
- Exhibit 108: Cision Ltd - Overview
- Exhibit 109: Cision Ltd - Product / Service
- Exhibit 110: Cision Ltd - Key offerings
- 10.8 International Business Machines Corp.
- Exhibit 111: International Business Machines Corp. - Overview
- Exhibit 112: International Business Machines Corp. - Business segments
- Exhibit 113: International Business Machines Corp. - Key offerings
- Exhibit 114: International Business Machines Corp. - Segment focus
- 10.9 Microsoft Corp.
- Exhibit 115: Microsoft Corp. - Overview
- Exhibit 116: Microsoft Corp. - Business segments
- Exhibit 117: Microsoft Corp. - Key news
- Exhibit 118: Microsoft Corp. - Key offerings
- Exhibit 119: Microsoft Corp. - Segment focus
- 10.10 NVIDIA Corp.
- Exhibit 120: NVIDIA Corp. - Overview
- Exhibit 121: NVIDIA Corp. - Business segments
- Exhibit 122: NVIDIA Corp. - Key news
- Exhibit 123: NVIDIA Corp. - Key offerings
- Exhibit 124: NVIDIA Corp. - Segment focus
- 10.11 Salesforce Inc.
- Exhibit 125: Salesforce Inc. - Overview
- Exhibit 126: Salesforce Inc. - Product / Service
- Exhibit 127: Salesforce Inc. - Key news
- Exhibit 128: Salesforce Inc. - Key offerings
- 10.12 Veritone Inc
- Exhibit 129: Veritone Inc - Overview
- Exhibit 130: Veritone Inc - Product / Service
- Exhibit 131: Veritone Inc - Key offerings
11 Appendix
- 11.1 Scope of the report
- 11.2 Inclusions and exclusions checklist
- Exhibit 132: Inclusions checklist
- Exhibit 133: Exclusions checklist
- 11.3 Currency conversion rates for US$
- Exhibit 134: Currency conversion rates for US$
- 11.4 Research methodology
- Exhibit 135: Research methodology
- Exhibit 136: Validation techniques employed for market sizing
- Exhibit 137: Information sources
- 11.5 List of abbreviations
- Exhibit 138: List of abbreviations
- consulting services: o
- integration services: o
- services: o