|
|
市場調査レポート
商品コード
1557441
子宮マニピュレーターの世界市場 2024-2028Global Uterine Manipulators Market 2024-2028 |
||||||

|
|||||||
カスタマイズ可能
|
|||||||


| 子宮マニピュレーターの世界市場 2024-2028 |
|
出版日: 2024年08月15日
発行: TechNavio
ページ情報: 英文 173 Pages
納期: 即納可能
|

全表示
- 概要
- 図表
- 目次
子宮マニピュレーター市場は2023-2028年に1,810万米ドル、予測期間中のCAGRは3.06%で成長すると予測されています。
当レポートでは、子宮マニピュレーター市場の全体的な分析、市場規模・予測、動向、成長促進要因、課題、約25のベンダーを網羅したベンダー分析などを掲載しています。
現在の市場シナリオ、最新動向と促進要因、市場環境全体に関する最新分析を提供しています。市場を牽引しているのは、子宮摘出手術件数の増加につながる婦人科疾患の高い発生率、子宮マニピュレーターの利点に関する意識の高まり、人口減少リスクの高い女性老年人口の増加などです。
| 市場範囲 | |
|---|---|
| 基準年 | 2024 |
| 終了年 | 2028 |
| 予測期間 | 2024-2028 |
| 成長モメンタム | 加速 |
| 前年比2024年 | 2.97% |
| CAGR | 3.06% |
| 増分額 | 1,810万米ドル |
本調査では、革新的な子宮マニピュレーターの市場開拓が、今後数年間の子宮マニピュレーター市場成長を牽引する主要因の一つであると分析しています。また、さまざまな婦人科疾患に対する女性の意識の高まりや、新興国におけるヘルスケアシステムの改善も、市場の大きな需要につながると思われます。
目次
第1章 エグゼクティブサマリー
- 市場概要
第2章 市場情勢
- 市場エコシステム
- 市場の特徴
- バリューチェーン分析
第3章 市場規模の評価
- 市場の定義
- 市場セグメント分析
- 市場規模 2023
- 市場の見通し 2023-2028
第4章 市場規模実績
- 子宮マニピュレーターの世界市場 2018-2022
- タイプ別セグメント分析 2018-2022
- エンドユーザー別セグメント分析 2018-2022
- 地域別セグメント分析 2018-2022
- 国別セグメント分析 2018-2022
第5章 ファイブフォース分析
- ファイブフォースの要約
- 買い手の交渉力
- 供給企業の交渉力
- 新規参入業者の脅威
- 代替品の脅威
- 競争の脅威
- 市況
第6章 市場セグメンテーション:タイプ別
- 市場セグメンテーション
- 比較:タイプ別
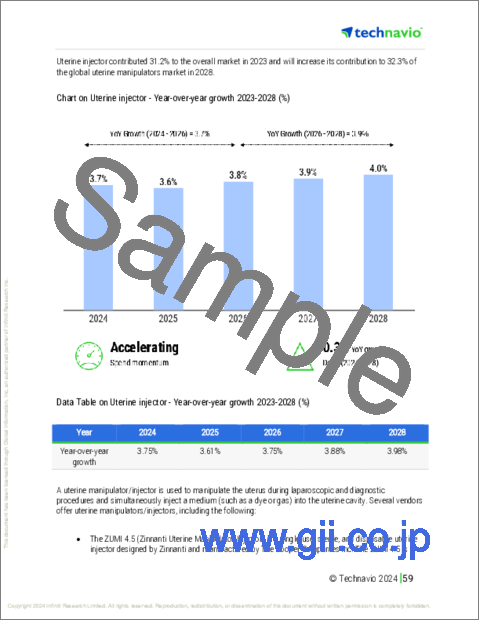
- 子宮注射器:市場規模と予測 2023-2028
- マンゲシカール:市場規模と予測 2023-2028
- クレルモンフェラン:市場規模と予測 2023-2028
- VECTEC:市場規模と予測 2023-2028
- その他:市場規模と予測 2023-2028
- 市場機会:タイプ別
第7章 市場セグメンテーション:エンドユーザー別
- 市場セグメンテーション
- 比較:エンドユーザー別
- 専門クリニック:市場規模と予測 2023-2028
- 病院:市場規模と予測 2023-2028
- 外来手術センター:市場規模と予測 2023-2028
- 市場機会:エンドユーザー別
第8章 顧客情勢
- 顧客情勢の概要
第9章 地域別情勢
- 地域別セグメンテーション
- 地域別比較
- 北米:市場規模と予測 2023-2028
- 欧州:市場規模と予測 2023-2028
- アジア:市場規模と予測 2023-2028
- 世界のその他の地域:市場規模と予測 2023-2028
- 米国:市場規模と予測 2023-2028
- 中国:市場規模と予測 2023-2028
- ドイツ:市場規模と予測 2023-2028
- 日本:市場規模と予測 2023-2028
- フランス:市場規模と予測 2023-2028
- 市場機会:地域情勢別
第10章 促進要因・課題・機会・抑制要因
- 市場促進要因
- 市場の課題
- 促進要因と課題の影響
- 市場の機会・抑制要因
第11章 競合情勢
- 概要
- 競合情勢
- 混乱の状況
- 業界のリスク
第12章 競合分析
- 企業プロファイル
- 企業の市場ポジショニング
- B.Braun SE
- Conmed Corp.
- Golden Nimbus International
- Gunter Bissinger Medizintechnik GmbH
- KARL STORZ SE and Co. KG
- Laborie Medical Technologies Corp.
- LiNA Medical APS
- LSI Solutions Inc.
- Pacific Surgical Holdings Ltd.
- Peters Surgical
- Purple Surgical
- Richard Wolf GmbH
- RUDOLF Medical GmbH Co. KG
- The Cooper Companies Inc.
- Utah Medical Products Inc.
第13章 付録
Exhibits:
- Exhibits1: Executive Summary - Chart on Market Overview
- Exhibits2: Executive Summary - Data Table on Market Overview
- Exhibits3: Executive Summary - Chart on Global Market Characteristics
- Exhibits4: Executive Summary - Chart on Market By Geographical Landscape
- Exhibits5: Executive Summary - Chart on Market Segmentation by Type
- Exhibits6: Executive Summary - Chart on Market Segmentation by End-user
- Exhibits7: Executive Summary - Chart on Incremental Growth
- Exhibits8: Executive Summary - Data Table on Incremental Growth
- Exhibits9: Executive Summary - Chart on Company Market Positioning
- Exhibits10: Parent Market
- Exhibits11: Data Table on - Parent Market
- Exhibits12: Market characteristics analysis
- Exhibits13: Value Chain Analysis
- Exhibits14: Offerings of companies included in the market definition
- Exhibits15: Market segments
- Exhibits16: Chart on Global - Market size and forecast 2023-2028 ($ million)
- Exhibits17: Data Table on Global - Market size and forecast 2023-2028 ($ million)
- Exhibits18: Chart on Global Market: Year-over-year growth 2023-2028 (%)
- Exhibits19: Data Table on Global Market: Year-over-year growth 2023-2028 (%)
- Exhibits20: Historic Market Size - Data Table on Global Uterine Manipulators Market 2018 - 2022 ($ million)
- Exhibits21: Historic Market Size - Type Segment 2018 - 2022 ($ million)
- Exhibits22: Historic Market Size - End-user Segment 2018 - 2022 ($ million)
- Exhibits23: Historic Market Size - Geography Segment 2018 - 2022 ($ million)
- Exhibits24: Historic Market Size - Country Segment 2018 - 2022 ($ million)
- Exhibits25: Five forces analysis - Comparison between 2023 and 2028
- Exhibits26: Bargaining power of buyers - Impact of key factors 2023 and 2028
- Exhibits27: Bargaining power of suppliers - Impact of key factors in 2023 and 2028
- Exhibits28: Threat of new entrants - Impact of key factors in 2023 and 2028
- Exhibits29: Threat of substitutes - Impact of key factors in 2023 and 2028
- Exhibits30: Threat of rivalry - Impact of key factors in 2023 and 2028
- Exhibits31: Chart on Market condition - Five forces 2023 and 2028
- Exhibits32: Chart on Type - Market share 2023-2028 (%)
- Exhibits33: Data Table on Type - Market share 2023-2028 (%)
- Exhibits34: Chart on Comparison by Type
- Exhibits35: Data Table on Comparison by Type
- Exhibits36: Chart on Uterine injector - Market size and forecast 2023-2028 ($ million)
- Exhibits37: Data Table on Uterine injector - Market size and forecast 2023-2028 ($ million)
- Exhibits38: Chart on Uterine injector - Year-over-year growth 2023-2028 (%)
- Exhibits39: Data Table on Uterine injector - Year-over-year growth 2023-2028 (%)
- Exhibits40: Chart on Mangeshikar - Market size and forecast 2023-2028 ($ million)
- Exhibits41: Data Table on Mangeshikar - Market size and forecast 2023-2028 ($ million)
- Exhibits42: Chart on Mangeshikar - Year-over-year growth 2023-2028 (%)
- Exhibits43: Data Table on Mangeshikar - Year-over-year growth 2023-2028 (%)
- Exhibits44: Chart on Clermont ferrand - Market size and forecast 2023-2028 ($ million)
- Exhibits45: Data Table on Clermont ferrand - Market size and forecast 2023-2028 ($ million)
- Exhibits46: Chart on Clermont ferrand - Year-over-year growth 2023-2028 (%)
- Exhibits47: Data Table on Clermont ferrand - Year-over-year growth 2023-2028 (%)
- Exhibits48: Chart on VECTEC - Market size and forecast 2023-2028 ($ million)
- Exhibits49: Data Table on VECTEC - Market size and forecast 2023-2028 ($ million)
- Exhibits50: Chart on VECTEC - Year-over-year growth 2023-2028 (%)
- Exhibits51: Data Table on VECTEC - Year-over-year growth 2023-2028 (%)
- Exhibits52: Chart on Others - Market size and forecast 2023-2028 ($ million)
- Exhibits53: Data Table on Others - Market size and forecast 2023-2028 ($ million)
- Exhibits54: Chart on Others - Year-over-year growth 2023-2028 (%)
- Exhibits55: Data Table on Others - Year-over-year growth 2023-2028 (%)
- Exhibits56: Market opportunity by Type ($ million)
- Exhibits57: Data Table on Market opportunity by Type ($ million)
- Exhibits58: Chart on End-user - Market share 2023-2028 (%)
- Exhibits59: Data Table on End-user - Market share 2023-2028 (%)
- Exhibits60: Chart on Comparison by End-user
- Exhibits61: Data Table on Comparison by End-user
- Exhibits62: Chart on Specialty clinics - Market size and forecast 2023-2028 ($ million)
- Exhibits63: Data Table on Specialty clinics - Market size and forecast 2023-2028 ($ million)
- Exhibits64: Chart on Specialty clinics - Year-over-year growth 2023-2028 (%)
- Exhibits65: Data Table on Specialty clinics - Year-over-year growth 2023-2028 (%)
- Exhibits66: Chart on Hospitals - Market size and forecast 2023-2028 ($ million)
- Exhibits67: Data Table on Hospitals - Market size and forecast 2023-2028 ($ million)
- Exhibits68: Chart on Hospitals - Year-over-year growth 2023-2028 (%)
- Exhibits69: Data Table on Hospitals - Year-over-year growth 2023-2028 (%)
- Exhibits70: Chart on Ambulatory surgical centers - Market size and forecast 2023-2028 ($ million)
- Exhibits71: Data Table on Ambulatory surgical centers - Market size and forecast 2023-2028 ($ million)
- Exhibits72: Chart on Ambulatory surgical centers - Year-over-year growth 2023-2028 (%)
- Exhibits73: Data Table on Ambulatory surgical centers - Year-over-year growth 2023-2028 (%)
- Exhibits74: Market opportunity by End-user ($ million)
- Exhibits75: Data Table on Market opportunity by End-user ($ million)
- Exhibits76: Analysis of price sensitivity, lifecycle, customer purchase basket, adoption rates, and purchase criteria
- Exhibits77: Chart on Market share By Geographical Landscape 2023-2028 (%)
- Exhibits78: Data Table on Market share By Geographical Landscape 2023-2028 (%)
- Exhibits79: Chart on Geographic comparison
- Exhibits80: Data Table on Geographic comparison
- Exhibits81: Chart on North America - Market size and forecast 2023-2028 ($ million)
- Exhibits82: Data Table on North America - Market size and forecast 2023-2028 ($ million)
- Exhibits83: Chart on North America - Year-over-year growth 2023-2028 (%)
- Exhibits84: Data Table on North America - Year-over-year growth 2023-2028 (%)
- Exhibits85: Chart on Europe - Market size and forecast 2023-2028 ($ million)
- Exhibits86: Data Table on Europe - Market size and forecast 2023-2028 ($ million)
- Exhibits87: Chart on Europe - Year-over-year growth 2023-2028 (%)
- Exhibits88: Data Table on Europe - Year-over-year growth 2023-2028 (%)
- Exhibits89: Chart on Asia - Market size and forecast 2023-2028 ($ million)
- Exhibits90: Data Table on Asia - Market size and forecast 2023-2028 ($ million)
- Exhibits91: Chart on Asia - Year-over-year growth 2023-2028 (%)
- Exhibits92: Data Table on Asia - Year-over-year growth 2023-2028 (%)
- Exhibits93: Chart on Rest of World (ROW) - Market size and forecast 2023-2028 ($ million)
- Exhibits94: Data Table on Rest of World (ROW) - Market size and forecast 2023-2028 ($ million)
- Exhibits95: Chart on Rest of World (ROW) - Year-over-year growth 2023-2028 (%)
- Exhibits96: Data Table on Rest of World (ROW) - Year-over-year growth 2023-2028 (%)
- Exhibits97: Chart on US - Market size and forecast 2023-2028 ($ million)
- Exhibits98: Data Table on US - Market size and forecast 2023-2028 ($ million)
- Exhibits99: Chart on US - Year-over-year growth 2023-2028 (%)
- Exhibits100: Data Table on US - Year-over-year growth 2023-2028 (%)
- Exhibits101: Chart on China - Market size and forecast 2023-2028 ($ million)
- Exhibits102: Data Table on China - Market size and forecast 2023-2028 ($ million)
- Exhibits103: Chart on China - Year-over-year growth 2023-2028 (%)
- Exhibits104: Data Table on China - Year-over-year growth 2023-2028 (%)
- Exhibits105: Chart on Germany - Market size and forecast 2023-2028 ($ million)
- Exhibits106: Data Table on Germany - Market size and forecast 2023-2028 ($ million)
- Exhibits107: Chart on Germany - Year-over-year growth 2023-2028 (%)
- Exhibits108: Data Table on Germany - Year-over-year growth 2023-2028 (%)
- Exhibits109: Chart on Japan - Market size and forecast 2023-2028 ($ million)
- Exhibits110: Data Table on Japan - Market size and forecast 2023-2028 ($ million)
- Exhibits111: Chart on Japan - Year-over-year growth 2023-2028 (%)
- Exhibits112: Data Table on Japan - Year-over-year growth 2023-2028 (%)
- Exhibits113: Chart on France - Market size and forecast 2023-2028 ($ million)
- Exhibits114: Data Table on France - Market size and forecast 2023-2028 ($ million)
- Exhibits115: Chart on France - Year-over-year growth 2023-2028 (%)
- Exhibits116: Data Table on France - Year-over-year growth 2023-2028 (%)
- Exhibits117: Market opportunity By Geographical Landscape ($ million)
- Exhibits118: Data Tables on Market opportunity By Geographical Landscape ($ million)
- Exhibits119: Impact of drivers and challenges in 2023 and 2028
- Exhibits120: Overview on criticality of inputs and factors of differentiation
- Exhibits121: Overview on factors of disruption
- Exhibits122: Impact of key risks on business
- Exhibits123: Companies covered
- Exhibits124: Matrix on companies position and classification
- Exhibits125: B.Braun SE - Overview
- Exhibits126: B.Braun SE - Business segments
- Exhibits127: B.Braun SE - Key news
- Exhibits128: B.Braun SE - Key offerings
- Exhibits129: B.Braun SE - Segment focus
- Exhibits130: Conmed Corp. - Overview
- Exhibits131: Conmed Corp. - Business segments
- Exhibits132: Conmed Corp. - Key offerings
- Exhibits133: Conmed Corp. - Segment focus
- Exhibits134: Golden Nimbus International - Overview
- Exhibits135: Golden Nimbus International - Product / Service
- Exhibits136: Golden Nimbus International - Key offerings
- Exhibits137: Gunter Bissinger Medizintechnik GmbH - Overview
- Exhibits138: Gunter Bissinger Medizintechnik GmbH - Product / Service
- Exhibits139: Gunter Bissinger Medizintechnik GmbH - Key offerings
- Exhibits140: KARL STORZ SE and Co. KG - Overview
- Exhibits141: KARL STORZ SE and Co. KG - Product / Service
- Exhibits142: KARL STORZ SE and Co. KG - Key news
- Exhibits143: KARL STORZ SE and Co. KG - Key offerings
- Exhibits144: Laborie Medical Technologies Corp. - Overview
- Exhibits145: Laborie Medical Technologies Corp. - Product / Service
- Exhibits146: Laborie Medical Technologies Corp. - Key news
- Exhibits147: Laborie Medical Technologies Corp. - Key offerings
- Exhibits148: LiNA Medical APS - Overview
- Exhibits149: LiNA Medical APS - Product / Service
- Exhibits150: LiNA Medical APS - Key offerings
- Exhibits151: LSI Solutions Inc. - Overview
- Exhibits152: LSI Solutions Inc. - Product / Service
- Exhibits153: LSI Solutions Inc. - Key offerings
- Exhibits154: Pacific Surgical Holdings Ltd. - Overview
- Exhibits155: Pacific Surgical Holdings Ltd. - Product / Service
- Exhibits156: Pacific Surgical Holdings Ltd. - Key offerings
- Exhibits157: Peters Surgical - Overview
- Exhibits158: Peters Surgical - Product / Service
- Exhibits159: Peters Surgical - Key offerings
- Exhibits160: Purple Surgical - Overview
- Exhibits161: Purple Surgical - Product / Service
- Exhibits162: Purple Surgical - Key offerings
- Exhibits163: Richard Wolf GmbH - Overview
- Exhibits164: Richard Wolf GmbH - Product / Service
- Exhibits165: Richard Wolf GmbH - Key offerings
- Exhibits166: RUDOLF Medical GmbH Co. KG - Overview
- Exhibits167: RUDOLF Medical GmbH Co. KG - Product / Service
- Exhibits168: RUDOLF Medical GmbH Co. KG - Key offerings
- Exhibits169: The Cooper Companies Inc. - Overview
- Exhibits170: The Cooper Companies Inc. - Product / Service
- Exhibits171: The Cooper Companies Inc. - Key offerings
- Exhibits172: Utah Medical Products Inc. - Overview
- Exhibits173: Utah Medical Products Inc. - Product / Service
- Exhibits174: Utah Medical Products Inc. - Key offerings
- Exhibits175: Inclusions checklist
- Exhibits176: Exclusions checklist
- Exhibits177: Currency conversion rates for US$
- Exhibits178: Research methodology
- Exhibits179: Information sources
- Exhibits180: Data validation
- Exhibits181: Validation techniques employed for market sizing
- Exhibits182: Data synthesis
- Exhibits183: 360 degree market analysis
- Exhibits184: List of abbreviations
The uterine manipulators market is forecasted to grow by USD 18.1 mn during 2023-2028, accelerating at a CAGR of 3.06% during the forecast period. The report on the uterine manipulators market provides a holistic analysis, market size and forecast, trends, growth drivers, and challenges, as well as vendor analysis covering around 25 vendors.
The report offers an up-to-date analysis regarding the current market scenario, the latest trends and drivers, and the overall market environment. The market is driven by high incidence of gynecological diseases leading to rise in number of hysterectomies, rising awareness about benefits of uterine manipulators, and rise in female geriatric population with high risk of pop.
Technavio's uterine manipulators market is segmented as below:
| Market Scope | |
|---|---|
| Base Year | 2024 |
| End Year | 2028 |
| Series Year | 2024-2028 |
| Growth Momentum | Accelerate |
| YOY 2024 | 2.97% |
| CAGR | 3.06% |
| Incremental Value | $18.1 mn |
By Type
- Uterine injector
- Mangeshikar
- Clermont ferrand
- VECTEC
- Others
By End-user
- Specialty clinics
- Hospitals
- Ambulatory surgical centers
By Geographical Landscape
- North America
- Europe
- Asia
- Rest of World (ROW)
This study identifies the development of innovative uterine manipulators as one of the prime reasons driving the uterine manipulators market growth during the next few years. Also, increasing awareness among women about different gynecological diseases and improving healthcare systems in emerging economies will lead to sizable demand in the market.
The report on the uterine manipulators market covers the following areas:
- Uterine manipulators market sizing
- Uterine manipulators market forecast
- Uterine manipulators market industry analysis
The robust vendor analysis is designed to help clients improve their market position, and in line with this, this report provides a detailed analysis of several leading uterine manipulators market vendors that include Advin Health Care, Aspen Surgical Products Inc., B.Braun SE, Cliniva Healthcare, Conmed Corp., Girish Surgical Works, Golden Nimbus International, Gunter Bissinger Medizintechnik GmbH, KARL STORZ SE and Co. KG, Laborie, LiNA Medical APS, LSI Solutions Inc., Pacific Surgical Holdings Ltd., Peters Surgical, Purple Surgical, Richard Wolf GmbH, RUDOLF Medical GmbH Co. KG, S I Surgical Pvt. Ltd., The Cooper Companies Inc., and Utah Medical Products Inc.. Also, the uterine manipulators market analysis report includes information on upcoming trends and challenges that will influence market growth. This is to help companies strategize and leverage all forthcoming growth opportunities.
The study was conducted using an objective combination of primary and secondary information including inputs from key participants in the industry. The report contains a comprehensive market and vendor landscape in addition to an analysis of the key vendors.
The publisher presents a detailed picture of the market by the way of study, synthesis, and summation of data from multiple sources by an analysis of key parameters such as profit, pricing, competition, and promotions. It presents various market facets by identifying the key industry influencers. The data presented is comprehensive, reliable, and a result of extensive research - both primary and secondary. The market research reports provide a complete competitive landscape and an in-depth vendor selection methodology and analysis using qualitative and quantitative research to forecast the accurate market growth.
Table of Contents
1 Executive Summary
- 1.1 Market overview
- Executive Summary - Chart on Market Overview
- Executive Summary - Data Table on Market Overview
- Executive Summary - Chart on Global Market Characteristics
- Executive Summary - Chart on Market By Geographical Landscape
- Executive Summary - Chart on Market Segmentation by Type
- Executive Summary - Chart on Market Segmentation by End-user
- Executive Summary - Chart on Incremental Growth
- Executive Summary - Data Table on Incremental Growth
- Executive Summary - Chart on Company Market Positioning
2 Market Landscape
- 2.1 Market ecosystem
- Parent Market
- Data Table on - Parent Market
- 2.2 Market characteristics
- Market characteristics analysis
- 2.3 Value chain analysis
- Value Chain Analysis
3 Market Sizing
- 3.1 Market definition
- Offerings of companies included in the market definition
- 3.2 Market segment analysis
- Market segments
- 3.3 Market size 2023
- 3.4 Market outlook: Forecast for 2023-2028
- Chart on Global - Market size and forecast 2023-2028 ($ million)
- Data Table on Global - Market size and forecast 2023-2028 ($ million)
- Chart on Global Market: Year-over-year growth 2023-2028 (%)
- Data Table on Global Market: Year-over-year growth 2023-2028 (%)
4 Historic Market Size
- 4.1 Global Uterine Manipulators Market 2018 - 2022
- Historic Market Size - Data Table on Global Uterine Manipulators Market 2018 - 2022 ($ million)
- 4.2 Type segment analysis 2018 - 2022
- Historic Market Size - Type Segment 2018 - 2022 ($ million)
- 4.3 End-user segment analysis 2018 - 2022
- Historic Market Size - End-user Segment 2018 - 2022 ($ million)
- 4.4 Geography segment analysis 2018 - 2022
- Historic Market Size - Geography Segment 2018 - 2022 ($ million)
- 4.5 Country segment analysis 2018 - 2022
- Historic Market Size - Country Segment 2018 - 2022 ($ million)
5 Five Forces Analysis
- 5.1 Five forces summary
- Five forces analysis - Comparison between 2023 and 2028
- 5.2 Bargaining power of buyers
- Bargaining power of buyers - Impact of key factors 2023 and 2028
- 5.3 Bargaining power of suppliers
- Bargaining power of suppliers - Impact of key factors in 2023 and 2028
- 5.4 Threat of new entrants
- Threat of new entrants - Impact of key factors in 2023 and 2028
- 5.5 Threat of substitutes
- Threat of substitutes - Impact of key factors in 2023 and 2028
- 5.6 Threat of rivalry
- Threat of rivalry - Impact of key factors in 2023 and 2028
- 5.7 Market condition
- Chart on Market condition - Five forces 2023 and 2028
6 Market Segmentation by Type
- 6.1 Market segments
- Chart on Type - Market share 2023-2028 (%)
- Data Table on Type - Market share 2023-2028 (%)
- 6.2 Comparison by Type
- Chart on Comparison by Type
- Data Table on Comparison by Type
- 6.3 Uterine injector - Market size and forecast 2023-2028
- Chart on Uterine injector - Market size and forecast 2023-2028 ($ million)
- Data Table on Uterine injector - Market size and forecast 2023-2028 ($ million)
- Chart on Uterine injector - Year-over-year growth 2023-2028 (%)
- Data Table on Uterine injector - Year-over-year growth 2023-2028 (%)
- 6.4 Mangeshikar - Market size and forecast 2023-2028
- Chart on Mangeshikar - Market size and forecast 2023-2028 ($ million)
- Data Table on Mangeshikar - Market size and forecast 2023-2028 ($ million)
- Chart on Mangeshikar - Year-over-year growth 2023-2028 (%)
- Data Table on Mangeshikar - Year-over-year growth 2023-2028 (%)
- 6.5 Clermont ferrand - Market size and forecast 2023-2028
- Chart on Clermont ferrand - Market size and forecast 2023-2028 ($ million)
- Data Table on Clermont ferrand - Market size and forecast 2023-2028 ($ million)
- Chart on Clermont ferrand - Year-over-year growth 2023-2028 (%)
- Data Table on Clermont ferrand - Year-over-year growth 2023-2028 (%)
- 6.6 VECTEC - Market size and forecast 2023-2028
- Chart on VECTEC - Market size and forecast 2023-2028 ($ million)
- Data Table on VECTEC - Market size and forecast 2023-2028 ($ million)
- Chart on VECTEC - Year-over-year growth 2023-2028 (%)
- Data Table on VECTEC - Year-over-year growth 2023-2028 (%)
- 6.7 Others - Market size and forecast 2023-2028
- Chart on Others - Market size and forecast 2023-2028 ($ million)
- Data Table on Others - Market size and forecast 2023-2028 ($ million)
- Chart on Others - Year-over-year growth 2023-2028 (%)
- Data Table on Others - Year-over-year growth 2023-2028 (%)
- 6.8 Market opportunity by Type
- Market opportunity by Type ($ million)
- Data Table on Market opportunity by Type ($ million)
7 Market Segmentation by End-user
- 7.1 Market segments
- Chart on End-user - Market share 2023-2028 (%)
- Data Table on End-user - Market share 2023-2028 (%)
- 7.2 Comparison by End-user
- Chart on Comparison by End-user
- Data Table on Comparison by End-user
- 7.3 Specialty clinics - Market size and forecast 2023-2028
- Chart on Specialty clinics - Market size and forecast 2023-2028 ($ million)
- Data Table on Specialty clinics - Market size and forecast 2023-2028 ($ million)
- Chart on Specialty clinics - Year-over-year growth 2023-2028 (%)
- Data Table on Specialty clinics - Year-over-year growth 2023-2028 (%)
- 7.4 Hospitals - Market size and forecast 2023-2028
- Chart on Hospitals - Market size and forecast 2023-2028 ($ million)
- Data Table on Hospitals - Market size and forecast 2023-2028 ($ million)
- Chart on Hospitals - Year-over-year growth 2023-2028 (%)
- Data Table on Hospitals - Year-over-year growth 2023-2028 (%)
- 7.5 Ambulatory surgical centers - Market size and forecast 2023-2028
- Chart on Ambulatory surgical centers - Market size and forecast 2023-2028 ($ million)
- Data Table on Ambulatory surgical centers - Market size and forecast 2023-2028 ($ million)
- Chart on Ambulatory surgical centers - Year-over-year growth 2023-2028 (%)
- Data Table on Ambulatory surgical centers - Year-over-year growth 2023-2028 (%)
- 7.6 Market opportunity by End-user
- Market opportunity by End-user ($ million)
- Data Table on Market opportunity by End-user ($ million)
8 Customer Landscape
- 8.1 Customer landscape overview
- Analysis of price sensitivity, lifecycle, customer purchase basket, adoption rates, and purchase criteria
9 Geographic Landscape
- 9.1 Geographic segmentation
- Chart on Market share By Geographical Landscape 2023-2028 (%)
- Data Table on Market share By Geographical Landscape 2023-2028 (%)
- 9.2 Geographic comparison
- Chart on Geographic comparison
- Data Table on Geographic comparison
- 9.3 North America - Market size and forecast 2023-2028
- Chart on North America - Market size and forecast 2023-2028 ($ million)
- Data Table on North America - Market size and forecast 2023-2028 ($ million)
- Chart on North America - Year-over-year growth 2023-2028 (%)
- Data Table on North America - Year-over-year growth 2023-2028 (%)
- 9.4 Europe - Market size and forecast 2023-2028
- Chart on Europe - Market size and forecast 2023-2028 ($ million)
- Data Table on Europe - Market size and forecast 2023-2028 ($ million)
- Chart on Europe - Year-over-year growth 2023-2028 (%)
- Data Table on Europe - Year-over-year growth 2023-2028 (%)
- 9.5 Asia - Market size and forecast 2023-2028
- Chart on Asia - Market size and forecast 2023-2028 ($ million)
- Data Table on Asia - Market size and forecast 2023-2028 ($ million)
- Chart on Asia - Year-over-year growth 2023-2028 (%)
- Data Table on Asia - Year-over-year growth 2023-2028 (%)
- 9.6 Rest of World (ROW) - Market size and forecast 2023-2028
- Chart on Rest of World (ROW) - Market size and forecast 2023-2028 ($ million)
- Data Table on Rest of World (ROW) - Market size and forecast 2023-2028 ($ million)
- Chart on Rest of World (ROW) - Year-over-year growth 2023-2028 (%)
- Data Table on Rest of World (ROW) - Year-over-year growth 2023-2028 (%)
- 9.7 US - Market size and forecast 2023-2028
- Chart on US - Market size and forecast 2023-2028 ($ million)
- Data Table on US - Market size and forecast 2023-2028 ($ million)
- Chart on US - Year-over-year growth 2023-2028 (%)
- Data Table on US - Year-over-year growth 2023-2028 (%)
- 9.8 China - Market size and forecast 2023-2028
- Chart on China - Market size and forecast 2023-2028 ($ million)
- Data Table on China - Market size and forecast 2023-2028 ($ million)
- Chart on China - Year-over-year growth 2023-2028 (%)
- Data Table on China - Year-over-year growth 2023-2028 (%)
- 9.9 Germany - Market size and forecast 2023-2028
- Chart on Germany - Market size and forecast 2023-2028 ($ million)
- Data Table on Germany - Market size and forecast 2023-2028 ($ million)
- Chart on Germany - Year-over-year growth 2023-2028 (%)
- Data Table on Germany - Year-over-year growth 2023-2028 (%)
- 9.10 Japan - Market size and forecast 2023-2028
- Chart on Japan - Market size and forecast 2023-2028 ($ million)
- Data Table on Japan - Market size and forecast 2023-2028 ($ million)
- Chart on Japan - Year-over-year growth 2023-2028 (%)
- Data Table on Japan - Year-over-year growth 2023-2028 (%)
- 9.11 France - Market size and forecast 2023-2028
- Chart on France - Market size and forecast 2023-2028 ($ million)
- Data Table on France - Market size and forecast 2023-2028 ($ million)
- Chart on France - Year-over-year growth 2023-2028 (%)
- Data Table on France - Year-over-year growth 2023-2028 (%)
- 9.12 Market opportunity By Geographical Landscape
- Market opportunity By Geographical Landscape ($ million)
- Data Tables on Market opportunity By Geographical Landscape ($ million)
10 Drivers, Challenges, and Opportunity/Restraints
- 10.1 Market drivers
- 10.2 Market challenges
- 10.3 Impact of drivers and challenges
- Impact of drivers and challenges in 2023 and 2028
- 10.4 Market opportunities/restraints
11 Competitive Landscape
- 11.1 Overview
- 11.2 Competitive Landscape
- Overview on criticality of inputs and factors of differentiation
- 11.3 Landscape disruption
- Overview on factors of disruption
- 11.4 Industry risks
- Impact of key risks on business
12 Competitive Analysis
- 12.1 Companies profiled
- Companies covered
- 12.2 Market positioning of companies
- Matrix on companies position and classification
- 12.3 B.Braun SE
- B.Braun SE - Overview
- B.Braun SE - Business segments
- B.Braun SE - Key news
- B.Braun SE - Key offerings
- B.Braun SE - Segment focus
- 12.4 Conmed Corp.
- Conmed Corp. - Overview
- Conmed Corp. - Business segments
- Conmed Corp. - Key offerings
- Conmed Corp. - Segment focus
- 12.5 Golden Nimbus International
- Golden Nimbus International - Overview
- Golden Nimbus International - Product / Service
- Golden Nimbus International - Key offerings
- 12.6 Gunter Bissinger Medizintechnik GmbH
- Gunter Bissinger Medizintechnik GmbH - Overview
- Gunter Bissinger Medizintechnik GmbH - Product / Service
- Gunter Bissinger Medizintechnik GmbH - Key offerings
- 12.7 KARL STORZ SE and Co. KG
- KARL STORZ SE and Co. KG - Overview
- KARL STORZ SE and Co. KG - Product / Service
- KARL STORZ SE and Co. KG - Key news
- KARL STORZ SE and Co. KG - Key offerings
- 12.8 Laborie Medical Technologies Corp.
- Laborie Medical Technologies Corp. - Overview
- Laborie Medical Technologies Corp. - Product / Service
- Laborie Medical Technologies Corp. - Key news
- Laborie Medical Technologies Corp. - Key offerings
- 12.9 LiNA Medical APS
- LiNA Medical APS - Overview
- LiNA Medical APS - Product / Service
- LiNA Medical APS - Key offerings
- 12.10 LSI Solutions Inc.
- LSI Solutions Inc. - Overview
- LSI Solutions Inc. - Product / Service
- LSI Solutions Inc. - Key offerings
- 12.11 Pacific Surgical Holdings Ltd.
- Pacific Surgical Holdings Ltd. - Overview
- Pacific Surgical Holdings Ltd. - Product / Service
- Pacific Surgical Holdings Ltd. - Key offerings
- 12.12 Peters Surgical
- Peters Surgical - Overview
- Peters Surgical - Product / Service
- Peters Surgical - Key offerings
- 12.13 Purple Surgical
- Purple Surgical - Overview
- Purple Surgical - Product / Service
- Purple Surgical - Key offerings
- 12.14 Richard Wolf GmbH
- Richard Wolf GmbH - Overview
- Richard Wolf GmbH - Product / Service
- Richard Wolf GmbH - Key offerings
- 12.15 RUDOLF Medical GmbH Co. KG
- RUDOLF Medical GmbH Co. KG - Overview
- RUDOLF Medical GmbH Co. KG - Product / Service
- RUDOLF Medical GmbH Co. KG - Key offerings
- 12.16 The Cooper Companies Inc.
- The Cooper Companies Inc. - Overview
- The Cooper Companies Inc. - Product / Service
- The Cooper Companies Inc. - Key offerings
- 12.17 Utah Medical Products Inc.
- Utah Medical Products Inc. - Overview
- Utah Medical Products Inc. - Product / Service
- Utah Medical Products Inc. - Key offerings
13 Appendix
- 13.1 Scope of the report
- 13.2 Inclusions and exclusions checklist
- Inclusions checklist
- Exclusions checklist
- 13.3 Currency conversion rates for US$
- Currency conversion rates for US$
- 13.4 Research methodology
- Research methodology
- 13.5 Data procurement
- Information sources
- 13.6 Data validation
- Data validation
- 13.7 Validation techniques employed for market sizing
- Validation techniques employed for market sizing
- 13.8 Data synthesis
- Data synthesis
- 13.9 360 degree market analysis
- 360 degree market analysis
- 13.10 List of abbreviations
- List of abbreviations

