|
|
市場調査レポート
商品コード
1645484
上皮成長因子受容体(EGFR)阻害剤の世界市場 2025~2029年Global Epidermal Growth Factor Receptor (EGFR) Inhibitors Market 2025-2029 |
||||||

|
|||||||
カスタマイズ可能
|
|||||||


| 上皮成長因子受容体(EGFR)阻害剤の世界市場 2025~2029年 |
|
出版日: 2025年01月11日
発行: TechNavio
ページ情報: 英文 203 Pages
納期: 即納可能
|

全表示
- 概要
- 図表
- 目次
上皮成長因子受容体(EGFR)阻害剤市場は2024~2029年に107億3,250万米ドル、予測期間中のCAGRは10.5%で成長すると予測されます。
当レポートでは、上皮成長因子受容体(EGFR)阻害剤市場の全体的な分析、市場規模・予測、動向、成長促進要因、課題、約25のベンダーを網羅したベンダー分析などを掲載しています。
現在の市場シナリオ、最新動向と促進要因、市場環境全体に関する最新分析を提供しています。市場は、主要ながん適応症の有病率の上昇、個別化医療に対する認識と導入の増加、技術と研究の進歩によって牽引されています。
| 市場範囲 | |
|---|---|
| 基準年 | 2025年 |
| 終了年 | 2029年 |
| 予測期間 | 2025~2029年 |
| 成長モメンタム | 加速 |
| 前年比[2025年] | 9.4% |
| CAGR | 10.5% |
| 増分額 | 107億3,250万米ドル |
本調査では、今後数年間における上皮成長因子受容体(EGFR)阻害剤市場の成長を促進する主要要因の1つとして、さまざまな種類のがんを治療するための調査セグメントの増加を挙げています。また、医薬品パイプラインの増加や償還プログラムの増加は、市場の大きな需要につながります。
目次
第1章 エグゼクティブサマリー
- 市場概要
第2章 Technavio分析
- 価格・ライフサイクル・顧客購入バスケット・採用率・購入基準の分析
- インプットの重要性と差別化の要因
- 混乱の要因
- 促進要因と課題の影響
第3章 市場情勢
- 市場エコシステム
- 市場の特徴
- バリューチェーン分析
第4章 市場規模
- 市場の定義
- 市場セグメント分析
- 市場規模 2024年
- 市場の展望 2024~2029年
第5章 市場規模実績
- 上皮成長因子受容体(EGFR)阻害剤の世界市場 2019~2023年
- 適応症セグメント分析 2019~2023年
- 流通チャネル別セグメント分析 2019~2023年
- 地域別セグメント分析 2019~2023年
- 国別セグメント分析 2019~2023年
第6章 定性分析
- AIの影響:上皮成長因子受容体(EGFR)阻害剤の世界市場
第7章 ファイブフォース分析
- ファイブフォースの要約
- 買い手の交渉力
- 供給企業の交渉力
- 新規参入業者の脅威
- 代替品の脅威
- 競争の脅威
- 市況
第8章 市場セグメンテーション:適応症別
- 市場セグメント
- 比較:適応症別
- 肺がん:市場規模と予測 2024~2029年
- 大腸がん:市場規模と予測 2024~2029年
- 乳がん:市場規模と予測 2024~2029年
- その他:市場規模と予測 2024~2029年
- 市場機会適応症別
第9章 市場セグメンテーション:流通チャネル別
- 市場セグメント
- 比較:流通チャネル別
- 小売薬局:市場規模と予測 2024~2029年
- 病院薬局:市場規模と予測 2024~2029年
- オンライン薬局:市場規模と予測 2024~2029年
- 市場機会:流通チャネル別
第10章 顧客情勢
- 顧客情勢概要
第11章 地域別情勢
- 地域別セグメンテーション
- 比較:地域別
- 北米:市場規模と予測 2024~2029年
- 欧州:市場規模と予測 2024~2029年
- アジア:市場規模と予測 2024~2029年
- その他:市場規模と予測 2024~2029年
- 米国:市場規模と予測 2024~2029年
- ドイツ:市場規模と予測 2024~2029年
- 英国:市場規模と予測 2024~2029年
- インド:市場規模と予測 2024~2029年
- 中国:市場規模と予測 2024~2029年
- カナダ:市場規模と予測 2024~2029年
- 韓国:市場規模と予測 2024~2029年
- フランス:市場規模と予測 2024~2029年
- 日本:市場規模と予測 2024~2029年
- イタリア:市場規模と予測 2024~2029年
- 地域情勢による市場機会
第12章 促進要因・課題・機会・抑制要因
- 市場促進要因
- 市場課題
- 促進要因と課題の影響
- 市場機会・抑制要因
第13章 競合情勢
- 概要
- 競合情勢
- 混乱の状況
- 産業のリスク
第14章 競合分析
- 企業プロファイル
- 企業ランキング指数
- 企業の市場ポジショニング
- Amgen Inc.
- ASSERTIO HOLDINGS INC.
- AstraZeneca Plc
- Boehringer Ingelheim International GmbH
- Bristol Myers Squibb Co.
- Checkpoint Therapeutics Inc.
- Eli Lilly and Co.
- F. Hoffmann La Roche Ltd.
- Jiangsu Hengrui Pharmaceuticals Co. Ltd.
- Johnson and Johnson Inc.
- Novartis AG
- Otsuka Holdings Co. Ltd.
- Pfizer Inc.
- Puma BIoTechnology Inc.
- Takeda Pharmaceutical Co. Ltd.
第15章 付録
Exhibits:
- Exhibits1: Executive Summary - Chart on Market Overview
- Exhibits2: Executive Summary - Data Table on Market Overview
- Exhibits3: Executive Summary - Chart on Global Market Characteristics
- Exhibits4: Executive Summary - Chart on Market By Geographical Landscape
- Exhibits5: Executive Summary - Chart on Market Segmentation by Indication
- Exhibits6: Executive Summary - Chart on Market Segmentation by Distribution Channel
- Exhibits7: Executive Summary - Chart on Incremental Growth
- Exhibits8: Executive Summary - Data Table on Incremental Growth
- Exhibits9: Executive Summary - Chart on Company Market Positioning
- Exhibits10: Analysis of price sensitivity, lifecycle, customer purchase basket, adoption rates, and purchase criteria
- Exhibits11: Overview on criticality of inputs and factors of differentiation
- Exhibits12: Overview on factors of disruption
- Exhibits13: Impact of drivers and challenges in 2024 and 2029
- Exhibits14: Parent Market
- Exhibits15: Data Table on - Parent Market
- Exhibits16: Market characteristics analysis
- Exhibits17: Value chain analysis
- Exhibits18: Offerings of companies included in the market definition
- Exhibits19: Market segments
- Exhibits20: Chart on Global - Market size and forecast 2024-2029 ($ million)
- Exhibits21: Data Table on Global - Market size and forecast 2024-2029 ($ million)
- Exhibits22: Chart on Global Market: Year-over-year growth 2024-2029 (%)
- Exhibits23: Data Table on Global Market: Year-over-year growth 2024-2029 (%)
- Exhibits24: Historic Market Size - Data Table on Global Epidermal Growth Factor Receptor (EGFR) Inhibitors Market 2019 - 2023 ($ million)
- Exhibits25: Historic Market Size - Indication Segment 2019 - 2023 ($ million)
- Exhibits26: Historic Market Size - Distribution Channel Segment 2019 - 2023 ($ million)
- Exhibits27: Historic Market Size - Geography Segment 2019 - 2023 ($ million)
- Exhibits28: Historic Market Size - Country Segment 2019 - 2023 ($ million)
- Exhibits29: Five forces analysis - Comparison between 2024 and 2029
- Exhibits30: Bargaining power of buyers - Impact of key factors 2024 and 2029
- Exhibits31: Bargaining power of suppliers - Impact of key factors in 2024 and 2029
- Exhibits32: Threat of new entrants - Impact of key factors in 2024 and 2029
- Exhibits33: Threat of substitutes - Impact of key factors in 2024 and 2029
- Exhibits34: Threat of rivalry - Impact of key factors in 2024 and 2029
- Exhibits35: Chart on Market condition - Five forces 2024 and 2029
- Exhibits36: Chart on Indication - Market share 2024-2029 (%)
- Exhibits37: Data Table on Indication - Market share 2024-2029 (%)
- Exhibits38: Chart on Comparison by Indication
- Exhibits39: Data Table on Comparison by Indication
- Exhibits40: Chart on Lung cancer - Market size and forecast 2024-2029 ($ million)
- Exhibits41: Data Table on Lung cancer - Market size and forecast 2024-2029 ($ million)
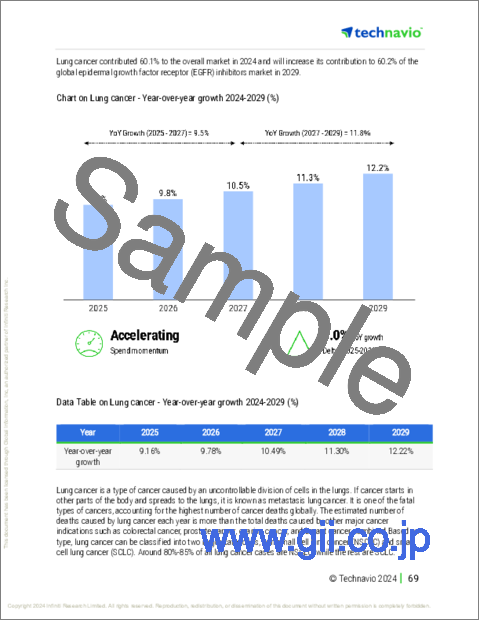
- Exhibits42: Chart on Lung cancer - Year-over-year growth 2024-2029 (%)
- Exhibits43: Data Table on Lung cancer - Year-over-year growth 2024-2029 (%)
- Exhibits44: Chart on Colorectal cancer - Market size and forecast 2024-2029 ($ million)
- Exhibits45: Data Table on Colorectal cancer - Market size and forecast 2024-2029 ($ million)
- Exhibits46: Chart on Colorectal cancer - Year-over-year growth 2024-2029 (%)
- Exhibits47: Data Table on Colorectal cancer - Year-over-year growth 2024-2029 (%)
- Exhibits48: Chart on Breast cancer - Market size and forecast 2024-2029 ($ million)
- Exhibits49: Data Table on Breast cancer - Market size and forecast 2024-2029 ($ million)
- Exhibits50: Chart on Breast cancer - Year-over-year growth 2024-2029 (%)
- Exhibits51: Data Table on Breast cancer - Year-over-year growth 2024-2029 (%)
- Exhibits52: Chart on Others - Market size and forecast 2024-2029 ($ million)
- Exhibits53: Data Table on Others - Market size and forecast 2024-2029 ($ million)
- Exhibits54: Chart on Others - Year-over-year growth 2024-2029 (%)
- Exhibits55: Data Table on Others - Year-over-year growth 2024-2029 (%)
- Exhibits56: Market opportunity by Indication ($ million)
- Exhibits57: Data Table on Market opportunity by Indication ($ million)
- Exhibits58: Chart on Distribution Channel - Market share 2024-2029 (%)
- Exhibits59: Data Table on Distribution Channel - Market share 2024-2029 (%)
- Exhibits60: Chart on Comparison by Distribution Channel
- Exhibits61: Data Table on Comparison by Distribution Channel
- Exhibits62: Chart on Retail pharmacies - Market size and forecast 2024-2029 ($ million)
- Exhibits63: Data Table on Retail pharmacies - Market size and forecast 2024-2029 ($ million)
- Exhibits64: Chart on Retail pharmacies - Year-over-year growth 2024-2029 (%)
- Exhibits65: Data Table on Retail pharmacies - Year-over-year growth 2024-2029 (%)
- Exhibits66: Chart on Hospital pharmacies - Market size and forecast 2024-2029 ($ million)
- Exhibits67: Data Table on Hospital pharmacies - Market size and forecast 2024-2029 ($ million)
- Exhibits68: Chart on Hospital pharmacies - Year-over-year growth 2024-2029 (%)
- Exhibits69: Data Table on Hospital pharmacies - Year-over-year growth 2024-2029 (%)
- Exhibits70: Chart on Online pharmacies - Market size and forecast 2024-2029 ($ million)
- Exhibits71: Data Table on Online pharmacies - Market size and forecast 2024-2029 ($ million)
- Exhibits72: Chart on Online pharmacies - Year-over-year growth 2024-2029 (%)
- Exhibits73: Data Table on Online pharmacies - Year-over-year growth 2024-2029 (%)
- Exhibits74: Market opportunity by Distribution Channel ($ million)
- Exhibits75: Data Table on Market opportunity by Distribution Channel ($ million)
- Exhibits76: Analysis of price sensitivity, lifecycle, customer purchase basket, adoption rates, and purchase criteria
- Exhibits77: Chart on Market share By Geographical Landscape 2024-2029 (%)
- Exhibits78: Data Table on Market share By Geographical Landscape 2024-2029 (%)
- Exhibits79: Chart on Geographic comparison
- Exhibits80: Data Table on Geographic comparison
- Exhibits81: Chart on North America - Market size and forecast 2024-2029 ($ million)
- Exhibits82: Data Table on North America - Market size and forecast 2024-2029 ($ million)
- Exhibits83: Chart on North America - Year-over-year growth 2024-2029 (%)
- Exhibits84: Data Table on North America - Year-over-year growth 2024-2029 (%)
- Exhibits85: Chart on Europe - Market size and forecast 2024-2029 ($ million)
- Exhibits86: Data Table on Europe - Market size and forecast 2024-2029 ($ million)
- Exhibits87: Chart on Europe - Year-over-year growth 2024-2029 (%)
- Exhibits88: Data Table on Europe - Year-over-year growth 2024-2029 (%)
- Exhibits89: Chart on Asia - Market size and forecast 2024-2029 ($ million)
- Exhibits90: Data Table on Asia - Market size and forecast 2024-2029 ($ million)
- Exhibits91: Chart on Asia - Year-over-year growth 2024-2029 (%)
- Exhibits92: Data Table on Asia - Year-over-year growth 2024-2029 (%)
- Exhibits93: Chart on Rest of World (ROW) - Market size and forecast 2024-2029 ($ million)
- Exhibits94: Data Table on Rest of World (ROW) - Market size and forecast 2024-2029 ($ million)
- Exhibits95: Chart on Rest of World (ROW) - Year-over-year growth 2024-2029 (%)
- Exhibits96: Data Table on Rest of World (ROW) - Year-over-year growth 2024-2029 (%)
- Exhibits97: Chart on US - Market size and forecast 2024-2029 ($ million)
- Exhibits98: Data Table on US - Market size and forecast 2024-2029 ($ million)
- Exhibits99: Chart on US - Year-over-year growth 2024-2029 (%)
- Exhibits100: Data Table on US - Year-over-year growth 2024-2029 (%)
- Exhibits101: Chart on Germany - Market size and forecast 2024-2029 ($ million)
- Exhibits102: Data Table on Germany - Market size and forecast 2024-2029 ($ million)
- Exhibits103: Chart on Germany - Year-over-year growth 2024-2029 (%)
- Exhibits104: Data Table on Germany - Year-over-year growth 2024-2029 (%)
- Exhibits105: Chart on UK - Market size and forecast 2024-2029 ($ million)
- Exhibits106: Data Table on UK - Market size and forecast 2024-2029 ($ million)
- Exhibits107: Chart on UK - Year-over-year growth 2024-2029 (%)
- Exhibits108: Data Table on UK - Year-over-year growth 2024-2029 (%)
- Exhibits109: Chart on India - Market size and forecast 2024-2029 ($ million)
- Exhibits110: Data Table on India - Market size and forecast 2024-2029 ($ million)
- Exhibits111: Chart on India - Year-over-year growth 2024-2029 (%)
- Exhibits112: Data Table on India - Year-over-year growth 2024-2029 (%)
- Exhibits113: Chart on China - Market size and forecast 2024-2029 ($ million)
- Exhibits114: Data Table on China - Market size and forecast 2024-2029 ($ million)
- Exhibits115: Chart on China - Year-over-year growth 2024-2029 (%)
- Exhibits116: Data Table on China - Year-over-year growth 2024-2029 (%)
- Exhibits117: Chart on Canada - Market size and forecast 2024-2029 ($ million)
- Exhibits118: Data Table on Canada - Market size and forecast 2024-2029 ($ million)
- Exhibits119: Chart on Canada - Year-over-year growth 2024-2029 (%)
- Exhibits120: Data Table on Canada - Year-over-year growth 2024-2029 (%)
- Exhibits121: Chart on South Korea - Market size and forecast 2024-2029 ($ million)
- Exhibits122: Data Table on South Korea - Market size and forecast 2024-2029 ($ million)
- Exhibits123: Chart on South Korea - Year-over-year growth 2024-2029 (%)
- Exhibits124: Data Table on South Korea - Year-over-year growth 2024-2029 (%)
- Exhibits125: Chart on France - Market size and forecast 2024-2029 ($ million)
- Exhibits126: Data Table on France - Market size and forecast 2024-2029 ($ million)
- Exhibits127: Chart on France - Year-over-year growth 2024-2029 (%)
- Exhibits128: Data Table on France - Year-over-year growth 2024-2029 (%)
- Exhibits129: Chart on Japan - Market size and forecast 2024-2029 ($ million)
- Exhibits130: Data Table on Japan - Market size and forecast 2024-2029 ($ million)
- Exhibits131: Chart on Japan - Year-over-year growth 2024-2029 (%)
- Exhibits132: Data Table on Japan - Year-over-year growth 2024-2029 (%)
- Exhibits133: Chart on Italy - Market size and forecast 2024-2029 ($ million)
- Exhibits134: Data Table on Italy - Market size and forecast 2024-2029 ($ million)
- Exhibits135: Chart on Italy - Year-over-year growth 2024-2029 (%)
- Exhibits136: Data Table on Italy - Year-over-year growth 2024-2029 (%)
- Exhibits137: Market opportunity By Geographical Landscape ($ million)
- Exhibits138: Data Tables on Market opportunity By Geographical Landscape ($ million)
- Exhibits139: Impact of drivers and challenges in 2024 and 2029
- Exhibits140: Overview on criticality of inputs and factors of differentiation
- Exhibits141: Overview on factors of disruption
- Exhibits142: Impact of key risks on business
- Exhibits143: Companies covered
- Exhibits144: Company ranking index
- Exhibits145: Matrix on companies position and classification
- Exhibits146: Amgen Inc. - Overview
- Exhibits147: Amgen Inc. - Product / Service
- Exhibits148: Amgen Inc. - Key news
- Exhibits149: Amgen Inc. - Key offerings
- Exhibits150: SWOT
- Exhibits151: ASSERTIO HOLDINGS INC. - Overview
- Exhibits152: ASSERTIO HOLDINGS INC. - Product / Service
- Exhibits153: ASSERTIO HOLDINGS INC. - Key offerings
- Exhibits154: SWOT
- Exhibits155: AstraZeneca Plc - Overview
- Exhibits156: AstraZeneca Plc - Product / Service
- Exhibits157: AstraZeneca Plc - Key news
- Exhibits158: AstraZeneca Plc - Key offerings
- Exhibits159: SWOT
- Exhibits160: Boehringer Ingelheim International GmbH - Overview
- Exhibits161: Boehringer Ingelheim International GmbH - Product / Service
- Exhibits162: Boehringer Ingelheim International GmbH - Key news
- Exhibits163: Boehringer Ingelheim International GmbH - Key offerings
- Exhibits164: SWOT
- Exhibits165: Bristol Myers Squibb Co. - Overview
- Exhibits166: Bristol Myers Squibb Co. - Product / Service
- Exhibits167: Bristol Myers Squibb Co. - Key news
- Exhibits168: Bristol Myers Squibb Co. - Key offerings
- Exhibits169: SWOT
- Exhibits170: Checkpoint Therapeutics Inc. - Overview
- Exhibits171: Checkpoint Therapeutics Inc. - Product / Service
- Exhibits172: Checkpoint Therapeutics Inc. - Key offerings
- Exhibits173: SWOT
- Exhibits174: Eli Lilly and Co. - Overview
- Exhibits175: Eli Lilly and Co. - Product / Service
- Exhibits176: Eli Lilly and Co. - Key offerings
- Exhibits177: SWOT
- Exhibits178: F. Hoffmann La Roche Ltd. - Overview
- Exhibits179: F. Hoffmann La Roche Ltd. - Business segments
- Exhibits180: F. Hoffmann La Roche Ltd. - Key news
- Exhibits181: F. Hoffmann La Roche Ltd. - Key offerings
- Exhibits182: F. Hoffmann La Roche Ltd. - Segment focus
- Exhibits183: SWOT
- Exhibits184: Jiangsu Hengrui Pharmaceuticals Co. Ltd. - Overview
- Exhibits185: Jiangsu Hengrui Pharmaceuticals Co. Ltd. - Product / Service
- Exhibits186: Jiangsu Hengrui Pharmaceuticals Co. Ltd. - Key offerings
- Exhibits187: SWOT
- Exhibits188: Johnson and Johnson Inc. - Overview
- Exhibits189: Johnson and Johnson Inc. - Business segments
- Exhibits190: Johnson and Johnson Inc. - Key news
- Exhibits191: Johnson and Johnson Inc. - Key offerings
- Exhibits192: Johnson and Johnson Inc. - Segment focus
- Exhibits193: SWOT
- Exhibits194: Novartis AG - Overview
- Exhibits195: Novartis AG - Business segments
- Exhibits196: Novartis AG - Key news
- Exhibits197: Novartis AG - Key offerings
- Exhibits198: Novartis AG - Segment focus
- Exhibits199: SWOT
- Exhibits200: Otsuka Holdings Co. Ltd. - Overview
- Exhibits201: Otsuka Holdings Co. Ltd. - Business segments
- Exhibits202: Otsuka Holdings Co. Ltd. - Key news
- Exhibits203: Otsuka Holdings Co. Ltd. - Key offerings
- Exhibits204: Otsuka Holdings Co. Ltd. - Segment focus
- Exhibits205: SWOT
- Exhibits206: Pfizer Inc. - Overview
- Exhibits207: Pfizer Inc. - Product / Service
- Exhibits208: Pfizer Inc. - Key news
- Exhibits209: Pfizer Inc. - Key offerings
- Exhibits210: SWOT
- Exhibits211: Puma Biotechnology Inc. - Overview
- Exhibits212: Puma Biotechnology Inc. - Product / Service
- Exhibits213: Puma Biotechnology Inc. - Key offerings
- Exhibits214: SWOT
- Exhibits215: Takeda Pharmaceutical Co. Ltd. - Overview
- Exhibits216: Takeda Pharmaceutical Co. Ltd. - Product / Service
- Exhibits217: Takeda Pharmaceutical Co. Ltd. - Key news
- Exhibits218: Takeda Pharmaceutical Co. Ltd. - Key offerings
- Exhibits219: SWOT
- Exhibits220: Inclusions checklist
- Exhibits221: Exclusions checklist
- Exhibits222: Currency conversion rates for US$
- Exhibits223: Research methodology
- Exhibits224: Information sources
- Exhibits225: Data validation
- Exhibits226: Validation techniques employed for market sizing
- Exhibits227: Data synthesis
- Exhibits228: 360 degree market analysis
- Exhibits229: List of abbreviations
The epidermal growth factor receptor (EGFR) inhibitors market is forecasted to grow by USD 10732.5 mn during 2024-2029, accelerating at a CAGR of 10.5% during the forecast period. The report on the epidermal growth factor receptor (EGFR) inhibitors market provides a holistic analysis, market size and forecast, trends, growth drivers, and challenges, as well as vendor analysis covering around 25 vendors.
The report offers an up-to-date analysis regarding the current market scenario, the latest trends and drivers, and the overall market environment. The market is driven by rise in the prevalence of major cancer indications, increasing awareness and adoption of personalized medicine, and advancements in technology and research.
| Market Scope | |
|---|---|
| Base Year | 2025 |
| End Year | 2029 |
| Series Year | 2025-2029 |
| Growth Momentum | Accelerate |
| YOY 2025 | 9.4% |
| CAGR | 10.5% |
| Incremental Value | $10732.5 mn |
Technavio's epidermal growth factor receptor (EGFR) inhibitors market is segmented as below:
By Indication
- Lung cancer
- Colorectal cancer
- Breast cancer
- Others
By Distribution Channel
- Retail pharmacies
- Hospital pharmacies
- Online pharmacies
By Geographical Landscape
- North America
- Europe
- Asia
- Rest of World (ROW)
This study identifies the increase in research areas for treatment of various types of cancer as one of the prime reasons driving the epidermal growth factor receptor (EGFR) inhibitors market growth during the next few years. Also, rise in number of drug pipelines and increasing reimbursement programs will lead to sizable demand in the market.
The report on the epidermal growth factor receptor (EGFR) inhibitors market covers the following areas:
- Epidermal Growth Factor Receptor (EGFR) Inhibitors Market sizing
- Epidermal Growth Factor Receptor (EGFR) Inhibitors Market forecast
- Epidermal Growth Factor Receptor (EGFR) Inhibitors Market industry analysis
The robust vendor analysis is designed to help clients improve their market position, and in line with this, this report provides a detailed analysis of several leading epidermal growth factor receptor (EGFR) inhibitors market vendors that include Amgen Inc., ASSERTIO HOLDINGS INC., AstraZeneca Plc, Boehringer Ingelheim International GmbH, Bristol Myers Squibb Co., Checkpoint Therapeutics Inc., Eli Lilly and Co., F. Hoffmann La Roche Ltd., Hansoh Pharmaceutical Group Co. Ltd., Hutchison China Meditech Ltd., Jiangsu Hengrui Pharmaceuticals Co. Ltd., Johnson and Johnson Inc., Lutris Pharma, Novartis AG, Otsuka Holdings Co. Ltd., Pfizer Inc., Puma Biotechnology Inc., and Takeda Pharmaceutical Co. Ltd.. Also, the epidermal growth factor receptor (EGFR) inhibitors market analysis report includes information on upcoming trends and challenges that will influence market growth. This is to help companies strategize and leverage all forthcoming growth opportunities.
The study was conducted using an objective combination of primary and secondary information including inputs from key participants in the industry. The report contains a comprehensive market and vendor landscape in addition to an analysis of the key vendors.
The publisher presents a detailed picture of the market by the way of study, synthesis, and summation of data from multiple sources by an analysis of key parameters such as profit, pricing, competition, and promotions. It presents various market facets by identifying the key industry influencers. The data presented is comprehensive, reliable, and a result of extensive primary and secondary research. The market research reports provide a complete competitive landscape and an in-depth vendor selection methodology and analysis using qualitative and quantitative research to forecast accurate market growth.
Table of Contents
1 Executive Summary
- 1.1 Market overview
- Executive Summary - Chart on Market Overview
- Executive Summary - Data Table on Market Overview
- Executive Summary - Chart on Global Market Characteristics
- Executive Summary - Chart on Market By Geographical Landscape
- Executive Summary - Chart on Market Segmentation by Indication
- Executive Summary - Chart on Market Segmentation by Distribution Channel
- Executive Summary - Chart on Incremental Growth
- Executive Summary - Data Table on Incremental Growth
- Executive Summary - Chart on Company Market Positioning
2 Technavio Analysis
- 2.1 Analysis of price sensitivity, lifecycle, customer purchase basket, adoption rates, and purchase criteria
- Analysis of price sensitivity, lifecycle, customer purchase basket, adoption rates, and purchase criteria
- 2.2 Criticality of inputs and Factors of differentiation
- Overview on criticality of inputs and factors of differentiation
- 2.3 Factors of disruption
- Overview on factors of disruption
- 2.4 Impact of drivers and challenges
- Impact of drivers and challenges in 2024 and 2029
3 Market Landscape
- 3.1 Market ecosystem
- Parent Market
- Data Table on - Parent Market
- 3.2 Market characteristics
- Market characteristics analysis
- 3.3 Value chain analysis
- Value chain analysis
4 Market Sizing
- 4.1 Market definition
- Offerings of companies included in the market definition
- 4.2 Market segment analysis
- Market segments
- 4.3 Market size 2024
- 4.4 Market outlook: Forecast for 2024-2029
- Chart on Global - Market size and forecast 2024-2029 ($ million)
- Data Table on Global - Market size and forecast 2024-2029 ($ million)
- Chart on Global Market: Year-over-year growth 2024-2029 (%)
- Data Table on Global Market: Year-over-year growth 2024-2029 (%)
5 Historic Market Size
- 5.1 Global Epidermal Growth Factor Receptor (EGFR) Inhibitors Market 2019 - 2023
- Historic Market Size - Data Table on Global Epidermal Growth Factor Receptor (EGFR) Inhibitors Market 2019 - 2023 ($ million)
- 5.2 Indication segment analysis 2019 - 2023
- Historic Market Size - Indication Segment 2019 - 2023 ($ million)
- 5.3 Distribution Channel segment analysis 2019 - 2023
- Historic Market Size - Distribution Channel Segment 2019 - 2023 ($ million)
- 5.4 Geography segment analysis 2019 - 2023
- Historic Market Size - Geography Segment 2019 - 2023 ($ million)
- 5.5 Country segment analysis 2019 - 2023
- Historic Market Size - Country Segment 2019 - 2023 ($ million)
6 Qualitative Analysis
- 6.1 The AI impact on global epidermal growth factor receptor (EGFR) inhibitors market
7 Five Forces Analysis
- 7.1 Five forces summary
- Five forces analysis - Comparison between 2024 and 2029
- 7.2 Bargaining power of buyers
- Bargaining power of buyers - Impact of key factors 2024 and 2029
- 7.3 Bargaining power of suppliers
- Bargaining power of suppliers - Impact of key factors in 2024 and 2029
- 7.4 Threat of new entrants
- Threat of new entrants - Impact of key factors in 2024 and 2029
- 7.5 Threat of substitutes
- Threat of substitutes - Impact of key factors in 2024 and 2029
- 7.6 Threat of rivalry
- Threat of rivalry - Impact of key factors in 2024 and 2029
- 7.7 Market condition
- Chart on Market condition - Five forces 2024 and 2029
8 Market Segmentation by Indication
- 8.1 Market segments
- Chart on Indication - Market share 2024-2029 (%)
- Data Table on Indication - Market share 2024-2029 (%)
- 8.2 Comparison by Indication
- Chart on Comparison by Indication
- Data Table on Comparison by Indication
- 8.3 Lung cancer - Market size and forecast 2024-2029
- Chart on Lung cancer - Market size and forecast 2024-2029 ($ million)
- Data Table on Lung cancer - Market size and forecast 2024-2029 ($ million)
- Chart on Lung cancer - Year-over-year growth 2024-2029 (%)
- Data Table on Lung cancer - Year-over-year growth 2024-2029 (%)
- 8.4 Colorectal cancer - Market size and forecast 2024-2029
- Chart on Colorectal cancer - Market size and forecast 2024-2029 ($ million)
- Data Table on Colorectal cancer - Market size and forecast 2024-2029 ($ million)
- Chart on Colorectal cancer - Year-over-year growth 2024-2029 (%)
- Data Table on Colorectal cancer - Year-over-year growth 2024-2029 (%)
- 8.5 Breast cancer - Market size and forecast 2024-2029
- Chart on Breast cancer - Market size and forecast 2024-2029 ($ million)
- Data Table on Breast cancer - Market size and forecast 2024-2029 ($ million)
- Chart on Breast cancer - Year-over-year growth 2024-2029 (%)
- Data Table on Breast cancer - Year-over-year growth 2024-2029 (%)
- 8.6 Others - Market size and forecast 2024-2029
- Chart on Others - Market size and forecast 2024-2029 ($ million)
- Data Table on Others - Market size and forecast 2024-2029 ($ million)
- Chart on Others - Year-over-year growth 2024-2029 (%)
- Data Table on Others - Year-over-year growth 2024-2029 (%)
- 8.7 Market opportunity by Indication
- Market opportunity by Indication ($ million)
- Data Table on Market opportunity by Indication ($ million)
9 Market Segmentation by Distribution Channel
- 9.1 Market segments
- Chart on Distribution Channel - Market share 2024-2029 (%)
- Data Table on Distribution Channel - Market share 2024-2029 (%)
- 9.2 Comparison by Distribution Channel
- Chart on Comparison by Distribution Channel
- Data Table on Comparison by Distribution Channel
- 9.3 Retail pharmacies - Market size and forecast 2024-2029
- Chart on Retail pharmacies - Market size and forecast 2024-2029 ($ million)
- Data Table on Retail pharmacies - Market size and forecast 2024-2029 ($ million)
- Chart on Retail pharmacies - Year-over-year growth 2024-2029 (%)
- Data Table on Retail pharmacies - Year-over-year growth 2024-2029 (%)
- 9.4 Hospital pharmacies - Market size and forecast 2024-2029
- Chart on Hospital pharmacies - Market size and forecast 2024-2029 ($ million)
- Data Table on Hospital pharmacies - Market size and forecast 2024-2029 ($ million)
- Chart on Hospital pharmacies - Year-over-year growth 2024-2029 (%)
- Data Table on Hospital pharmacies - Year-over-year growth 2024-2029 (%)
- 9.5 Online pharmacies - Market size and forecast 2024-2029
- Chart on Online pharmacies - Market size and forecast 2024-2029 ($ million)
- Data Table on Online pharmacies - Market size and forecast 2024-2029 ($ million)
- Chart on Online pharmacies - Year-over-year growth 2024-2029 (%)
- Data Table on Online pharmacies - Year-over-year growth 2024-2029 (%)
- 9.6 Market opportunity by Distribution Channel
- Market opportunity by Distribution Channel ($ million)
- Data Table on Market opportunity by Distribution Channel ($ million)
10 Customer Landscape
- 10.1 Customer landscape overview
- Analysis of price sensitivity, lifecycle, customer purchase basket, adoption rates, and purchase criteria
11 Geographic Landscape
- 11.1 Geographic segmentation
- Chart on Market share By Geographical Landscape 2024-2029 (%)
- Data Table on Market share By Geographical Landscape 2024-2029 (%)
- 11.2 Geographic comparison
- Chart on Geographic comparison
- Data Table on Geographic comparison
- 11.3 North America - Market size and forecast 2024-2029
- Chart on North America - Market size and forecast 2024-2029 ($ million)
- Data Table on North America - Market size and forecast 2024-2029 ($ million)
- Chart on North America - Year-over-year growth 2024-2029 (%)
- Data Table on North America - Year-over-year growth 2024-2029 (%)
- 11.4 Europe - Market size and forecast 2024-2029
- Chart on Europe - Market size and forecast 2024-2029 ($ million)
- Data Table on Europe - Market size and forecast 2024-2029 ($ million)
- Chart on Europe - Year-over-year growth 2024-2029 (%)
- Data Table on Europe - Year-over-year growth 2024-2029 (%)
- 11.5 Asia - Market size and forecast 2024-2029
- Chart on Asia - Market size and forecast 2024-2029 ($ million)
- Data Table on Asia - Market size and forecast 2024-2029 ($ million)
- Chart on Asia - Year-over-year growth 2024-2029 (%)
- Data Table on Asia - Year-over-year growth 2024-2029 (%)
- 11.6 Rest of World (ROW) - Market size and forecast 2024-2029
- Chart on Rest of World (ROW) - Market size and forecast 2024-2029 ($ million)
- Data Table on Rest of World (ROW) - Market size and forecast 2024-2029 ($ million)
- Chart on Rest of World (ROW) - Year-over-year growth 2024-2029 (%)
- Data Table on Rest of World (ROW) - Year-over-year growth 2024-2029 (%)
- 11.7 US - Market size and forecast 2024-2029
- Chart on US - Market size and forecast 2024-2029 ($ million)
- Data Table on US - Market size and forecast 2024-2029 ($ million)
- Chart on US - Year-over-year growth 2024-2029 (%)
- Data Table on US - Year-over-year growth 2024-2029 (%)
- 11.8 Germany - Market size and forecast 2024-2029
- Chart on Germany - Market size and forecast 2024-2029 ($ million)
- Data Table on Germany - Market size and forecast 2024-2029 ($ million)
- Chart on Germany - Year-over-year growth 2024-2029 (%)
- Data Table on Germany - Year-over-year growth 2024-2029 (%)
- 11.9 UK - Market size and forecast 2024-2029
- Chart on UK - Market size and forecast 2024-2029 ($ million)
- Data Table on UK - Market size and forecast 2024-2029 ($ million)
- Chart on UK - Year-over-year growth 2024-2029 (%)
- Data Table on UK - Year-over-year growth 2024-2029 (%)
- 11.10 India - Market size and forecast 2024-2029
- Chart on India - Market size and forecast 2024-2029 ($ million)
- Data Table on India - Market size and forecast 2024-2029 ($ million)
- Chart on India - Year-over-year growth 2024-2029 (%)
- Data Table on India - Year-over-year growth 2024-2029 (%)
- 11.11 China - Market size and forecast 2024-2029
- Chart on China - Market size and forecast 2024-2029 ($ million)
- Data Table on China - Market size and forecast 2024-2029 ($ million)
- Chart on China - Year-over-year growth 2024-2029 (%)
- Data Table on China - Year-over-year growth 2024-2029 (%)
- 11.12 Canada - Market size and forecast 2024-2029
- Chart on Canada - Market size and forecast 2024-2029 ($ million)
- Data Table on Canada - Market size and forecast 2024-2029 ($ million)
- Chart on Canada - Year-over-year growth 2024-2029 (%)
- Data Table on Canada - Year-over-year growth 2024-2029 (%)
- 11.13 South Korea - Market size and forecast 2024-2029
- Chart on South Korea - Market size and forecast 2024-2029 ($ million)
- Data Table on South Korea - Market size and forecast 2024-2029 ($ million)
- Chart on South Korea - Year-over-year growth 2024-2029 (%)
- Data Table on South Korea - Year-over-year growth 2024-2029 (%)
- 11.14 France - Market size and forecast 2024-2029
- Chart on France - Market size and forecast 2024-2029 ($ million)
- Data Table on France - Market size and forecast 2024-2029 ($ million)
- Chart on France - Year-over-year growth 2024-2029 (%)
- Data Table on France - Year-over-year growth 2024-2029 (%)
- 11.15 Japan - Market size and forecast 2024-2029
- Chart on Japan - Market size and forecast 2024-2029 ($ million)
- Data Table on Japan - Market size and forecast 2024-2029 ($ million)
- Chart on Japan - Year-over-year growth 2024-2029 (%)
- Data Table on Japan - Year-over-year growth 2024-2029 (%)
- 11.16 Italy - Market size and forecast 2024-2029
- Chart on Italy - Market size and forecast 2024-2029 ($ million)
- Data Table on Italy - Market size and forecast 2024-2029 ($ million)
- Chart on Italy - Year-over-year growth 2024-2029 (%)
- Data Table on Italy - Year-over-year growth 2024-2029 (%)
- 11.17 Market opportunity By Geographical Landscape
- Market opportunity By Geographical Landscape ($ million)
- Data Tables on Market opportunity By Geographical Landscape ($ million)
12 Drivers, Challenges, and Opportunity/Restraints
- 12.1 Market drivers
- 12.2 Market challenges
- 12.3 Impact of drivers and challenges
- Impact of drivers and challenges in 2024 and 2029
- 12.4 Market opportunities/restraints
13 Competitive Landscape
- 13.1 Overview
- 13.2 Competitive Landscape
- Overview on criticality of inputs and factors of differentiation
- 13.3 Landscape disruption
- Overview on factors of disruption
- 13.4 Industry risks
- Impact of key risks on business
14 Competitive Analysis
- 14.1 Companies profiled
- Companies covered
- 14.2 Company ranking index
- Company ranking index
- 14.3 Market positioning of companies
- Matrix on companies position and classification
- 14.4 Amgen Inc.
- Amgen Inc. - Overview
- Amgen Inc. - Product / Service
- Amgen Inc. - Key news
- Amgen Inc. - Key offerings
- SWOT
- 14.5 ASSERTIO HOLDINGS INC.
- ASSERTIO HOLDINGS INC. - Overview
- ASSERTIO HOLDINGS INC. - Product / Service
- ASSERTIO HOLDINGS INC. - Key offerings
- SWOT
- 14.6 AstraZeneca Plc
- AstraZeneca Plc - Overview
- AstraZeneca Plc - Product / Service
- AstraZeneca Plc - Key news
- AstraZeneca Plc - Key offerings
- SWOT
- 14.7 Boehringer Ingelheim International GmbH
- Boehringer Ingelheim International GmbH - Overview
- Boehringer Ingelheim International GmbH - Product / Service
- Boehringer Ingelheim International GmbH - Key news
- Boehringer Ingelheim International GmbH - Key offerings
- SWOT
- 14.8 Bristol Myers Squibb Co.
- Bristol Myers Squibb Co. - Overview
- Bristol Myers Squibb Co. - Product / Service
- Bristol Myers Squibb Co. - Key news
- Bristol Myers Squibb Co. - Key offerings
- SWOT
- 14.9 Checkpoint Therapeutics Inc.
- Checkpoint Therapeutics Inc. - Overview
- Checkpoint Therapeutics Inc. - Product / Service
- Checkpoint Therapeutics Inc. - Key offerings
- SWOT
- 14.10 Eli Lilly and Co.
- Eli Lilly and Co. - Overview
- Eli Lilly and Co. - Product / Service
- Eli Lilly and Co. - Key offerings
- SWOT
- 14.11 F. Hoffmann La Roche Ltd.
- F. Hoffmann La Roche Ltd. - Overview
- F. Hoffmann La Roche Ltd. - Business segments
- F. Hoffmann La Roche Ltd. - Key news
- F. Hoffmann La Roche Ltd. - Key offerings
- F. Hoffmann La Roche Ltd. - Segment focus
- SWOT
- 14.12 Jiangsu Hengrui Pharmaceuticals Co. Ltd.
- Jiangsu Hengrui Pharmaceuticals Co. Ltd. - Overview
- Jiangsu Hengrui Pharmaceuticals Co. Ltd. - Product / Service
- Jiangsu Hengrui Pharmaceuticals Co. Ltd. - Key offerings
- SWOT
- 14.13 Johnson and Johnson Inc.
- Johnson and Johnson Inc. - Overview
- Johnson and Johnson Inc. - Business segments
- Johnson and Johnson Inc. - Key news
- Johnson and Johnson Inc. - Key offerings
- Johnson and Johnson Inc. - Segment focus
- SWOT
- 14.14 Novartis AG
- Novartis AG - Overview
- Novartis AG - Business segments
- Novartis AG - Key news
- Novartis AG - Key offerings
- Novartis AG - Segment focus
- SWOT
- 14.15 Otsuka Holdings Co. Ltd.
- Otsuka Holdings Co. Ltd. - Overview
- Otsuka Holdings Co. Ltd. - Business segments
- Otsuka Holdings Co. Ltd. - Key news
- Otsuka Holdings Co. Ltd. - Key offerings
- Otsuka Holdings Co. Ltd. - Segment focus
- SWOT
- 14.16 Pfizer Inc.
- Pfizer Inc. - Overview
- Pfizer Inc. - Product / Service
- Pfizer Inc. - Key news
- Pfizer Inc. - Key offerings
- SWOT
- 14.17 Puma Biotechnology Inc.
- Puma Biotechnology Inc. - Overview
- Puma Biotechnology Inc. - Product / Service
- Puma Biotechnology Inc. - Key offerings
- SWOT
- 14.18 Takeda Pharmaceutical Co. Ltd.
- Takeda Pharmaceutical Co. Ltd. - Overview
- Takeda Pharmaceutical Co. Ltd. - Product / Service
- Takeda Pharmaceutical Co. Ltd. - Key news
- Takeda Pharmaceutical Co. Ltd. - Key offerings
- SWOT
15 Appendix
- 15.1 Scope of the report
- 15.2 Inclusions and exclusions checklist
- Inclusions checklist
- Exclusions checklist
- 15.3 Currency conversion rates for US$
- Currency conversion rates for US$
- 15.4 Research methodology
- Research methodology
- 15.5 Data procurement
- Information sources
- 15.6 Data validation
- Data validation
- 15.7 Validation techniques employed for market sizing
- Validation techniques employed for market sizing
- 15.8 Data synthesis
- Data synthesis
- 15.9 360 degree market analysis
- 360 degree market analysis
- 15.10 List of abbreviations
- List of abbreviations

