|
|
市場調査レポート
商品コード
1645632
シューケア用品の世界市場、2025-2029年Global Shoe Care Products Market 2025-2029 |
||||||

|
|||||||
カスタマイズ可能
|
|||||||


| シューケア用品の世界市場、2025-2029年 |
|
出版日: 2025年01月17日
発行: TechNavio
ページ情報: 英文 197 Pages
納期: 即納可能
|

全表示
- 概要
- 図表
- 目次
シューケア用品市場は2024-2029年に2億8,440万米ドル、予測期間中のCAGRは8%で成長すると予測されます。
当レポートでは、シューケア用品市場の全体的な分析、市場規模・予測、動向、成長促進要因、課題、約25のベンダーを網羅したベンダー分析などを掲載しています。
現在の市場シナリオ、最新動向と促進要因、市場環境全体に関する最新分析を提供しています。市場は、製品のプレミアム化につながる製品革新と製品ラインの拡張、成長するフットウェア産業、足の健康と靴の清潔さに対する意識の高まりによって牽引されています。
| 市場範囲 | |
|---|---|
| 基準年 | 2025 |
| 終了年 | 2029 |
| 予測期間 | 2025-2029 |
| 成長モメンタム | 加速 |
| 前年比2025年 | 7.2% |
| CAGR | 8% |
| 増分額 | 2億8,440万米ドル |
本調査では、天然素材を使用したシューケア用品のイントロダクションの増加が、今後数年間のシューケア用品市場の成長を促進する主な要因の一つであると指摘しています。また、シューケア用品の使用に関する消費者参加型のデジタルマーケティングやソーシャルメディアキャンペーンの増加、オンラインチュートリアルの利用可能性は、市場の大きな需要につながります。
目次
第1章 エグゼクティブサマリー
- 市場概要
第2章 Technavio分析
- 価格・ライフサイクル・顧客購入バスケット・採用率・購入基準の分析
- インプットの重要性と差別化の要因
- 混乱の要因
- 促進要因と課題の影響
第3章 市場情勢
- 市場エコシステム
- 市場の特徴
- バリューチェーン分析
第4章 市場規模
- 市場の定義
- 市場セグメント分析
- 市場規模 2024
- 市場の見通し 2024-2029
第5章 市場規模実績
- シューケア用品の世界市場 2019-2023
- 流通チャネルセグメント分析 2019-2023
- 製品セグメント分析 2019-2023
- 地域別セグメント分析 2019-2023
- 国別セグメント分析 2019-2023
第6章 定性分析
- 多額の資本投資の必要性
第7章 ファイブフォース分析
- ファイブフォースの要約
- 買い手の交渉力
- 供給企業の交渉力
- 新規参入業者の脅威
- 代替品の脅威
- 競争の脅威
- 市況
第8章 市場セグメンテーション:流通チャネル別
- 市場セグメント
- 比較:流通チャネル別
- オフライン:市場規模と予測 2024-2029
- オンライン:市場規模と予測 2024-2029
- 市場機会:流通チャネル別
第9章 市場セグメンテーション:製品別
- 市場セグメント
- 比較:製品別
- ブラシとバフクロス:市場規模と予測 2024-2029
- 研磨クリーム:市場規模と予測 2024-2029
- ワックスと液体:市場規模と予測 2024-2029
- その他:市場規模と予測 2024-2029
- 市場機会:製品別
第10章 顧客情勢
- 顧客情勢の概要
第11章 地域別情勢
- 地域別セグメンテーション
- 地域別比較
- 北米:市場規模と予測 2024-2029
- 欧州:市場規模と予測 2024-2029
- アジア太平洋:市場規模と予測 2024-2029
- 中東・アフリカ:市場規模と予測 2024-2029
- 南米:市場規模と予測 2024-2029
- 米国:市場規模と予測 2024-2029
- ドイツ:市場規模と予測 2024-2029
- 中国:市場規模と予測 2024-2029
- カナダ:市場規模と予測 2024-2029
- 日本:市場規模と予測 2024-2029
- フランス:市場規模と予測 2024-2029
- 英国:市場規模と予測 2024-2029
- インド:市場規模と予測 2024-2029
- イタリア:市場規模と予測 2024-2029
- ブラジル:市場規模と予測 2024-2029
- 市場機会:地域情勢別
第12章 促進要因・課題・機会・抑制要因
- 市場促進要因
- 市場の課題
- 促進要因と課題の影響
- 市場の機会・抑制要因
第13章 競合情勢
- 概要
- 競合情勢
- 混乱の状況
- 業界のリスク
第14章 競合分析
- 企業プロファイル
- 企業ランキング指数
- 企業の市場ポジショニング
- Angelus Shoe Polish
- C P Marketing Inc.
- C.A. Zoes Mfg Co.
- Caleres Inc.
- Fiebing Co. Inc.
- Grangers International Ltd.
- Implus Footcare LLC
- Moneysworth and Best Quality Shoe Care
- Rocket Pure Care LLC
- S.C. Johnson and Son Inc.
- Salzenbrodt GmbH and Co. KG
- Shinola
- TARRAGO BRANDS INTERNATIONIAL, S.L.
- TRG BESTNETS SL
- Woodland Worldwide
第15章 付録
Exhibits:
- Exhibits1: Executive Summary - Chart on Market Overview
- Exhibits2: Executive Summary - Data Table on Market Overview
- Exhibits3: Executive Summary - Chart on Global Market Characteristics
- Exhibits4: Executive Summary - Chart on Market By Geographical Landscape
- Exhibits5: Executive Summary - Chart on Market Segmentation by Distribution Channel
- Exhibits6: Executive Summary - Chart on Market Segmentation by Product
- Exhibits7: Executive Summary - Chart on Incremental Growth
- Exhibits8: Executive Summary - Data Table on Incremental Growth
- Exhibits9: Executive Summary - Chart on Company Market Positioning
- Exhibits10: Analysis of price sensitivity, lifecycle, customer purchase basket, adoption rates, and purchase criteria
- Exhibits11: Overview on criticality of inputs and factors of differentiation
- Exhibits12: Overview on factors of disruption
- Exhibits13: Impact of drivers and challenges in 2024 and 2029
- Exhibits14: Parent Market
- Exhibits15: Data Table on - Parent Market
- Exhibits16: Market characteristics analysis
- Exhibits17: Value chain analysis
- Exhibits18: Offerings of companies included in the market definition
- Exhibits19: Market segments
- Exhibits20: Chart on Global - Market size and forecast 2024-2029 ($ million)
- Exhibits21: Data Table on Global - Market size and forecast 2024-2029 ($ million)
- Exhibits22: Chart on Global Market: Year-over-year growth 2024-2029 (%)
- Exhibits23: Data Table on Global Market: Year-over-year growth 2024-2029 (%)
- Exhibits24: Historic Market Size - Data Table on Global Shoe Care Products Market 2019 - 2023 ($ million)
- Exhibits25: Historic Market Size - Distribution Channel Segment 2019 - 2023 ($ million)
- Exhibits26: Historic Market Size - Product Segment 2019 - 2023 ($ million)
- Exhibits27: Historic Market Size - Geography Segment 2019 - 2023 ($ million)
- Exhibits28: Historic Market Size - Country Segment 2019 - 2023 ($ million)
- Exhibits29: Five forces analysis - Comparison between 2024 and 2029
- Exhibits30: Bargaining power of buyers - Impact of key factors 2024 and 2029
- Exhibits31: Bargaining power of suppliers - Impact of key factors in 2024 and 2029
- Exhibits32: Threat of new entrants - Impact of key factors in 2024 and 2029
- Exhibits33: Threat of substitutes - Impact of key factors in 2024 and 2029
- Exhibits34: Threat of rivalry - Impact of key factors in 2024 and 2029
- Exhibits35: Chart on Market condition - Five forces 2024 and 2029
- Exhibits36: Chart on Distribution Channel - Market share 2024-2029 (%)
- Exhibits37: Data Table on Distribution Channel - Market share 2024-2029 (%)
- Exhibits38: Chart on Comparison by Distribution Channel
- Exhibits39: Data Table on Comparison by Distribution Channel
- Exhibits40: Chart on Offline - Market size and forecast 2024-2029 ($ million)
- Exhibits41: Data Table on Offline - Market size and forecast 2024-2029 ($ million)
- Exhibits42: Chart on Offline - Year-over-year growth 2024-2029 (%)
- Exhibits43: Data Table on Offline - Year-over-year growth 2024-2029 (%)
- Exhibits44: Chart on Online - Market size and forecast 2024-2029 ($ million)
- Exhibits45: Data Table on Online - Market size and forecast 2024-2029 ($ million)
- Exhibits46: Chart on Online - Year-over-year growth 2024-2029 (%)
- Exhibits47: Data Table on Online - Year-over-year growth 2024-2029 (%)
- Exhibits48: Market opportunity by Distribution Channel ($ million)
- Exhibits49: Data Table on Market opportunity by Distribution Channel ($ million)
- Exhibits50: Chart on Product - Market share 2024-2029 (%)
- Exhibits51: Data Table on Product - Market share 2024-2029 (%)
- Exhibits52: Chart on Comparison by Product
- Exhibits53: Data Table on Comparison by Product
- Exhibits54: Chart on Brushes and buffing clothes - Market size and forecast 2024-2029 ($ million)
- Exhibits55: Data Table on Brushes and buffing clothes - Market size and forecast 2024-2029 ($ million)
- Exhibits56: Chart on Brushes and buffing clothes - Year-over-year growth 2024-2029 (%)
- Exhibits57: Data Table on Brushes and buffing clothes - Year-over-year growth 2024-2029 (%)
- Exhibits58: Chart on Polishing creams - Market size and forecast 2024-2029 ($ million)
- Exhibits59: Data Table on Polishing creams - Market size and forecast 2024-2029 ($ million)
- Exhibits60: Chart on Polishing creams - Year-over-year growth 2024-2029 (%)
- Exhibits61: Data Table on Polishing creams - Year-over-year growth 2024-2029 (%)
- Exhibits62: Chart on Waxes and liquids - Market size and forecast 2024-2029 ($ million)
- Exhibits63: Data Table on Waxes and liquids - Market size and forecast 2024-2029 ($ million)
- Exhibits64: Chart on Waxes and liquids - Year-over-year growth 2024-2029 (%)
- Exhibits65: Data Table on Waxes and liquids - Year-over-year growth 2024-2029 (%)
- Exhibits66: Chart on Others - Market size and forecast 2024-2029 ($ million)
- Exhibits67: Data Table on Others - Market size and forecast 2024-2029 ($ million)
- Exhibits68: Chart on Others - Year-over-year growth 2024-2029 (%)
- Exhibits69: Data Table on Others - Year-over-year growth 2024-2029 (%)
- Exhibits70: Market opportunity by Product ($ million)
- Exhibits71: Data Table on Market opportunity by Product ($ million)
- Exhibits72: Analysis of price sensitivity, lifecycle, customer purchase basket, adoption rates, and purchase criteria
- Exhibits73: Chart on Market share By Geographical Landscape 2024-2029 (%)
- Exhibits74: Data Table on Market share By Geographical Landscape 2024-2029 (%)
- Exhibits75: Chart on Geographic comparison
- Exhibits76: Data Table on Geographic comparison
- Exhibits77: Chart on North America - Market size and forecast 2024-2029 ($ million)
- Exhibits78: Data Table on North America - Market size and forecast 2024-2029 ($ million)
- Exhibits79: Chart on North America - Year-over-year growth 2024-2029 (%)
- Exhibits80: Data Table on North America - Year-over-year growth 2024-2029 (%)
- Exhibits81: Chart on Europe - Market size and forecast 2024-2029 ($ million)
- Exhibits82: Data Table on Europe - Market size and forecast 2024-2029 ($ million)
- Exhibits83: Chart on Europe - Year-over-year growth 2024-2029 (%)
- Exhibits84: Data Table on Europe - Year-over-year growth 2024-2029 (%)
- Exhibits85: Chart on APAC - Market size and forecast 2024-2029 ($ million)
- Exhibits86: Data Table on APAC - Market size and forecast 2024-2029 ($ million)
- Exhibits87: Chart on APAC - Year-over-year growth 2024-2029 (%)
- Exhibits88: Data Table on APAC - Year-over-year growth 2024-2029 (%)
- Exhibits89: Chart on Middle East and Africa - Market size and forecast 2024-2029 ($ million)
- Exhibits90: Data Table on Middle East and Africa - Market size and forecast 2024-2029 ($ million)
- Exhibits91: Chart on Middle East and Africa - Year-over-year growth 2024-2029 (%)
- Exhibits92: Data Table on Middle East and Africa - Year-over-year growth 2024-2029 (%)
- Exhibits93: Chart on South America - Market size and forecast 2024-2029 ($ million)
- Exhibits94: Data Table on South America - Market size and forecast 2024-2029 ($ million)
- Exhibits95: Chart on South America - Year-over-year growth 2024-2029 (%)
- Exhibits96: Data Table on South America - Year-over-year growth 2024-2029 (%)
- Exhibits97: Chart on US - Market size and forecast 2024-2029 ($ million)
- Exhibits98: Data Table on US - Market size and forecast 2024-2029 ($ million)
- Exhibits99: Chart on US - Year-over-year growth 2024-2029 (%)
- Exhibits100: Data Table on US - Year-over-year growth 2024-2029 (%)
- Exhibits101: Chart on Germany - Market size and forecast 2024-2029 ($ million)
- Exhibits102: Data Table on Germany - Market size and forecast 2024-2029 ($ million)
- Exhibits103: Chart on Germany - Year-over-year growth 2024-2029 (%)
- Exhibits104: Data Table on Germany - Year-over-year growth 2024-2029 (%)
- Exhibits105: Chart on China - Market size and forecast 2024-2029 ($ million)
- Exhibits106: Data Table on China - Market size and forecast 2024-2029 ($ million)
- Exhibits107: Chart on China - Year-over-year growth 2024-2029 (%)
- Exhibits108: Data Table on China - Year-over-year growth 2024-2029 (%)
- Exhibits109: Chart on Canada - Market size and forecast 2024-2029 ($ million)
- Exhibits110: Data Table on Canada - Market size and forecast 2024-2029 ($ million)
- Exhibits111: Chart on Canada - Year-over-year growth 2024-2029 (%)
- Exhibits112: Data Table on Canada - Year-over-year growth 2024-2029 (%)
- Exhibits113: Chart on Japan - Market size and forecast 2024-2029 ($ million)
- Exhibits114: Data Table on Japan - Market size and forecast 2024-2029 ($ million)
- Exhibits115: Chart on Japan - Year-over-year growth 2024-2029 (%)
- Exhibits116: Data Table on Japan - Year-over-year growth 2024-2029 (%)
- Exhibits117: Chart on France - Market size and forecast 2024-2029 ($ million)
- Exhibits118: Data Table on France - Market size and forecast 2024-2029 ($ million)
- Exhibits119: Chart on France - Year-over-year growth 2024-2029 (%)
- Exhibits120: Data Table on France - Year-over-year growth 2024-2029 (%)
- Exhibits121: Chart on UK - Market size and forecast 2024-2029 ($ million)
- Exhibits122: Data Table on UK - Market size and forecast 2024-2029 ($ million)
- Exhibits123: Chart on UK - Year-over-year growth 2024-2029 (%)
- Exhibits124: Data Table on UK - Year-over-year growth 2024-2029 (%)
- Exhibits125: Chart on India - Market size and forecast 2024-2029 ($ million)
- Exhibits126: Data Table on India - Market size and forecast 2024-2029 ($ million)
- Exhibits127: Chart on India - Year-over-year growth 2024-2029 (%)
- Exhibits128: Data Table on India - Year-over-year growth 2024-2029 (%)
- Exhibits129: Chart on Italy - Market size and forecast 2024-2029 ($ million)
- Exhibits130: Data Table on Italy - Market size and forecast 2024-2029 ($ million)
- Exhibits131: Chart on Italy - Year-over-year growth 2024-2029 (%)
- Exhibits132: Data Table on Italy - Year-over-year growth 2024-2029 (%)
- Exhibits133: Chart on Brazil - Market size and forecast 2024-2029 ($ million)
- Exhibits134: Data Table on Brazil - Market size and forecast 2024-2029 ($ million)
- Exhibits135: Chart on Brazil - Year-over-year growth 2024-2029 (%)
- Exhibits136: Data Table on Brazil - Year-over-year growth 2024-2029 (%)
- Exhibits137: Market opportunity By Geographical Landscape ($ million)
- Exhibits138: Data Tables on Market opportunity By Geographical Landscape ($ million)
- Exhibits139: Impact of drivers and challenges in 2024 and 2029
- Exhibits140: Overview on criticality of inputs and factors of differentiation
- Exhibits141: Overview on factors of disruption
- Exhibits142: Impact of key risks on business
- Exhibits143: Companies covered
- Exhibits144: Company ranking index
- Exhibits145: Matrix on companies position and classification
- Exhibits146: Angelus Shoe Polish - Overview
- Exhibits147: Angelus Shoe Polish - Product / Service
- Exhibits148: Angelus Shoe Polish - Key offerings
- Exhibits149: SWOT
- Exhibits150: C P Marketing Inc. - Overview
- Exhibits151: C P Marketing Inc. - Product / Service
- Exhibits152: C P Marketing Inc. - Key offerings
- Exhibits153: SWOT
- Exhibits154: C.A. Zoes Mfg Co. - Overview
- Exhibits155: C.A. Zoes Mfg Co. - Product / Service
- Exhibits156: C.A. Zoes Mfg Co. - Key offerings
- Exhibits157: SWOT
- Exhibits158: Caleres Inc. - Overview
- Exhibits159: Caleres Inc. - Product / Service
- Exhibits160: Caleres Inc. - Key offerings
- Exhibits161: SWOT
- Exhibits162: Fiebing Co. Inc. - Overview
- Exhibits163: Fiebing Co. Inc. - Product / Service
- Exhibits164: Fiebing Co. Inc. - Key offerings
- Exhibits165: SWOT
- Exhibits166: Grangers International Ltd. - Overview
- Exhibits167: Grangers International Ltd. - Product / Service
- Exhibits168: Grangers International Ltd. - Key offerings
- Exhibits169: SWOT
- Exhibits170: Implus Footcare LLC - Overview
- Exhibits171: Implus Footcare LLC - Product / Service
- Exhibits172: Implus Footcare LLC - Key offerings
- Exhibits173: SWOT
- Exhibits174: Moneysworth and Best Quality Shoe Care - Overview
- Exhibits175: Moneysworth and Best Quality Shoe Care - Product / Service
- Exhibits176: Moneysworth and Best Quality Shoe Care - Key offerings
- Exhibits177: SWOT
- Exhibits178: Rocket Pure Care LLC - Overview
- Exhibits179: Rocket Pure Care LLC - Product / Service
- Exhibits180: Rocket Pure Care LLC - Key offerings
- Exhibits181: SWOT
- Exhibits182: S.C. Johnson and Son Inc. - Overview
- Exhibits183: S.C. Johnson and Son Inc. - Product / Service
- Exhibits184: S.C. Johnson and Son Inc. - Key offerings
- Exhibits185: SWOT
- Exhibits186: Salzenbrodt GmbH and Co. KG - Overview
- Exhibits187: Salzenbrodt GmbH and Co. KG - Product / Service
- Exhibits188: Salzenbrodt GmbH and Co. KG - Key offerings
- Exhibits189: SWOT
- Exhibits190: Shinola - Overview
- Exhibits191: Shinola - Product / Service
- Exhibits192: Shinola - Key offerings
- Exhibits193: SWOT
- Exhibits194: TARRAGO BRANDS INTERNATIONIAL, S.L. - Overview
- Exhibits195: TARRAGO BRANDS INTERNATIONIAL, S.L. - Product / Service
- Exhibits196: TARRAGO BRANDS INTERNATIONIAL, S.L. - Key offerings
- Exhibits197: SWOT
- Exhibits198: TRG BESTNETS SL - Overview
- Exhibits199: TRG BESTNETS SL - Product / Service
- Exhibits200: TRG BESTNETS SL - Key offerings
- Exhibits201: SWOT
- Exhibits202: Woodland Worldwide - Overview
- Exhibits203: Woodland Worldwide - Product / Service
- Exhibits204: Woodland Worldwide - Key offerings
- Exhibits205: SWOT
- Exhibits206: Inclusions checklist
- Exhibits207: Exclusions checklist
- Exhibits208: Currency conversion rates for US$
- Exhibits209: Research methodology
- Exhibits210: Information sources
- Exhibits211: Data validation
- Exhibits212: Validation techniques employed for market sizing
- Exhibits213: Data synthesis
- Exhibits214: 360 degree market analysis
- Exhibits215: List of abbreviations
The shoe care products market is forecasted to grow by USD 284.4 mn during 2024-2029, accelerating at a CAGR of 8% during the forecast period. The report on the shoe care products market provides a holistic analysis, market size and forecast, trends, growth drivers, and challenges, as well as vendor analysis covering around 25 vendors.
The report offers an up-to-date analysis regarding the current market scenario, the latest trends and drivers, and the overall market environment. The market is driven by product innovation and product line extension leading to product premiumization, growing footwear industry, and rising awareness about foot health and shoe cleanliness.
| Market Scope | |
|---|---|
| Base Year | 2025 |
| End Year | 2029 |
| Series Year | 2025-2029 |
| Growth Momentum | Accelerate |
| YOY 2025 | 7.2% |
| CAGR | 8% |
| Incremental Value | $284.4 mn |
Technavio's shoe care products market is segmented as below:
By Distribution Channel
- Offline
- Online
By Product
- Brushes and buffing clothes
- Polishing creams
- Waxes and liquids
- Others
By Geographical Landscape
- North America
- Europe
- APAC
- Middle East and Africa
- South America
This study identifies the increased introduction of shoe care products made of natural ingredients as one of the prime reasons driving the shoe care products market growth during the next few years. Also, rising digital marketing and social media campaigns for consumer engagement and availability of online tutorials regarding use of shoe care products will lead to sizable demand in the market.
The report on the shoe care products market covers the following areas:
- Shoe Care Products Market sizing
- Shoe Care Products Market forecast
- Shoe Care Products Market industry analysis
The robust vendor analysis is designed to help clients improve their market position, and in line with this, this report provides a detailed analysis of several leading shoe care products market vendors that include Angelus Shoe Polish, C P Marketing Inc., C.A. Zoes Mfg Co., Caleres Inc., Fiebing Co. Inc., Grangers International Ltd., Implus Footcare LLC, Lincoln Shoe Polish, M. V. Shoe Care Pvt. Ltd., Moneysworth and Best Quality Shoe Care, OTTER WAX LLC, Payless Shoe Source Inc., Rocket Pure Care LLC, S.C. Johnson and Son Inc., Salzenbrodt GmbH and Co. KG, Shinola, TARRAGO BRANDS INTERNATIONIAL, S.L., The Clinkard Group Ltd., TRG BESTNETS SL, and Woodland Worldwide. Also, the shoe care products market analysis report includes information on upcoming trends and challenges that will influence market growth. This is to help companies strategize and leverage all forthcoming growth opportunities.
The study was conducted using an objective combination of primary and secondary information including inputs from key participants in the industry. The report contains a comprehensive market and vendor landscape in addition to an analysis of the key vendors.
The publisher presents a detailed picture of the market by the way of study, synthesis, and summation of data from multiple sources by an analysis of key parameters such as profit, pricing, competition, and promotions. It presents various market facets by identifying the key industry influencers. The data presented is comprehensive, reliable, and a result of extensive primary and secondary research. The market research reports provide a complete competitive landscape and an in-depth vendor selection methodology and analysis using qualitative and quantitative research to forecast accurate market growth.
Table of Contents
1 Executive Summary
- 1.1 Market overview
- Executive Summary - Chart on Market Overview
- Executive Summary - Data Table on Market Overview
- Executive Summary - Chart on Global Market Characteristics
- Executive Summary - Chart on Market By Geographical Landscape
- Executive Summary - Chart on Market Segmentation by Distribution Channel
- Executive Summary - Chart on Market Segmentation by Product
- Executive Summary - Chart on Incremental Growth
- Executive Summary - Data Table on Incremental Growth
- Executive Summary - Chart on Company Market Positioning
2 Technavio Analysis
- 2.1 Analysis of price sensitivity, lifecycle, customer purchase basket, adoption rates, and purchase criteria
- Analysis of price sensitivity, lifecycle, customer purchase basket, adoption rates, and purchase criteria
- 2.2 Criticality of inputs and Factors of differentiation
- Overview on criticality of inputs and factors of differentiation
- 2.3 Factors of disruption
- Overview on factors of disruption
- 2.4 Impact of drivers and challenges
- Impact of drivers and challenges in 2024 and 2029
3 Market Landscape
- 3.1 Market ecosystem
- Parent Market
- Data Table on - Parent Market
- 3.2 Market characteristics
- Market characteristics analysis
- 3.3 Value chain analysis
- Value chain analysis
4 Market Sizing
- 4.1 Market definition
- Offerings of companies included in the market definition
- 4.2 Market segment analysis
- Market segments
- 4.3 Market size 2024
- 4.4 Market outlook: Forecast for 2024-2029
- Chart on Global - Market size and forecast 2024-2029 ($ million)
- Data Table on Global - Market size and forecast 2024-2029 ($ million)
- Chart on Global Market: Year-over-year growth 2024-2029 (%)
- Data Table on Global Market: Year-over-year growth 2024-2029 (%)
5 Historic Market Size
- 5.1 Global Shoe Care Products Market 2019 - 2023
- Historic Market Size - Data Table on Global Shoe Care Products Market 2019 - 2023 ($ million)
- 5.2 Distribution Channel segment analysis 2019 - 2023
- Historic Market Size - Distribution Channel Segment 2019 - 2023 ($ million)
- 5.3 Product segment analysis 2019 - 2023
- Historic Market Size - Product Segment 2019 - 2023 ($ million)
- 5.4 Geography segment analysis 2019 - 2023
- Historic Market Size - Geography Segment 2019 - 2023 ($ million)
- 5.5 Country segment analysis 2019 - 2023
- Historic Market Size - Country Segment 2019 - 2023 ($ million)
6 Qualitative Analysis
- 6.1 Need for high capital investments
7 Five Forces Analysis
- 7.1 Five forces summary
- Five forces analysis - Comparison between 2024 and 2029
- 7.2 Bargaining power of buyers
- Bargaining power of buyers - Impact of key factors 2024 and 2029
- 7.3 Bargaining power of suppliers
- Bargaining power of suppliers - Impact of key factors in 2024 and 2029
- 7.4 Threat of new entrants
- Threat of new entrants - Impact of key factors in 2024 and 2029
- 7.5 Threat of substitutes
- Threat of substitutes - Impact of key factors in 2024 and 2029
- 7.6 Threat of rivalry
- Threat of rivalry - Impact of key factors in 2024 and 2029
- 7.7 Market condition
- Chart on Market condition - Five forces 2024 and 2029
8 Market Segmentation by Distribution Channel
- 8.1 Market segments
- Chart on Distribution Channel - Market share 2024-2029 (%)
- Data Table on Distribution Channel - Market share 2024-2029 (%)
- 8.2 Comparison by Distribution Channel
- Chart on Comparison by Distribution Channel
- Data Table on Comparison by Distribution Channel
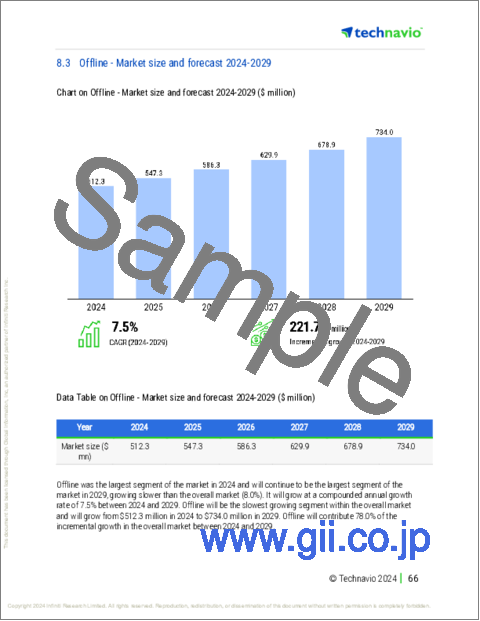
- 8.3 Offline - Market size and forecast 2024-2029
- Chart on Offline - Market size and forecast 2024-2029 ($ million)
- Data Table on Offline - Market size and forecast 2024-2029 ($ million)
- Chart on Offline - Year-over-year growth 2024-2029 (%)
- Data Table on Offline - Year-over-year growth 2024-2029 (%)
- 8.4 Online - Market size and forecast 2024-2029
- Chart on Online - Market size and forecast 2024-2029 ($ million)
- Data Table on Online - Market size and forecast 2024-2029 ($ million)
- Chart on Online - Year-over-year growth 2024-2029 (%)
- Data Table on Online - Year-over-year growth 2024-2029 (%)
- 8.5 Market opportunity by Distribution Channel
- Market opportunity by Distribution Channel ($ million)
- Data Table on Market opportunity by Distribution Channel ($ million)
9 Market Segmentation by Product
- 9.1 Market segments
- Chart on Product - Market share 2024-2029 (%)
- Data Table on Product - Market share 2024-2029 (%)
- 9.2 Comparison by Product
- Chart on Comparison by Product
- Data Table on Comparison by Product
- 9.3 Brushes and buffing clothes - Market size and forecast 2024-2029
- Chart on Brushes and buffing clothes - Market size and forecast 2024-2029 ($ million)
- Data Table on Brushes and buffing clothes - Market size and forecast 2024-2029 ($ million)
- Chart on Brushes and buffing clothes - Year-over-year growth 2024-2029 (%)
- Data Table on Brushes and buffing clothes - Year-over-year growth 2024-2029 (%)
- 9.4 Polishing creams - Market size and forecast 2024-2029
- Chart on Polishing creams - Market size and forecast 2024-2029 ($ million)
- Data Table on Polishing creams - Market size and forecast 2024-2029 ($ million)
- Chart on Polishing creams - Year-over-year growth 2024-2029 (%)
- Data Table on Polishing creams - Year-over-year growth 2024-2029 (%)
- 9.5 Waxes and liquids - Market size and forecast 2024-2029
- Chart on Waxes and liquids - Market size and forecast 2024-2029 ($ million)
- Data Table on Waxes and liquids - Market size and forecast 2024-2029 ($ million)
- Chart on Waxes and liquids - Year-over-year growth 2024-2029 (%)
- Data Table on Waxes and liquids - Year-over-year growth 2024-2029 (%)
- 9.6 Others - Market size and forecast 2024-2029
- Chart on Others - Market size and forecast 2024-2029 ($ million)
- Data Table on Others - Market size and forecast 2024-2029 ($ million)
- Chart on Others - Year-over-year growth 2024-2029 (%)
- Data Table on Others - Year-over-year growth 2024-2029 (%)
- 9.7 Market opportunity by Product
- Market opportunity by Product ($ million)
- Data Table on Market opportunity by Product ($ million)
10 Customer Landscape
- 10.1 Customer landscape overview
- Analysis of price sensitivity, lifecycle, customer purchase basket, adoption rates, and purchase criteria
11 Geographic Landscape
- 11.1 Geographic segmentation
- Chart on Market share By Geographical Landscape 2024-2029 (%)
- Data Table on Market share By Geographical Landscape 2024-2029 (%)
- 11.2 Geographic comparison
- Chart on Geographic comparison
- Data Table on Geographic comparison
- 11.3 North America - Market size and forecast 2024-2029
- Chart on North America - Market size and forecast 2024-2029 ($ million)
- Data Table on North America - Market size and forecast 2024-2029 ($ million)
- Chart on North America - Year-over-year growth 2024-2029 (%)
- Data Table on North America - Year-over-year growth 2024-2029 (%)
- 11.4 Europe - Market size and forecast 2024-2029
- Chart on Europe - Market size and forecast 2024-2029 ($ million)
- Data Table on Europe - Market size and forecast 2024-2029 ($ million)
- Chart on Europe - Year-over-year growth 2024-2029 (%)
- Data Table on Europe - Year-over-year growth 2024-2029 (%)
- 11.5 APAC - Market size and forecast 2024-2029
- Chart on APAC - Market size and forecast 2024-2029 ($ million)
- Data Table on APAC - Market size and forecast 2024-2029 ($ million)
- Chart on APAC - Year-over-year growth 2024-2029 (%)
- Data Table on APAC - Year-over-year growth 2024-2029 (%)
- 11.6 Middle East and Africa - Market size and forecast 2024-2029
- Chart on Middle East and Africa - Market size and forecast 2024-2029 ($ million)
- Data Table on Middle East and Africa - Market size and forecast 2024-2029 ($ million)
- Chart on Middle East and Africa - Year-over-year growth 2024-2029 (%)
- Data Table on Middle East and Africa - Year-over-year growth 2024-2029 (%)
- 11.7 South America - Market size and forecast 2024-2029
- Chart on South America - Market size and forecast 2024-2029 ($ million)
- Data Table on South America - Market size and forecast 2024-2029 ($ million)
- Chart on South America - Year-over-year growth 2024-2029 (%)
- Data Table on South America - Year-over-year growth 2024-2029 (%)
- 11.8 US - Market size and forecast 2024-2029
- Chart on US - Market size and forecast 2024-2029 ($ million)
- Data Table on US - Market size and forecast 2024-2029 ($ million)
- Chart on US - Year-over-year growth 2024-2029 (%)
- Data Table on US - Year-over-year growth 2024-2029 (%)
- 11.9 Germany - Market size and forecast 2024-2029
- Chart on Germany - Market size and forecast 2024-2029 ($ million)
- Data Table on Germany - Market size and forecast 2024-2029 ($ million)
- Chart on Germany - Year-over-year growth 2024-2029 (%)
- Data Table on Germany - Year-over-year growth 2024-2029 (%)
- 11.10 China - Market size and forecast 2024-2029
- Chart on China - Market size and forecast 2024-2029 ($ million)
- Data Table on China - Market size and forecast 2024-2029 ($ million)
- Chart on China - Year-over-year growth 2024-2029 (%)
- Data Table on China - Year-over-year growth 2024-2029 (%)
- 11.11 Canada - Market size and forecast 2024-2029
- Chart on Canada - Market size and forecast 2024-2029 ($ million)
- Data Table on Canada - Market size and forecast 2024-2029 ($ million)
- Chart on Canada - Year-over-year growth 2024-2029 (%)
- Data Table on Canada - Year-over-year growth 2024-2029 (%)
- 11.12 Japan - Market size and forecast 2024-2029
- Chart on Japan - Market size and forecast 2024-2029 ($ million)
- Data Table on Japan - Market size and forecast 2024-2029 ($ million)
- Chart on Japan - Year-over-year growth 2024-2029 (%)
- Data Table on Japan - Year-over-year growth 2024-2029 (%)
- 11.13 France - Market size and forecast 2024-2029
- Chart on France - Market size and forecast 2024-2029 ($ million)
- Data Table on France - Market size and forecast 2024-2029 ($ million)
- Chart on France - Year-over-year growth 2024-2029 (%)
- Data Table on France - Year-over-year growth 2024-2029 (%)
- 11.14 UK - Market size and forecast 2024-2029
- Chart on UK - Market size and forecast 2024-2029 ($ million)
- Data Table on UK - Market size and forecast 2024-2029 ($ million)
- Chart on UK - Year-over-year growth 2024-2029 (%)
- Data Table on UK - Year-over-year growth 2024-2029 (%)
- 11.15 India - Market size and forecast 2024-2029
- Chart on India - Market size and forecast 2024-2029 ($ million)
- Data Table on India - Market size and forecast 2024-2029 ($ million)
- Chart on India - Year-over-year growth 2024-2029 (%)
- Data Table on India - Year-over-year growth 2024-2029 (%)
- 11.16 Italy - Market size and forecast 2024-2029
- Chart on Italy - Market size and forecast 2024-2029 ($ million)
- Data Table on Italy - Market size and forecast 2024-2029 ($ million)
- Chart on Italy - Year-over-year growth 2024-2029 (%)
- Data Table on Italy - Year-over-year growth 2024-2029 (%)
- 11.17 Brazil - Market size and forecast 2024-2029
- Chart on Brazil - Market size and forecast 2024-2029 ($ million)
- Data Table on Brazil - Market size and forecast 2024-2029 ($ million)
- Chart on Brazil - Year-over-year growth 2024-2029 (%)
- Data Table on Brazil - Year-over-year growth 2024-2029 (%)
- 11.18 Market opportunity By Geographical Landscape
- Market opportunity By Geographical Landscape ($ million)
- Data Tables on Market opportunity By Geographical Landscape ($ million)
12 Drivers, Challenges, and Opportunity/Restraints
- 12.1 Market drivers
- 12.2 Market challenges
- 12.3 Impact of drivers and challenges
- Impact of drivers and challenges in 2024 and 2029
- 12.4 Market opportunities/restraints
13 Competitive Landscape
- 13.1 Overview
- 13.2 Competitive Landscape
- Overview on criticality of inputs and factors of differentiation
- 13.3 Landscape disruption
- Overview on factors of disruption
- 13.4 Industry risks
- Impact of key risks on business
14 Competitive Analysis
- 14.1 Companies profiled
- Companies covered
- 14.2 Company ranking index
- Company ranking index
- 14.3 Market positioning of companies
- Matrix on companies position and classification
- 14.4 Angelus Shoe Polish
- Angelus Shoe Polish - Overview
- Angelus Shoe Polish - Product / Service
- Angelus Shoe Polish - Key offerings
- SWOT
- 14.5 C P Marketing Inc.
- C P Marketing Inc. - Overview
- C P Marketing Inc. - Product / Service
- C P Marketing Inc. - Key offerings
- SWOT
- 14.6 C.A. Zoes Mfg Co.
- C.A. Zoes Mfg Co. - Overview
- C.A. Zoes Mfg Co. - Product / Service
- C.A. Zoes Mfg Co. - Key offerings
- SWOT
- 14.7 Caleres Inc.
- Caleres Inc. - Overview
- Caleres Inc. - Product / Service
- Caleres Inc. - Key offerings
- SWOT
- 14.8 Fiebing Co. Inc.
- Fiebing Co. Inc. - Overview
- Fiebing Co. Inc. - Product / Service
- Fiebing Co. Inc. - Key offerings
- SWOT
- 14.9 Grangers International Ltd.
- Grangers International Ltd. - Overview
- Grangers International Ltd. - Product / Service
- Grangers International Ltd. - Key offerings
- SWOT
- 14.10 Implus Footcare LLC
- Implus Footcare LLC - Overview
- Implus Footcare LLC - Product / Service
- Implus Footcare LLC - Key offerings
- SWOT
- 14.11 Moneysworth and Best Quality Shoe Care
- Moneysworth and Best Quality Shoe Care - Overview
- Moneysworth and Best Quality Shoe Care - Product / Service
- Moneysworth and Best Quality Shoe Care - Key offerings
- SWOT
- 14.12 Rocket Pure Care LLC
- Rocket Pure Care LLC - Overview
- Rocket Pure Care LLC - Product / Service
- Rocket Pure Care LLC - Key offerings
- SWOT
- 14.13 S.C. Johnson and Son Inc.
- S.C. Johnson and Son Inc. - Overview
- S.C. Johnson and Son Inc. - Product / Service
- S.C. Johnson and Son Inc. - Key offerings
- SWOT
- 14.14 Salzenbrodt GmbH and Co. KG
- Salzenbrodt GmbH and Co. KG - Overview
- Salzenbrodt GmbH and Co. KG - Product / Service
- Salzenbrodt GmbH and Co. KG - Key offerings
- SWOT
- 14.15 Shinola
- Shinola - Overview
- Shinola - Product / Service
- Shinola - Key offerings
- SWOT
- 14.16 TARRAGO BRANDS INTERNATIONIAL, S.L.
- TARRAGO BRANDS INTERNATIONIAL, S.L. - Overview
- TARRAGO BRANDS INTERNATIONIAL, S.L. - Product / Service
- TARRAGO BRANDS INTERNATIONIAL, S.L. - Key offerings
- SWOT
- 14.17 TRG BESTNETS SL
- TRG BESTNETS SL - Overview
- TRG BESTNETS SL - Product / Service
- TRG BESTNETS SL - Key offerings
- SWOT
- 14.18 Woodland Worldwide
- Woodland Worldwide - Overview
- Woodland Worldwide - Product / Service
- Woodland Worldwide - Key offerings
- SWOT
15 Appendix
- 15.1 Scope of the report
- 15.2 Inclusions and exclusions checklist
- Inclusions checklist
- Exclusions checklist
- 15.3 Currency conversion rates for US$
- Currency conversion rates for US$
- 15.4 Research methodology
- Research methodology
- 15.5 Data procurement
- Information sources
- 15.6 Data validation
- Data validation
- 15.7 Validation techniques employed for market sizing
- Validation techniques employed for market sizing
- 15.8 Data synthesis
- Data synthesis
- 15.9 360 degree market analysis
- 360 degree market analysis
- 15.10 List of abbreviations
- List of abbreviations

