|
|
市場調査レポート
商品コード
1515795
産業用ラック&ピニオンの世界市場 2024-2028Global industrial rack and pinion market 2024-2028 |
||||||

|
|||||||
カスタマイズ可能
|
|||||||

| 産業用ラック&ピニオンの世界市場 2024-2028 |
|
出版日: 2024年05月22日
発行: TechNavio
ページ情報: 英文 172 Pages
納期: 即納可能
|

全表示
- 概要
- 図表
- 目次
産業用ラック&ピニオン市場2024-2028
産業用ラック&ピニオン市場は2023-2028年に9億9,860万米ドル、予測期間中のCAGRは9.45%で成長すると予測されます。当レポートでは、産業用ラック&ピニオン市場の全体的な分析、市場規模・予測、動向、成長促進要因、課題、約25のベンダーを網羅したベンダー分析などを掲載しています。
現在の市場シナリオ、最新動向と促進要因、市場環境全体に関する最新分析を提供しています。市場は、工作機械需要の増加につながる産業製造業の成長、プロセス産業におけるアクチュエータ需要の増加、軍事用途への投資の増加によって牽引されています。
| 市場範囲 | |
|---|---|
| 基準年 | 2024 |
| 終了年 | 2028 |
| 予測期間 | 2024-2028 |
| 成長モメンタム | 加速 |
| 前年比2024年 | 8.41% |
| CAGR | 9.45% |
| 増分額 | 9億9,860万米ドル |
本調査では、今後数年間の産業用ラック&ピニオン市場成長を牽引する主要因の1つとして、オフィスにおける階段昇降機需要の増加を挙げています。また、バックラッシュがゼロまたはゼロに近いラック&ピニオンシステムに対するニーズの高まりや、ラック&ピニオンシステムにおけるIoTと状態監視の統合は、市場の大きな需要につながります。
目次
第1章 エグゼクティブサマリー
- 市場概要
第2章 市場情勢
- 市場エコシステム
- 市場の特徴
- バリューチェーン分析
第3章 市場規模の評価
- 市場の定義
- 市場セグメント分析
- 市場規模 2023
- 市場の見通し 2023-2028
第4章 市場規模実績
- 世界産業用ラック&ピニオン市場 2018-2022
- 製品別セグメント分析 2018-2022
- タイプ別セグメント分析 2018-2022
- 地域別セグメント分析 2018-2022
- 国別セグメント分析 2018-2022
第5章 ファイブフォース分析
- ファイブフォースの要約
- 買い手の交渉力
- 供給企業の交渉力
- 新規参入業者の脅威
- 代替品の脅威
- 競争の脅威
- 市況
第6章 市場セグメンテーション:製品別
- 市場セグメンテーション
- 比較:製品別
- 工作機械:市場規模と予測 2023-2028
- リニアアクチュエータとガイドウェイ:市場規模と予測 2023-2028
- マテリアルハンドリング:市場規模と予測 2023-2028
- 市場機会:製品別
第7章 市場セグメンテーション:タイプ別
- 市場セグメンテーション
- 比較:タイプ別
- 合金鋼:市場規模と予測 2023-2028
- 炭素鋼:市場規模と予測 2023-2028
- ステンレス鋼:市場規模と予測 2023-2028
- アルミニウム合金:市場規模と予測 2023-2028
- プラスチック:市場規模と予測 2023-2028
- 市場機会:タイプ別
第8章 顧客情勢
- 顧客情勢の概要
第9章 地域別情勢
- 地域別セグメンテーション
- 地域別比較
- アジア太平洋:市場規模と予測 2023-2028
- 欧州:市場規模と予測 2023-2028
- 北米:市場規模と予測 2023-2028
- 中東・アフリカ:市場規模と予測 2023-2028
- 南米:市場規模と予測 2023-2028
- 中国:市場規模と予測 2023-2028
- 米国:市場規模と予測 2023-2028
- ドイツ:市場規模と予測 2023-2028
- インド:市場規模と予測 2023-2028
- カナダ:市場規模と予測 2023-2028
- 市場機会:地域情勢別
第10章 促進要因・課題・機会・抑制要因
- 市場促進要因
- 市場の課題
- 促進要因と課題の影響
- 市場の機会・抑制要因
第11章 競合情勢
- 概要
- 競合情勢
- 混乱の状況
- 業界のリスク
第12章 競合分析
- 企業プロファイル
- 企業の市場ポジショニング
- Apex Dynamics Inc.
- ATLANTA Antriebssysteme GmbH
- B and B Manufacturing Inc.
- Commercial Gear and Sprocket Co. Inc.
- GAM Enterprises Inc.
- Gudel Group AG
- HMK Automation Group Ltd.
- Kohara Gear Industry Co. Ltd.
- Lomar Machine and Tool Co.
- MIJNO PRECISION GEARING SAS
- Nexen Group Inc.
- Nidec Corp.
- REDEX Group
- Reliance Precision Ltd.
- Sati SpA
第13章 付録
Exhibits:
- Exhibits1: Executive Summary - Chart on Market Overview
- Exhibits2: Executive Summary - Data Table on Market Overview
- Exhibits3: Executive Summary - Chart on Global Market Characteristics
- Exhibits4: Executive Summary - Chart on Market By Geographical Landscape
- Exhibits5: Executive Summary - Chart on Market Segmentation by Product
- Exhibits6: Executive Summary - Chart on Market Segmentation by Type
- Exhibits7: Executive Summary - Chart on Incremental Growth
- Exhibits8: Executive Summary - Data Table on Incremental Growth
- Exhibits9: Executive Summary - Chart on Company Market Positioning
- Exhibits10: Parent Market
- Exhibits11: Data Table on - Parent Market
- Exhibits12: Market characteristics analysis
- Exhibits13: Value Chain Analysis
- Exhibits14: Offerings of companies included in the market definition
- Exhibits15: Market segments
- Exhibits16: Chart on Global - Market size and forecast 2023-2028 ($ million)
- Exhibits17: Data Table on Global - Market size and forecast 2023-2028 ($ million)
- Exhibits18: Chart on Global Market: Year-over-year growth 2023-2028 (%)
- Exhibits19: Data Table on Global Market: Year-over-year growth 2023-2028 (%)
- Exhibits20: Historic Market Size - Data Table on Global Industrial Rack And Pinion Market 2018 - 2022 ($ million)
- Exhibits21: Historic Market Size - Product Segment 2018 - 2022 ($ million)
- Exhibits22: Historic Market Size - Type Segment 2018 - 2022 ($ million)
- Exhibits23: Historic Market Size - Geography Segment 2018 - 2022 ($ million)
- Exhibits24: Historic Market Size - Country Segment 2018 - 2022 ($ million)
- Exhibits25: Five forces analysis - Comparison between 2023 and 2028
- Exhibits26: Bargaining power of buyers - Impact of key factors 2023 and 2028
- Exhibits27: Bargaining power of suppliers - Impact of key factors in 2023 and 2028
- Exhibits28: Threat of new entrants - Impact of key factors in 2023 and 2028
- Exhibits29: Threat of substitutes - Impact of key factors in 2023 and 2028
- Exhibits30: Threat of rivalry - Impact of key factors in 2023 and 2028
- Exhibits31: Chart on Market condition - Five forces 2023 and 2028
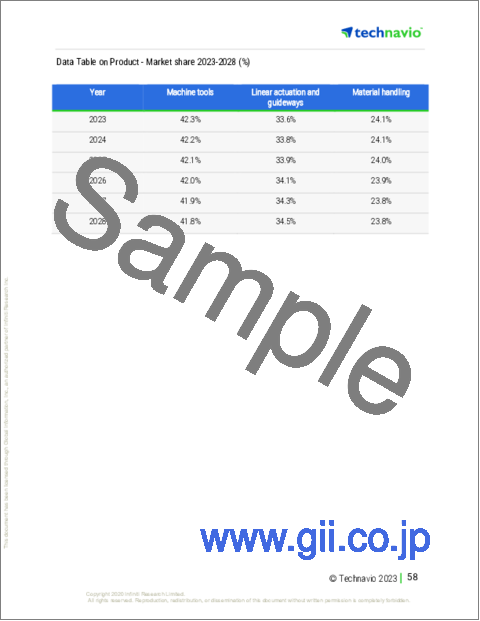
- Exhibits32: Chart on Product - Market share 2023-2028 (%)
- Exhibits33: Data Table on Product - Market share 2023-2028 (%)
- Exhibits34: Chart on Comparison by Product
- Exhibits35: Data Table on Comparison by Product
- Exhibits36: Chart on Machine tools - Market size and forecast 2023-2028 ($ million)
- Exhibits37: Data Table on Machine tools - Market size and forecast 2023-2028 ($ million)
- Exhibits38: Chart on Machine tools - Year-over-year growth 2023-2028 (%)
- Exhibits39: Data Table on Machine tools - Year-over-year growth 2023-2028 (%)
- Exhibits40: Chart on Linear actuation and guideways - Market size and forecast 2023-2028 ($ million)
- Exhibits41: Data Table on Linear actuation and guideways - Market size and forecast 2023-2028 ($ million)
- Exhibits42: Chart on Linear actuation and guideways - Year-over-year growth 2023-2028 (%)
- Exhibits43: Data Table on Linear actuation and guideways - Year-over-year growth 2023-2028 (%)
- Exhibits44: Chart on Material handling - Market size and forecast 2023-2028 ($ million)
- Exhibits45: Data Table on Material handling - Market size and forecast 2023-2028 ($ million)
- Exhibits46: Chart on Material handling - Year-over-year growth 2023-2028 (%)
- Exhibits47: Data Table on Material handling - Year-over-year growth 2023-2028 (%)
- Exhibits48: Market opportunity by Product ($ million)
- Exhibits49: Data Table on Market opportunity by Product ($ million)
- Exhibits50: Chart on Type - Market share 2023-2028 (%)
- Exhibits51: Data Table on Type - Market share 2023-2028 (%)
- Exhibits52: Chart on Comparison by Type
- Exhibits53: Data Table on Comparison by Type
- Exhibits54: Chart on Alloy steel - Market size and forecast 2023-2028 ($ million)
- Exhibits55: Data Table on Alloy steel - Market size and forecast 2023-2028 ($ million)
- Exhibits56: Chart on Alloy steel - Year-over-year growth 2023-2028 (%)
- Exhibits57: Data Table on Alloy steel - Year-over-year growth 2023-2028 (%)
- Exhibits58: Chart on Carbon steel - Market size and forecast 2023-2028 ($ million)
- Exhibits59: Data Table on Carbon steel - Market size and forecast 2023-2028 ($ million)
- Exhibits60: Chart on Carbon steel - Year-over-year growth 2023-2028 (%)
- Exhibits61: Data Table on Carbon steel - Year-over-year growth 2023-2028 (%)
- Exhibits62: Chart on Stainless steel - Market size and forecast 2023-2028 ($ million)
- Exhibits63: Data Table on Stainless steel - Market size and forecast 2023-2028 ($ million)
- Exhibits64: Chart on Stainless steel - Year-over-year growth 2023-2028 (%)
- Exhibits65: Data Table on Stainless steel - Year-over-year growth 2023-2028 (%)
- Exhibits66: Chart on Aluminum alloy - Market size and forecast 2023-2028 ($ million)
- Exhibits67: Data Table on Aluminum alloy - Market size and forecast 2023-2028 ($ million)
- Exhibits68: Chart on Aluminum alloy - Year-over-year growth 2023-2028 (%)
- Exhibits69: Data Table on Aluminum alloy - Year-over-year growth 2023-2028 (%)
- Exhibits70: Chart on Plastic - Market size and forecast 2023-2028 ($ million)
- Exhibits71: Data Table on Plastic - Market size and forecast 2023-2028 ($ million)
- Exhibits72: Chart on Plastic - Year-over-year growth 2023-2028 (%)
- Exhibits73: Data Table on Plastic - Year-over-year growth 2023-2028 (%)
- Exhibits74: Market opportunity by Type ($ million)
- Exhibits75: Data Table on Market opportunity by Type ($ million)
- Exhibits76: Analysis of price sensitivity, lifecycle, customer purchase basket, adoption rates, and purchase criteria
- Exhibits77: Chart on Market share By Geographical Landscape 2023-2028 (%)
- Exhibits78: Data Table on Market share By Geographical Landscape 2023-2028 (%)
- Exhibits79: Chart on Geographic comparison
- Exhibits80: Data Table on Geographic comparison
- Exhibits81: Chart on APAC - Market size and forecast 2023-2028 ($ million)
- Exhibits82: Data Table on APAC - Market size and forecast 2023-2028 ($ million)
- Exhibits83: Chart on APAC - Year-over-year growth 2023-2028 (%)
- Exhibits84: Data Table on APAC - Year-over-year growth 2023-2028 (%)
- Exhibits85: Chart on Europe - Market size and forecast 2023-2028 ($ million)
- Exhibits86: Data Table on Europe - Market size and forecast 2023-2028 ($ million)
- Exhibits87: Chart on Europe - Year-over-year growth 2023-2028 (%)
- Exhibits88: Data Table on Europe - Year-over-year growth 2023-2028 (%)
- Exhibits89: Chart on North America - Market size and forecast 2023-2028 ($ million)
- Exhibits90: Data Table on North America - Market size and forecast 2023-2028 ($ million)
- Exhibits91: Chart on North America - Year-over-year growth 2023-2028 (%)
- Exhibits92: Data Table on North America - Year-over-year growth 2023-2028 (%)
- Exhibits93: Chart on Middle East and Africa - Market size and forecast 2023-2028 ($ million)
- Exhibits94: Data Table on Middle East and Africa - Market size and forecast 2023-2028 ($ million)
- Exhibits95: Chart on Middle East and Africa - Year-over-year growth 2023-2028 (%)
- Exhibits96: Data Table on Middle East and Africa - Year-over-year growth 2023-2028 (%)
- Exhibits97: Chart on South America - Market size and forecast 2023-2028 ($ million)
- Exhibits98: Data Table on South America - Market size and forecast 2023-2028 ($ million)
- Exhibits99: Chart on South America - Year-over-year growth 2023-2028 (%)
- Exhibits100: Data Table on South America - Year-over-year growth 2023-2028 (%)
- Exhibits101: Chart on China - Market size and forecast 2023-2028 ($ million)
- Exhibits102: Data Table on China - Market size and forecast 2023-2028 ($ million)
- Exhibits103: Chart on China - Year-over-year growth 2023-2028 (%)
- Exhibits104: Data Table on China - Year-over-year growth 2023-2028 (%)
- Exhibits105: Chart on US - Market size and forecast 2023-2028 ($ million)
- Exhibits106: Data Table on US - Market size and forecast 2023-2028 ($ million)
- Exhibits107: Chart on US - Year-over-year growth 2023-2028 (%)
- Exhibits108: Data Table on US - Year-over-year growth 2023-2028 (%)
- Exhibits109: Chart on Germany - Market size and forecast 2023-2028 ($ million)
- Exhibits110: Data Table on Germany - Market size and forecast 2023-2028 ($ million)
- Exhibits111: Chart on Germany - Year-over-year growth 2023-2028 (%)
- Exhibits112: Data Table on Germany - Year-over-year growth 2023-2028 (%)
- Exhibits113: Chart on India - Market size and forecast 2023-2028 ($ million)
- Exhibits114: Data Table on India - Market size and forecast 2023-2028 ($ million)
- Exhibits115: Chart on India - Year-over-year growth 2023-2028 (%)
- Exhibits116: Data Table on India - Year-over-year growth 2023-2028 (%)
- Exhibits117: Chart on Canada - Market size and forecast 2023-2028 ($ million)
- Exhibits118: Data Table on Canada - Market size and forecast 2023-2028 ($ million)
- Exhibits119: Chart on Canada - Year-over-year growth 2023-2028 (%)
- Exhibits120: Data Table on Canada - Year-over-year growth 2023-2028 (%)
- Exhibits121: Market opportunity By Geographical Landscape ($ million)
- Exhibits122: Data Tables on Market opportunity By Geographical Landscape ($ million)
- Exhibits123: Impact of drivers and challenges in 2023 and 2028
- Exhibits124: Overview on criticality of inputs and factors of differentiation
- Exhibits125: Overview on factors of disruption
- Exhibits126: Impact of key risks on business
- Exhibits127: Companies covered
- Exhibits128: Matrix on companies position and classification
- Exhibits129: Apex Dynamics Inc. - Overview
- Exhibits130: Apex Dynamics Inc. - Product / Service
- Exhibits131: Apex Dynamics Inc. - Key offerings
- Exhibits132: ATLANTA Antriebssysteme GmbH - Overview
- Exhibits133: ATLANTA Antriebssysteme GmbH - Product / Service
- Exhibits134: ATLANTA Antriebssysteme GmbH - Key offerings
- Exhibits135: B and B Manufacturing Inc. - Overview
- Exhibits136: B and B Manufacturing Inc. - Product / Service
- Exhibits137: B and B Manufacturing Inc. - Key offerings
- Exhibits138: Commercial Gear and Sprocket Co. Inc. - Overview
- Exhibits139: Commercial Gear and Sprocket Co. Inc. - Product / Service
- Exhibits140: Commercial Gear and Sprocket Co. Inc. - Key offerings
- Exhibits141: GAM Enterprises Inc. - Overview
- Exhibits142: GAM Enterprises Inc. - Product / Service
- Exhibits143: GAM Enterprises Inc. - Key offerings
- Exhibits144: Gudel Group AG - Overview
- Exhibits145: Gudel Group AG - Product / Service
- Exhibits146: Gudel Group AG - Key offerings
- Exhibits147: HMK Automation Group Ltd. - Overview
- Exhibits148: HMK Automation Group Ltd. - Product / Service
- Exhibits149: HMK Automation Group Ltd. - Key offerings
- Exhibits150: Kohara Gear Industry Co. Ltd. - Overview
- Exhibits151: Kohara Gear Industry Co. Ltd. - Product / Service
- Exhibits152: Kohara Gear Industry Co. Ltd. - Key offerings
- Exhibits153: Lomar Machine and Tool Co. - Overview
- Exhibits154: Lomar Machine and Tool Co. - Product / Service
- Exhibits155: Lomar Machine and Tool Co. - Key offerings
- Exhibits156: MIJNO PRECISION GEARING SAS - Overview
- Exhibits157: MIJNO PRECISION GEARING SAS - Product / Service
- Exhibits158: MIJNO PRECISION GEARING SAS - Key offerings
- Exhibits159: Nexen Group Inc. - Overview
- Exhibits160: Nexen Group Inc. - Product / Service
- Exhibits161: Nexen Group Inc. - Key offerings
- Exhibits162: Nidec Corp. - Overview
- Exhibits163: Nidec Corp. - Business segments
- Exhibits164: Nidec Corp. - Key offerings
- Exhibits165: Nidec Corp. - Segment focus
- Exhibits166: REDEX Group - Overview
- Exhibits167: REDEX Group - Product / Service
- Exhibits168: REDEX Group - Key offerings
- Exhibits169: Reliance Precision Ltd. - Overview
- Exhibits170: Reliance Precision Ltd. - Product / Service
- Exhibits171: Reliance Precision Ltd. - Key offerings
- Exhibits172: Sati SpA - Overview
- Exhibits173: Sati SpA - Product / Service
- Exhibits174: Sati SpA - Key offerings
- Exhibits175: Inclusions checklist
- Exhibits176: Exclusions checklist
- Exhibits177: Currency conversion rates for US$
- Exhibits178: Research methodology
- Exhibits179: Information sources
- Exhibits180: Data validation
- Exhibits181: Validation techniques employed for market sizing
- Exhibits182: Data synthesis
- Exhibits183: 360 degree market analysis
- Exhibits184: List of abbreviations
Industrial Rack And Pinion Market 2024-2028
The industrial rack and pinion market is forecasted to grow by USD 998.6 mn during 2023-2028, accelerating at a CAGR of 9.45% during the forecast period. The report on the industrial rack and pinion market provides a holistic analysis, market size and forecast, trends, growth drivers, and challenges, as well as vendor analysis covering around 25 vendors.
The report offers an up-to-date analysis regarding the current market scenario, the latest trends and drivers, and the overall market environment. The market is driven by growth of industrial manufacturing leading to increase in demand for machine tools, increasing demand for actuators in process industries, and growing investments in military application.
| Market Scope | |
|---|---|
| Base Year | 2024 |
| End Year | 2028 |
| Series Year | 2024-2028 |
| Growth Momentum | Accelerate |
| YOY 2024 | 8.41% |
| CAGR | 9.45% |
| Incremental Value | $998.6mn |
Technavio's industrial rack and pinion market is segmented as below:
ByProduct
- Machine tools
- Linear actuation and guideways
- Material handling
ByType
- Alloy steel
- Carbon steel
- Stainless steel
- Aluminum alloy
- Plastic
ByGeography
- APAC
- Europe
- North America
- Middle East and Africa
- South America
This study identifies the increasing demand for stairlifts in offices as one of the prime reasons driving the industrial rack and pinion market growth during the next few years. Also, growing need for rack and pinion systems with zero or near-zero backlash and integration of IoT and condition monitoring in rack and pinion systems will lead to sizable demand in the market.
The report on the industrial rack and pinion market covers the following areas:
- Industrial rack and pinion market sizing
- Industrial rack and pinion market forecast
- Industrial rack and pinion market industry analysis
The robust vendor analysis is designed to help clients improve their market position, and in line with this, this report provides a detailed analysis of several leading industrial rack and pinion market vendors that include Apex Dynamics Inc., ATLANTA Antriebssysteme GmbH, B and B Manufacturing Inc., Commercial Gear and Sprocket Co. Inc., GAM Enterprises Inc., Gudel Group AG, HMK Automation Group Ltd., Kohara Gear Industry Co. Ltd., Lomar Machine and Tool Co., MIJNO PRECISION GEARING SAS, Nexen Group Inc., Nidec Corp., P R Components Pvt. Ltd., Pearl Engineers, REDEX Group, Reliance Precision Ltd., Sati SpA, Shri Butbhavani Engineering, Statewide Bearings, and Yuan Yi Chang Machinery Co. Ltd.. Also, the industrial rack and pinion market analysis report includes information on upcoming trends and challenges that will influence market growth. This is to help companies strategize and leverage all forthcoming growth opportunities.
The study was conducted using an objective combination of primary and secondary information including inputs from key participants in the industry. The report contains a comprehensive market and vendor landscape in addition to an analysis of the key vendors.
The publisher presents a detailed picture of the market by the way of study, synthesis, and summation of data from multiple sources by an analysis of key parameters such as profit, pricing, competition, and promotions. It presents various market facets by identifying the key industry influencers. The data presented is comprehensive, reliable, and a result of extensive research - both primary and secondary. The market research reports provide a complete competitive landscape and an in-depth vendor selection methodology and analysis using qualitative and quantitative research to forecast the accurate market growth.
Table of Contents
1 Executive Summary
- 1.1 Market overview
- Executive Summary - Chart on Market Overview
- Executive Summary - Data Table on Market Overview
- Executive Summary - Chart on Global Market Characteristics
- Executive Summary - Chart on Market By Geographical Landscape
- Executive Summary - Chart on Market Segmentation by Product
- Executive Summary - Chart on Market Segmentation by Type
- Executive Summary - Chart on Incremental Growth
- Executive Summary - Data Table on Incremental Growth
- Executive Summary - Chart on Company Market Positioning
2 Market Landscape
- 2.1 Market ecosystem
- Parent Market
- Data Table on - Parent Market
- 2.2 Market characteristics
- Market characteristics analysis
- 2.3 Value chain analysis
- Value Chain Analysis
3 Market Sizing
- 3.1 Market definition
- Offerings of companies included in the market definition
- 3.2 Market segment analysis
- Market segments
- 3.3 Market size 2023
- 3.4 Market outlook: Forecast for 2023-2028
- Chart on Global - Market size and forecast 2023-2028 ($ million)
- Data Table on Global - Market size and forecast 2023-2028 ($ million)
- Chart on Global Market: Year-over-year growth 2023-2028 (%)
- Data Table on Global Market: Year-over-year growth 2023-2028 (%)
4 Historic Market Size
- 4.1 Global Industrial Rack And Pinion Market 2018 - 2022
- Historic Market Size - Data Table on Global Industrial Rack And Pinion Market 2018 - 2022 ($ million)
- 4.2 Product segment analysis 2018 - 2022
- Historic Market Size - Product Segment 2018 - 2022 ($ million)
- 4.3 Type segment analysis 2018 - 2022
- Historic Market Size - Type Segment 2018 - 2022 ($ million)
- 4.4 Geography segment analysis 2018 - 2022
- Historic Market Size - Geography Segment 2018 - 2022 ($ million)
- 4.5 Country segment analysis 2018 - 2022
- Historic Market Size - Country Segment 2018 - 2022 ($ million)
5 Five Forces Analysis
- 5.1 Five forces summary
- Five forces analysis - Comparison between 2023 and 2028
- 5.2 Bargaining power of buyers
- Bargaining power of buyers - Impact of key factors 2023 and 2028
- 5.3 Bargaining power of suppliers
- Bargaining power of suppliers - Impact of key factors in 2023 and 2028
- 5.4 Threat of new entrants
- Threat of new entrants - Impact of key factors in 2023 and 2028
- 5.5 Threat of substitutes
- Threat of substitutes - Impact of key factors in 2023 and 2028
- 5.6 Threat of rivalry
- Threat of rivalry - Impact of key factors in 2023 and 2028
- 5.7 Market condition
- Chart on Market condition - Five forces 2023 and 2028
6 Market Segmentation by Product
- 6.1 Market segments
- Chart on Product - Market share 2023-2028 (%)
- Data Table on Product - Market share 2023-2028 (%)
- 6.2 Comparison by Product
- Chart on Comparison by Product
- Data Table on Comparison by Product
- 6.3 Machine tools - Market size and forecast 2023-2028
- Chart on Machine tools - Market size and forecast 2023-2028 ($ million)
- Data Table on Machine tools - Market size and forecast 2023-2028 ($ million)
- Chart on Machine tools - Year-over-year growth 2023-2028 (%)
- Data Table on Machine tools - Year-over-year growth 2023-2028 (%)
- 6.4 Linear actuation and guideways - Market size and forecast 2023-2028
- Chart on Linear actuation and guideways - Market size and forecast 2023-2028 ($ million)
- Data Table on Linear actuation and guideways - Market size and forecast 2023-2028 ($ million)
- Chart on Linear actuation and guideways - Year-over-year growth 2023-2028 (%)
- Data Table on Linear actuation and guideways - Year-over-year growth 2023-2028 (%)
- 6.5 Material handling - Market size and forecast 2023-2028
- Chart on Material handling - Market size and forecast 2023-2028 ($ million)
- Data Table on Material handling - Market size and forecast 2023-2028 ($ million)
- Chart on Material handling - Year-over-year growth 2023-2028 (%)
- Data Table on Material handling - Year-over-year growth 2023-2028 (%)
- 6.6 Market opportunity by Product
- Market opportunity by Product ($ million)
- Data Table on Market opportunity by Product ($ million)
7 Market Segmentation by Type
- 7.1 Market segments
- Chart on Type - Market share 2023-2028 (%)
- Data Table on Type - Market share 2023-2028 (%)
- 7.2 Comparison by Type
- Chart on Comparison by Type
- Data Table on Comparison by Type
- 7.3 Alloy steel - Market size and forecast 2023-2028
- Chart on Alloy steel - Market size and forecast 2023-2028 ($ million)
- Data Table on Alloy steel - Market size and forecast 2023-2028 ($ million)
- Chart on Alloy steel - Year-over-year growth 2023-2028 (%)
- Data Table on Alloy steel - Year-over-year growth 2023-2028 (%)
- 7.4 Carbon steel - Market size and forecast 2023-2028
- Chart on Carbon steel - Market size and forecast 2023-2028 ($ million)
- Data Table on Carbon steel - Market size and forecast 2023-2028 ($ million)
- Chart on Carbon steel - Year-over-year growth 2023-2028 (%)
- Data Table on Carbon steel - Year-over-year growth 2023-2028 (%)
- 7.5 Stainless steel - Market size and forecast 2023-2028
- Chart on Stainless steel - Market size and forecast 2023-2028 ($ million)
- Data Table on Stainless steel - Market size and forecast 2023-2028 ($ million)
- Chart on Stainless steel - Year-over-year growth 2023-2028 (%)
- Data Table on Stainless steel - Year-over-year growth 2023-2028 (%)
- 7.6 Aluminum alloy - Market size and forecast 2023-2028
- Chart on Aluminum alloy - Market size and forecast 2023-2028 ($ million)
- Data Table on Aluminum alloy - Market size and forecast 2023-2028 ($ million)
- Chart on Aluminum alloy - Year-over-year growth 2023-2028 (%)
- Data Table on Aluminum alloy - Year-over-year growth 2023-2028 (%)
- 7.7 Plastic - Market size and forecast 2023-2028
- Chart on Plastic - Market size and forecast 2023-2028 ($ million)
- Data Table on Plastic - Market size and forecast 2023-2028 ($ million)
- Chart on Plastic - Year-over-year growth 2023-2028 (%)
- Data Table on Plastic - Year-over-year growth 2023-2028 (%)
- 7.8 Market opportunity by Type
- Market opportunity by Type ($ million)
- Data Table on Market opportunity by Type ($ million)
8 Customer Landscape
- 8.1 Customer landscape overview
- Analysis of price sensitivity, lifecycle, customer purchase basket, adoption rates, and purchase criteria
9 Geographic Landscape
- 9.1 Geographic segmentation
- Chart on Market share By Geographical Landscape 2023-2028 (%)
- Data Table on Market share By Geographical Landscape 2023-2028 (%)
- 9.2 Geographic comparison
- Chart on Geographic comparison
- Data Table on Geographic comparison
- 9.3 APAC - Market size and forecast 2023-2028
- Chart on APAC - Market size and forecast 2023-2028 ($ million)
- Data Table on APAC - Market size and forecast 2023-2028 ($ million)
- Chart on APAC - Year-over-year growth 2023-2028 (%)
- Data Table on APAC - Year-over-year growth 2023-2028 (%)
- 9.4 Europe - Market size and forecast 2023-2028
- Chart on Europe - Market size and forecast 2023-2028 ($ million)
- Data Table on Europe - Market size and forecast 2023-2028 ($ million)
- Chart on Europe - Year-over-year growth 2023-2028 (%)
- Data Table on Europe - Year-over-year growth 2023-2028 (%)
- 9.5 North America - Market size and forecast 2023-2028
- Chart on North America - Market size and forecast 2023-2028 ($ million)
- Data Table on North America - Market size and forecast 2023-2028 ($ million)
- Chart on North America - Year-over-year growth 2023-2028 (%)
- Data Table on North America - Year-over-year growth 2023-2028 (%)
- 9.6 Middle East and Africa - Market size and forecast 2023-2028
- Chart on Middle East and Africa - Market size and forecast 2023-2028 ($ million)
- Data Table on Middle East and Africa - Market size and forecast 2023-2028 ($ million)
- Chart on Middle East and Africa - Year-over-year growth 2023-2028 (%)
- Data Table on Middle East and Africa - Year-over-year growth 2023-2028 (%)
- 9.7 South America - Market size and forecast 2023-2028
- Chart on South America - Market size and forecast 2023-2028 ($ million)
- Data Table on South America - Market size and forecast 2023-2028 ($ million)
- Chart on South America - Year-over-year growth 2023-2028 (%)
- Data Table on South America - Year-over-year growth 2023-2028 (%)
- 9.8 China - Market size and forecast 2023-2028
- Chart on China - Market size and forecast 2023-2028 ($ million)
- Data Table on China - Market size and forecast 2023-2028 ($ million)
- Chart on China - Year-over-year growth 2023-2028 (%)
- Data Table on China - Year-over-year growth 2023-2028 (%)
- 9.9 US - Market size and forecast 2023-2028
- Chart on US - Market size and forecast 2023-2028 ($ million)
- Data Table on US - Market size and forecast 2023-2028 ($ million)
- Chart on US - Year-over-year growth 2023-2028 (%)
- Data Table on US - Year-over-year growth 2023-2028 (%)
- 9.10 Germany - Market size and forecast 2023-2028
- Chart on Germany - Market size and forecast 2023-2028 ($ million)
- Data Table on Germany - Market size and forecast 2023-2028 ($ million)
- Chart on Germany - Year-over-year growth 2023-2028 (%)
- Data Table on Germany - Year-over-year growth 2023-2028 (%)
- 9.11 India - Market size and forecast 2023-2028
- Chart on India - Market size and forecast 2023-2028 ($ million)
- Data Table on India - Market size and forecast 2023-2028 ($ million)
- Chart on India - Year-over-year growth 2023-2028 (%)
- Data Table on India - Year-over-year growth 2023-2028 (%)
- 9.12 Canada - Market size and forecast 2023-2028
- Chart on Canada - Market size and forecast 2023-2028 ($ million)
- Data Table on Canada - Market size and forecast 2023-2028 ($ million)
- Chart on Canada - Year-over-year growth 2023-2028 (%)
- Data Table on Canada - Year-over-year growth 2023-2028 (%)
- 9.13 Market opportunity By Geographical Landscape
- Market opportunity By Geographical Landscape ($ million)
- Data Tables on Market opportunity By Geographical Landscape ($ million)
10 Drivers, Challenges, and Opportunity/Restraints
- 10.1 Market drivers
- 10.2 Market challenges
- 10.3 Impact of drivers and challenges
- Impact of drivers and challenges in 2023 and 2028
- 10.4 Market opportunities/restraints
11 Competitive Landscape
- 11.1 Overview
- 11.2 Competitive Landscape
- Overview on criticality of inputs and factors of differentiation
- 11.3 Landscape disruption
- Overview on factors of disruption
- 11.4 Industry risks
- Impact of key risks on business
12 Competitive Analysis
- 12.1 Companies profiled
- Companies covered
- 12.2 Market positioning of companies
- Matrix on companies position and classification
- 12.3 Apex Dynamics Inc.
- Apex Dynamics Inc. - Overview
- Apex Dynamics Inc. - Product / Service
- Apex Dynamics Inc. - Key offerings
- 12.4 ATLANTA Antriebssysteme GmbH
- ATLANTA Antriebssysteme GmbH - Overview
- ATLANTA Antriebssysteme GmbH - Product / Service
- ATLANTA Antriebssysteme GmbH - Key offerings
- 12.5 B and B Manufacturing Inc.
- B and B Manufacturing Inc. - Overview
- B and B Manufacturing Inc. - Product / Service
- B and B Manufacturing Inc. - Key offerings
- 12.6 Commercial Gear and Sprocket Co. Inc.
- Commercial Gear and Sprocket Co. Inc. - Overview
- Commercial Gear and Sprocket Co. Inc. - Product / Service
- Commercial Gear and Sprocket Co. Inc. - Key offerings
- 12.7 GAM Enterprises Inc.
- GAM Enterprises Inc. - Overview
- GAM Enterprises Inc. - Product / Service
- GAM Enterprises Inc. - Key offerings
- 12.8 Gudel Group AG
- Gudel Group AG - Overview
- Gudel Group AG - Product / Service
- Gudel Group AG - Key offerings
- 12.9 HMK Automation Group Ltd.
- HMK Automation Group Ltd. - Overview
- HMK Automation Group Ltd. - Product / Service
- HMK Automation Group Ltd. - Key offerings
- 12.10 Kohara Gear Industry Co. Ltd.
- Kohara Gear Industry Co. Ltd. - Overview
- Kohara Gear Industry Co. Ltd. - Product / Service
- Kohara Gear Industry Co. Ltd. - Key offerings
- 12.11 Lomar Machine and Tool Co.
- Lomar Machine and Tool Co. - Overview
- Lomar Machine and Tool Co. - Product / Service
- Lomar Machine and Tool Co. - Key offerings
- 12.12 MIJNO PRECISION GEARING SAS
- MIJNO PRECISION GEARING SAS - Overview
- MIJNO PRECISION GEARING SAS - Product / Service
- MIJNO PRECISION GEARING SAS - Key offerings
- 12.13 Nexen Group Inc.
- Nexen Group Inc. - Overview
- Nexen Group Inc. - Product / Service
- Nexen Group Inc. - Key offerings
- 12.14 Nidec Corp.
- Nidec Corp. - Overview
- Nidec Corp. - Business segments
- Nidec Corp. - Key offerings
- Nidec Corp. - Segment focus
- 12.15 REDEX Group
- REDEX Group - Overview
- REDEX Group - Product / Service
- REDEX Group - Key offerings
- 12.16 Reliance Precision Ltd.
- Reliance Precision Ltd. - Overview
- Reliance Precision Ltd. - Product / Service
- Reliance Precision Ltd. - Key offerings
- 12.17 Sati SpA
- Sati SpA - Overview
- Sati SpA - Product / Service
- Sati SpA - Key offerings
13 Appendix
- 13.1 Scope of the report
- 13.2 Inclusions and exclusions checklist
- Inclusions checklist
- Exclusions checklist
- 13.3 Currency conversion rates for US$
- Currency conversion rates for US$
- 13.4 Research methodology
- Research methodology
- 13.5 Data procurement
- Information sources
- 13.6 Data validation
- Data validation
- 13.7 Validation techniques employed for market sizing
- Validation techniques employed for market sizing
- 13.8 Data synthesis
- Data synthesis
- 13.9 360 degree market analysis
- 360 degree market analysis
- 13.10 List of abbreviations
- List of abbreviations

