|
|
市場調査レポート
商品コード
1516134
光時間領域反射率計(OTDR)の世界市場 2024-2028Global optical time domain reflectometer (OTDR) market 2024-2028 |
||||||
|
|||||||
カスタマイズ可能
|
|||||||


| 光時間領域反射率計(OTDR)の世界市場 2024-2028 |
|
出版日: 2024年06月11日
発行: TechNavio
ページ情報: 英文 182 Pages
納期: 即納可能
|

全表示
- 概要
- 図表
- 目次
光時間領域反射率計(OTDR)市場は2023-2028年に7,540万米ドル、予測期間中のCAGRは5.22%で成長すると予測されます。
当レポートでは、光時間領域反射率計(OTDR)市場の全体的な分析、市場規模・予測、動向、成長促進要因、課題、約25のベンダーを網羅したベンダー分析などを掲載しています。
現在の市場シナリオ、最新動向と促進要因、市場環境全体に関する最新分析を提供しています。市場は、Tier2認証規格に対する需要の増加、スマートシティプロジェクトへの投資の拡大、ネットワークインフラの成長を促進するIoTアプリケーションによって牽引されています。
| 市場範囲 | |
|---|---|
| 基準年 | 2024 |
| 終了年 | 2028 |
| 予測期間 | 2024-2028 |
| 成長モメンタム | 加速 |
| 前年比2024年 | 4.88% |
| CAGR | 5.22% |
| 増分額 | 7,540万米ドル |
この調査では、ROFによる5Gネットワークの促進が、今後数年間の光時間領域反射率計(OTDR)市場成長を牽引する主要因の1つであると指摘しています。また、データセンタへの投資増加、波長分割多重(WDM)技術の需要拡大も市場の大きな需要につながります。
目次
第1章 エグゼクティブサマリー
- 市場概要
第2章 市場情勢
- 市場エコシステム
- 市場の特徴
- バリューチェーン分析
第3章 市場規模の評価
- 市場の定義
- 市場セグメント分析
- 市場規模 2023
- 市場の見通し 2023-2028
第4章 市場規模実績
- 世界光時間領域反射率計(OTDR)市場 2018-2022
- エンドユーザー別セグメント分析 2018-2022
- タイプ別セグメント分析 2018-2022
- 地域別セグメント分析 2018-2022
- 国別セグメント分析 2018-2022
第5章 ファイブフォース分析
- ファイブフォースの要約
- 買い手の交渉力
- 供給企業の交渉力
- 新規参入業者の脅威
- 代替品の脅威
- 競争の脅威
- 市況
第6章 市場セグメンテーション:エンドユーザー別
- 市場セグメンテーション
- 比較:エンドユーザー別
- 通信:市場規模と予測 2023-2028
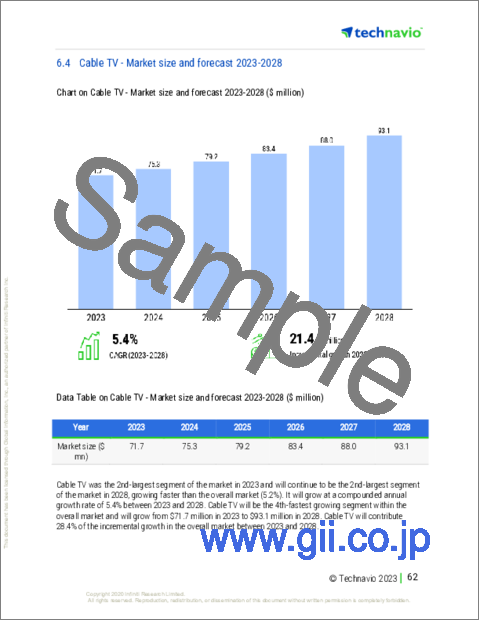
- ケーブルテレビ:市場規模と予測 2023-2028
- 民間企業ネットワーク:市場規模と予測 2023-2028
- 軍隊:市場規模と予測 2023-2028
- 航空宇宙:市場規模と予測 2023-2028
- 市場機会:エンドユーザー別
第7章 市場セグメンテーション:タイプ別
- 市場セグメンテーション
- 比較:タイプ別
- フル機能OTDR:市場規模と予測 2023-2028
- 携帯OTDR:市場規模と予測 2023-2028
- ファイバー・ブレイク・ロケーター:市場規模と予測 2023-2028
- 市場機会:タイプ別
第8章 顧客情勢
- 顧客情勢の概要
第9章 地域別情勢
- 地域別セグメンテーション
- 地域別比較
- 北米:市場規模と予測 2023-2028
- 欧州:市場規模と予測 2023-2028
- アジア太平洋:市場規模と予測 2023-2028
- 南米:市場規模と予測 2023-2028
- 中東・アフリカ:市場規模と予測 2023-2028
- 米国:市場規模と予測 2023-2028
- 中国:市場規模と予測 2023-2028
- 日本:市場規模と予測 2023-2028
- ドイツ:市場規模と予測 2023-2028
- インド:市場規模と予測 2023-2028
- 市場機会:地域情勢別
第10章 促進要因・課題・機会・抑制要因
- 市場促進要因
- 市場の課題
- 促進要因と課題の影響
- 市場の機会・抑制要因
第11章 競合情勢
- 概要
- 競合情勢
- 混乱の状況
- 業界のリスク
第12章 競合分析
- 企業プロファイル
- 企業の市場ポジショニング
- Anritsu Corp.
- Briticom
- Connectix Ltd.
- Corning Inc.
- EXFO Inc.
- Fibertronics Inc.
- Fortive Corp.
- Fujikura Co. Ltd.
- GAO Tek Inc.
- INNO Instrument Inc.
- Multicom Inc.
- Teledyne Technologies Inc.
- Texas Instruments Inc.
- Viavi Solutions Inc.
- Yokogawa Electric Corp.
第13章 付録
Exhibits:
- Exhibits1: Executive Summary - Chart on Market Overview
- Exhibits2: Executive Summary - Data Table on Market Overview
- Exhibits3: Executive Summary - Chart on Global Market Characteristics
- Exhibits4: Executive Summary - Chart on Market By Geographical Landscape
- Exhibits5: Executive Summary - Chart on Market Segmentation by End-user
- Exhibits6: Executive Summary - Chart on Market Segmentation by Type
- Exhibits7: Executive Summary - Chart on Incremental Growth
- Exhibits8: Executive Summary - Data Table on Incremental Growth
- Exhibits9: Executive Summary - Chart on Company Market Positioning
- Exhibits10: Parent Market
- Exhibits11: Data Table on - Parent Market
- Exhibits12: Market characteristics analysis
- Exhibits13: Value Chain Analysis
- Exhibits14: Offerings of companies included in the market definition
- Exhibits15: Market segments
- Exhibits16: Chart on Global - Market size and forecast 2023-2028 ($ million)
- Exhibits17: Data Table on Global - Market size and forecast 2023-2028 ($ million)
- Exhibits18: Chart on Global Market: Year-over-year growth 2023-2028 (%)
- Exhibits19: Data Table on Global Market: Year-over-year growth 2023-2028 (%)
- Exhibits20: Historic Market Size - Data Table on Global Optical Time Domain Reflectometer (OTDR) Market 2018 - 2022 ($ million)
- Exhibits21: Historic Market Size - End-user Segment 2018 - 2022 ($ million)
- Exhibits22: Historic Market Size - Type Segment 2018 - 2022 ($ million)
- Exhibits23: Historic Market Size - Geography Segment 2018 - 2022 ($ million)
- Exhibits24: Historic Market Size - Country Segment 2018 - 2022 ($ million)
- Exhibits25: Five forces analysis - Comparison between 2023 and 2028
- Exhibits26: Bargaining power of buyers - Impact of key factors 2023 and 2028
- Exhibits27: Bargaining power of suppliers - Impact of key factors in 2023 and 2028
- Exhibits28: Threat of new entrants - Impact of key factors in 2023 and 2028
- Exhibits29: Threat of substitutes - Impact of key factors in 2023 and 2028
- Exhibits30: Threat of rivalry - Impact of key factors in 2023 and 2028
- Exhibits31: Chart on Market condition - Five forces 2023 and 2028
- Exhibits32: Chart on End-user - Market share 2023-2028 (%)
- Exhibits33: Data Table on End-user - Market share 2023-2028 (%)
- Exhibits34: Chart on Comparison by End-user
- Exhibits35: Data Table on Comparison by End-user
- Exhibits36: Chart on Telecommunication - Market size and forecast 2023-2028 ($ million)
- Exhibits37: Data Table on Telecommunication - Market size and forecast 2023-2028 ($ million)
- Exhibits38: Chart on Telecommunication - Year-over-year growth 2023-2028 (%)
- Exhibits39: Data Table on Telecommunication - Year-over-year growth 2023-2028 (%)
- Exhibits40: Chart on Cable TV - Market size and forecast 2023-2028 ($ million)
- Exhibits41: Data Table on Cable TV - Market size and forecast 2023-2028 ($ million)
- Exhibits42: Chart on Cable TV - Year-over-year growth 2023-2028 (%)
- Exhibits43: Data Table on Cable TV - Year-over-year growth 2023-2028 (%)
- Exhibits44: Chart on Private enterprise network - Market size and forecast 2023-2028 ($ million)
- Exhibits45: Data Table on Private enterprise network - Market size and forecast 2023-2028 ($ million)
- Exhibits46: Chart on Private enterprise network - Year-over-year growth 2023-2028 (%)
- Exhibits47: Data Table on Private enterprise network - Year-over-year growth 2023-2028 (%)
- Exhibits48: Chart on Military - Market size and forecast 2023-2028 ($ million)
- Exhibits49: Data Table on Military - Market size and forecast 2023-2028 ($ million)
- Exhibits50: Chart on Military - Year-over-year growth 2023-2028 (%)
- Exhibits51: Data Table on Military - Year-over-year growth 2023-2028 (%)
- Exhibits52: Chart on Aerospace - Market size and forecast 2023-2028 ($ million)
- Exhibits53: Data Table on Aerospace - Market size and forecast 2023-2028 ($ million)
- Exhibits54: Chart on Aerospace - Year-over-year growth 2023-2028 (%)
- Exhibits55: Data Table on Aerospace - Year-over-year growth 2023-2028 (%)
- Exhibits56: Market opportunity by End-user ($ million)
- Exhibits57: Data Table on Market opportunity by End-user ($ million)
- Exhibits58: Chart on Type - Market share 2023-2028 (%)
- Exhibits59: Data Table on Type - Market share 2023-2028 (%)
- Exhibits60: Chart on Comparison by Type
- Exhibits61: Data Table on Comparison by Type
- Exhibits62: Chart on Full-feature OTDR - Market size and forecast 2023-2028 ($ million)
- Exhibits63: Data Table on Full-feature OTDR - Market size and forecast 2023-2028 ($ million)
- Exhibits64: Chart on Full-feature OTDR - Year-over-year growth 2023-2028 (%)
- Exhibits65: Data Table on Full-feature OTDR - Year-over-year growth 2023-2028 (%)
- Exhibits66: Chart on Hand-held OTDR - Market size and forecast 2023-2028 ($ million)
- Exhibits67: Data Table on Hand-held OTDR - Market size and forecast 2023-2028 ($ million)
- Exhibits68: Chart on Hand-held OTDR - Year-over-year growth 2023-2028 (%)
- Exhibits69: Data Table on Hand-held OTDR - Year-over-year growth 2023-2028 (%)
- Exhibits70: Chart on Fiber break locator - Market size and forecast 2023-2028 ($ million)
- Exhibits71: Data Table on Fiber break locator - Market size and forecast 2023-2028 ($ million)
- Exhibits72: Chart on Fiber break locator - Year-over-year growth 2023-2028 (%)
- Exhibits73: Data Table on Fiber break locator - Year-over-year growth 2023-2028 (%)
- Exhibits74: Market opportunity by Type ($ million)
- Exhibits75: Data Table on Market opportunity by Type ($ million)
- Exhibits76: Analysis of price sensitivity, lifecycle, customer purchase basket, adoption rates, and purchase criteria
- Exhibits77: Chart on Market share By Geographical Landscape 2023-2028 (%)
- Exhibits78: Data Table on Market share By Geographical Landscape 2023-2028 (%)
- Exhibits79: Chart on Geographic comparison
- Exhibits80: Data Table on Geographic comparison
- Exhibits81: Chart on North America - Market size and forecast 2023-2028 ($ million)
- Exhibits82: Data Table on North America - Market size and forecast 2023-2028 ($ million)
- Exhibits83: Chart on North America - Year-over-year growth 2023-2028 (%)
- Exhibits84: Data Table on North America - Year-over-year growth 2023-2028 (%)
- Exhibits85: Chart on Europe - Market size and forecast 2023-2028 ($ million)
- Exhibits86: Data Table on Europe - Market size and forecast 2023-2028 ($ million)
- Exhibits87: Chart on Europe - Year-over-year growth 2023-2028 (%)
- Exhibits88: Data Table on Europe - Year-over-year growth 2023-2028 (%)
- Exhibits89: Chart on APAC - Market size and forecast 2023-2028 ($ million)
- Exhibits90: Data Table on APAC - Market size and forecast 2023-2028 ($ million)
- Exhibits91: Chart on APAC - Year-over-year growth 2023-2028 (%)
- Exhibits92: Data Table on APAC - Year-over-year growth 2023-2028 (%)
- Exhibits93: Chart on South America - Market size and forecast 2023-2028 ($ million)
- Exhibits94: Data Table on South America - Market size and forecast 2023-2028 ($ million)
- Exhibits95: Chart on South America - Year-over-year growth 2023-2028 (%)
- Exhibits96: Data Table on South America - Year-over-year growth 2023-2028 (%)
- Exhibits97: Chart on Middle East and Africa - Market size and forecast 2023-2028 ($ million)
- Exhibits98: Data Table on Middle East and Africa - Market size and forecast 2023-2028 ($ million)
- Exhibits99: Chart on Middle East and Africa - Year-over-year growth 2023-2028 (%)
- Exhibits100: Data Table on Middle East and Africa - Year-over-year growth 2023-2028 (%)
- Exhibits101: Chart on US - Market size and forecast 2023-2028 ($ million)
- Exhibits102: Data Table on US - Market size and forecast 2023-2028 ($ million)
- Exhibits103: Chart on US - Year-over-year growth 2023-2028 (%)
- Exhibits104: Data Table on US - Year-over-year growth 2023-2028 (%)
- Exhibits105: Chart on China - Market size and forecast 2023-2028 ($ million)
- Exhibits106: Data Table on China - Market size and forecast 2023-2028 ($ million)
- Exhibits107: Chart on China - Year-over-year growth 2023-2028 (%)
- Exhibits108: Data Table on China - Year-over-year growth 2023-2028 (%)
- Exhibits109: Chart on Japan - Market size and forecast 2023-2028 ($ million)
- Exhibits110: Data Table on Japan - Market size and forecast 2023-2028 ($ million)
- Exhibits111: Chart on Japan - Year-over-year growth 2023-2028 (%)
- Exhibits112: Data Table on Japan - Year-over-year growth 2023-2028 (%)
- Exhibits113: Chart on Germany - Market size and forecast 2023-2028 ($ million)
- Exhibits114: Data Table on Germany - Market size and forecast 2023-2028 ($ million)
- Exhibits115: Chart on Germany - Year-over-year growth 2023-2028 (%)
- Exhibits116: Data Table on Germany - Year-over-year growth 2023-2028 (%)
- Exhibits117: Chart on India - Market size and forecast 2023-2028 ($ million)
- Exhibits118: Data Table on India - Market size and forecast 2023-2028 ($ million)
- Exhibits119: Chart on India - Year-over-year growth 2023-2028 (%)
- Exhibits120: Data Table on India - Year-over-year growth 2023-2028 (%)
- Exhibits121: Market opportunity By Geographical Landscape ($ million)
- Exhibits122: Data Tables on Market opportunity By Geographical Landscape ($ million)
- Exhibits123: Impact of drivers and challenges in 2023 and 2028
- Exhibits124: Overview on criticality of inputs and factors of differentiation
- Exhibits125: Overview on factors of disruption
- Exhibits126: Impact of key risks on business
- Exhibits127: Companies covered
- Exhibits128: Matrix on companies position and classification
- Exhibits129: Anritsu Corp. - Overview
- Exhibits130: Anritsu Corp. - Business segments
- Exhibits131: Anritsu Corp. - Key news
- Exhibits132: Anritsu Corp. - Key offerings
- Exhibits133: Anritsu Corp. - Segment focus
- Exhibits134: Briticom - Overview
- Exhibits135: Briticom - Product / Service
- Exhibits136: Briticom - Key offerings
- Exhibits137: Connectix Ltd. - Overview
- Exhibits138: Connectix Ltd. - Product / Service
- Exhibits139: Connectix Ltd. - Key offerings
- Exhibits140: Corning Inc. - Overview
- Exhibits141: Corning Inc. - Business segments
- Exhibits142: Corning Inc. - Key news
- Exhibits143: Corning Inc. - Key offerings
- Exhibits144: Corning Inc. - Segment focus
- Exhibits145: EXFO Inc. - Overview
- Exhibits146: EXFO Inc. - Product / Service
- Exhibits147: EXFO Inc. - Key offerings
- Exhibits148: Fibertronics Inc. - Overview
- Exhibits149: Fibertronics Inc. - Product / Service
- Exhibits150: Fibertronics Inc. - Key offerings
- Exhibits151: Fortive Corp. - Overview
- Exhibits152: Fortive Corp. - Business segments
- Exhibits153: Fortive Corp. - Key news
- Exhibits154: Fortive Corp. - Key offerings
- Exhibits155: Fortive Corp. - Segment focus
- Exhibits156: Fujikura Co. Ltd. - Overview
- Exhibits157: Fujikura Co. Ltd. - Business segments
- Exhibits158: Fujikura Co. Ltd. - Key news
- Exhibits159: Fujikura Co. Ltd. - Key offerings
- Exhibits160: Fujikura Co. Ltd. - Segment focus
- Exhibits161: GAO Tek Inc. - Overview
- Exhibits162: GAO Tek Inc. - Product / Service
- Exhibits163: GAO Tek Inc. - Key offerings
- Exhibits164: INNO Instrument Inc. - Overview
- Exhibits165: INNO Instrument Inc. - Product / Service
- Exhibits166: INNO Instrument Inc. - Key offerings
- Exhibits167: Multicom Inc. - Overview
- Exhibits168: Multicom Inc. - Product / Service
- Exhibits169: Multicom Inc. - Key offerings
- Exhibits170: Teledyne Technologies Inc. - Overview
- Exhibits171: Teledyne Technologies Inc. - Business segments
- Exhibits172: Teledyne Technologies Inc. - Key news
- Exhibits173: Teledyne Technologies Inc. - Key offerings
- Exhibits174: Teledyne Technologies Inc. - Segment focus
- Exhibits175: Texas Instruments Inc. - Overview
- Exhibits176: Texas Instruments Inc. - Business segments
- Exhibits177: Texas Instruments Inc. - Key news
- Exhibits178: Texas Instruments Inc. - Key offerings
- Exhibits179: Texas Instruments Inc. - Segment focus
- Exhibits180: Viavi Solutions Inc. - Overview
- Exhibits181: Viavi Solutions Inc. - Business segments
- Exhibits182: Viavi Solutions Inc. - Key offerings
- Exhibits183: Viavi Solutions Inc. - Segment focus
- Exhibits184: Yokogawa Electric Corp. - Overview
- Exhibits185: Yokogawa Electric Corp. - Business segments
- Exhibits186: Yokogawa Electric Corp. - Key news
- Exhibits187: Yokogawa Electric Corp. - Key offerings
- Exhibits188: Yokogawa Electric Corp. - Segment focus
- Exhibits189: Inclusions checklist
- Exhibits190: Exclusions checklist
- Exhibits191: Currency conversion rates for US$
- Exhibits192: Research methodology
- Exhibits193: Information sources
- Exhibits194: Data validation
- Exhibits195: Validation techniques employed for market sizing
- Exhibits196: Data synthesis
- Exhibits197: 360 degree market analysis
- Exhibits198: List of abbreviations
The optical time domain reflectometer (OTDR) market is forecasted to grow by USD 75.4 mn during 2023-2028, accelerating at a CAGR of 5.22% during the forecast period. The report on the optical time domain reflectometer (OTDR) market provides a holistic analysis, market size and forecast, trends, growth drivers, and challenges, as well as vendor analysis covering around 25 vendors.
The report offers an up-to-date analysis regarding the current market scenario, the latest trends and drivers, and the overall market environment. The market is driven by increasing demand for tier-2 certification standard, growing investments in smart city projects, and IoT applications driving growth of network infrastructure.
Technavio's optical time domain reflectometer (OTDR) market is segmented as below:
| Market Scope | |
|---|---|
| Base Year | 2024 |
| End Year | 2028 |
| Series Year | 2024-2028 |
| Growth Momentum | Accelerate |
| YOY 2024 | 4.88% |
| CAGR | 5.22% |
| Incremental Value | $75.4mn |
By End-user
- Telecommunication
- Cable TV
- Private enterprise network
- Military
- Aerospace
By Type
- Full-feature OTDR
- Hand-held OTDR
- Fiber break locator
By Geographical Landscape
- North America
- Europe
- APAC
- South America
- Middle East and Africa
This study identifies the facilitation of 5G network through ROF as one of the prime reasons driving the optical time domain reflectometer (OTDR) market growth during the next few years. Also, increasing investments in data centers and growing demand for wavelength division multiplexing (WDM) technologies will lead to sizable demand in the market.
The report on the optical time domain reflectometer (OTDR) market covers the following areas:
- Optical time domain reflectometer (OTDR) market sizing
- Optical time domain reflectometer (OTDR) market forecast
- Optical time domain reflectometer (OTDR) market industry analysis
The robust vendor analysis is designed to help clients improve their market position, and in line with this, this report provides a detailed analysis of several leading optical time domain reflectometer (OTDR) market vendors that include Aishwarya Technologies and Telecom Ltd., Anritsu Corp., Briticom, Circuit Globe, Connectix Ltd., Corning Inc., EXFO Inc., Fibertronics Inc., Fluke Corp., Fortive Corp., Fujikura Co. Ltd., GAO Tek Inc., INNO Instrument Inc., Multicom Inc., ShinewayTech, Teledyne Technologies Inc., Texas Instruments Inc., VeEX Inc., Viavi Solutions Inc., and Yokogawa Electric Corp. Also, the optical time domain reflectometer (OTDR) market analysis report includes information on upcoming trends and challenges that will influence market growth. This is to help companies strategize and leverage all forthcoming growth opportunities.
The study was conducted using an objective combination of primary and secondary information including inputs from key participants in the industry. The report contains a comprehensive market and vendor landscape in addition to an analysis of the key vendors.
The publisher presents a detailed picture of the market by the way of study, synthesis, and summation of data from multiple sources by an analysis of key parameters such as profit, pricing, competition, and promotions. It presents various market facets by identifying the key industry influencers. The data presented is comprehensive, reliable, and a result of extensive research - both primary and secondary. The market research reports provide a complete competitive landscape and an in-depth vendor selection methodology and analysis using qualitative and quantitative research to forecast the accurate market growth.
Table of Contents
1 Executive Summary
- 1.1 Market overview
- Executive Summary - Chart on Market Overview
- Executive Summary - Data Table on Market Overview
- Executive Summary - Chart on Global Market Characteristics
- Executive Summary - Chart on Market By Geographical Landscape
- Executive Summary - Chart on Market Segmentation by End-user
- Executive Summary - Chart on Market Segmentation by Type
- Executive Summary - Chart on Incremental Growth
- Executive Summary - Data Table on Incremental Growth
- Executive Summary - Chart on Company Market Positioning
2 Market Landscape
- 2.1 Market ecosystem
- Parent Market
- Data Table on - Parent Market
- 2.2 Market characteristics
- Market characteristics analysis
- 2.3 Value chain analysis
- Value Chain Analysis
3 Market Sizing
- 3.1 Market definition
- Offerings of companies included in the market definition
- 3.2 Market segment analysis
- Market segments
- 3.3 Market size 2023
- 3.4 Market outlook: Forecast for 2023-2028
- Chart on Global - Market size and forecast 2023-2028 ($ million)
- Data Table on Global - Market size and forecast 2023-2028 ($ million)
- Chart on Global Market: Year-over-year growth 2023-2028 (%)
- Data Table on Global Market: Year-over-year growth 2023-2028 (%)
4 Historic Market Size
- 4.1 Global Optical Time Domain Reflectometer (OTDR) Market 2018 - 2022
- Historic Market Size - Data Table on Global Optical Time Domain Reflectometer (OTDR) Market 2018 - 2022 ($ million)
- 4.2 End-user segment analysis 2018 - 2022
- Historic Market Size - End-user Segment 2018 - 2022 ($ million)
- 4.3 Type segment analysis 2018 - 2022
- Historic Market Size - Type Segment 2018 - 2022 ($ million)
- 4.4 Geography segment analysis 2018 - 2022
- Historic Market Size - Geography Segment 2018 - 2022 ($ million)
- 4.5 Country segment analysis 2018 - 2022
- Historic Market Size - Country Segment 2018 - 2022 ($ million)
5 Five Forces Analysis
- 5.1 Five forces summary
- Five forces analysis - Comparison between 2023 and 2028
- 5.2 Bargaining power of buyers
- Bargaining power of buyers - Impact of key factors 2023 and 2028
- 5.3 Bargaining power of suppliers
- Bargaining power of suppliers - Impact of key factors in 2023 and 2028
- 5.4 Threat of new entrants
- Threat of new entrants - Impact of key factors in 2023 and 2028
- 5.5 Threat of substitutes
- Threat of substitutes - Impact of key factors in 2023 and 2028
- 5.6 Threat of rivalry
- Threat of rivalry - Impact of key factors in 2023 and 2028
- 5.7 Market condition
- Chart on Market condition - Five forces 2023 and 2028
6 Market Segmentation by End-user
- 6.1 Market segments
- Chart on End-user - Market share 2023-2028 (%)
- Data Table on End-user - Market share 2023-2028 (%)
- 6.2 Comparison by End-user
- Chart on Comparison by End-user
- Data Table on Comparison by End-user
- 6.3 Telecommunication - Market size and forecast 2023-2028
- Chart on Telecommunication - Market size and forecast 2023-2028 ($ million)
- Data Table on Telecommunication - Market size and forecast 2023-2028 ($ million)
- Chart on Telecommunication - Year-over-year growth 2023-2028 (%)
- Data Table on Telecommunication - Year-over-year growth 2023-2028 (%)
- 6.4 Cable TV - Market size and forecast 2023-2028
- Chart on Cable TV - Market size and forecast 2023-2028 ($ million)
- Data Table on Cable TV - Market size and forecast 2023-2028 ($ million)
- Chart on Cable TV - Year-over-year growth 2023-2028 (%)
- Data Table on Cable TV - Year-over-year growth 2023-2028 (%)
- 6.5 Private enterprise network - Market size and forecast 2023-2028
- Chart on Private enterprise network - Market size and forecast 2023-2028 ($ million)
- Data Table on Private enterprise network - Market size and forecast 2023-2028 ($ million)
- Chart on Private enterprise network - Year-over-year growth 2023-2028 (%)
- Data Table on Private enterprise network - Year-over-year growth 2023-2028 (%)
- 6.6 Military - Market size and forecast 2023-2028
- Chart on Military - Market size and forecast 2023-2028 ($ million)
- Data Table on Military - Market size and forecast 2023-2028 ($ million)
- Chart on Military - Year-over-year growth 2023-2028 (%)
- Data Table on Military - Year-over-year growth 2023-2028 (%)
- 6.7 Aerospace - Market size and forecast 2023-2028
- Chart on Aerospace - Market size and forecast 2023-2028 ($ million)
- Data Table on Aerospace - Market size and forecast 2023-2028 ($ million)
- Chart on Aerospace - Year-over-year growth 2023-2028 (%)
- Data Table on Aerospace - Year-over-year growth 2023-2028 (%)
- 6.8 Market opportunity by End-user
- Market opportunity by End-user ($ million)
- Data Table on Market opportunity by End-user ($ million)
7 Market Segmentation by Type
- 7.1 Market segments
- Chart on Type - Market share 2023-2028 (%)
- Data Table on Type - Market share 2023-2028 (%)
- 7.2 Comparison by Type
- Chart on Comparison by Type
- Data Table on Comparison by Type
- 7.3 Full-feature OTDR - Market size and forecast 2023-2028
- Chart on Full-feature OTDR - Market size and forecast 2023-2028 ($ million)
- Data Table on Full-feature OTDR - Market size and forecast 2023-2028 ($ million)
- Chart on Full-feature OTDR - Year-over-year growth 2023-2028 (%)
- Data Table on Full-feature OTDR - Year-over-year growth 2023-2028 (%)
- 7.4 Hand-held OTDR - Market size and forecast 2023-2028
- Chart on Hand-held OTDR - Market size and forecast 2023-2028 ($ million)
- Data Table on Hand-held OTDR - Market size and forecast 2023-2028 ($ million)
- Chart on Hand-held OTDR - Year-over-year growth 2023-2028 (%)
- Data Table on Hand-held OTDR - Year-over-year growth 2023-2028 (%)
- 7.5 Fiber break locator - Market size and forecast 2023-2028
- Chart on Fiber break locator - Market size and forecast 2023-2028 ($ million)
- Data Table on Fiber break locator - Market size and forecast 2023-2028 ($ million)
- Chart on Fiber break locator - Year-over-year growth 2023-2028 (%)
- Data Table on Fiber break locator - Year-over-year growth 2023-2028 (%)
- 7.6 Market opportunity by Type
- Market opportunity by Type ($ million)
- Data Table on Market opportunity by Type ($ million)
8 Customer Landscape
- 8.1 Customer landscape overview
- Analysis of price sensitivity, lifecycle, customer purchase basket, adoption rates, and purchase criteria
9 Geographic Landscape
- 9.1 Geographic segmentation
- Chart on Market share By Geographical Landscape 2023-2028 (%)
- Data Table on Market share By Geographical Landscape 2023-2028 (%)
- 9.2 Geographic comparison
- Chart on Geographic comparison
- Data Table on Geographic comparison
- 9.3 North America - Market size and forecast 2023-2028
- Chart on North America - Market size and forecast 2023-2028 ($ million)
- Data Table on North America - Market size and forecast 2023-2028 ($ million)
- Chart on North America - Year-over-year growth 2023-2028 (%)
- Data Table on North America - Year-over-year growth 2023-2028 (%)
- 9.4 Europe - Market size and forecast 2023-2028
- Chart on Europe - Market size and forecast 2023-2028 ($ million)
- Data Table on Europe - Market size and forecast 2023-2028 ($ million)
- Chart on Europe - Year-over-year growth 2023-2028 (%)
- Data Table on Europe - Year-over-year growth 2023-2028 (%)
- 9.5 APAC - Market size and forecast 2023-2028
- Chart on APAC - Market size and forecast 2023-2028 ($ million)
- Data Table on APAC - Market size and forecast 2023-2028 ($ million)
- Chart on APAC - Year-over-year growth 2023-2028 (%)
- Data Table on APAC - Year-over-year growth 2023-2028 (%)
- 9.6 South America - Market size and forecast 2023-2028
- Chart on South America - Market size and forecast 2023-2028 ($ million)
- Data Table on South America - Market size and forecast 2023-2028 ($ million)
- Chart on South America - Year-over-year growth 2023-2028 (%)
- Data Table on South America - Year-over-year growth 2023-2028 (%)
- 9.7 Middle East and Africa - Market size and forecast 2023-2028
- Chart on Middle East and Africa - Market size and forecast 2023-2028 ($ million)
- Data Table on Middle East and Africa - Market size and forecast 2023-2028 ($ million)
- Chart on Middle East and Africa - Year-over-year growth 2023-2028 (%)
- Data Table on Middle East and Africa - Year-over-year growth 2023-2028 (%)
- 9.8 US - Market size and forecast 2023-2028
- Chart on US - Market size and forecast 2023-2028 ($ million)
- Data Table on US - Market size and forecast 2023-2028 ($ million)
- Chart on US - Year-over-year growth 2023-2028 (%)
- Data Table on US - Year-over-year growth 2023-2028 (%)
- 9.9 China - Market size and forecast 2023-2028
- Chart on China - Market size and forecast 2023-2028 ($ million)
- Data Table on China - Market size and forecast 2023-2028 ($ million)
- Chart on China - Year-over-year growth 2023-2028 (%)
- Data Table on China - Year-over-year growth 2023-2028 (%)
- 9.10 Japan - Market size and forecast 2023-2028
- Chart on Japan - Market size and forecast 2023-2028 ($ million)
- Data Table on Japan - Market size and forecast 2023-2028 ($ million)
- Chart on Japan - Year-over-year growth 2023-2028 (%)
- Data Table on Japan - Year-over-year growth 2023-2028 (%)
- 9.11 Germany - Market size and forecast 2023-2028
- Chart on Germany - Market size and forecast 2023-2028 ($ million)
- Data Table on Germany - Market size and forecast 2023-2028 ($ million)
- Chart on Germany - Year-over-year growth 2023-2028 (%)
- Data Table on Germany - Year-over-year growth 2023-2028 (%)
- 9.12 India - Market size and forecast 2023-2028
- Chart on India - Market size and forecast 2023-2028 ($ million)
- Data Table on India - Market size and forecast 2023-2028 ($ million)
- Chart on India - Year-over-year growth 2023-2028 (%)
- Data Table on India - Year-over-year growth 2023-2028 (%)
- 9.13 Market opportunity By Geographical Landscape
- Market opportunity By Geographical Landscape ($ million)
- Data Tables on Market opportunity By Geographical Landscape ($ million)
10 Drivers, Challenges, and Opportunity/Restraints
- 10.1 Market drivers
- 10.2 Market challenges
- 10.3 Impact of drivers and challenges
- Impact of drivers and challenges in 2023 and 2028
- 10.4 Market opportunities/restraints
11 Competitive Landscape
- 11.1 Overview
- 11.2 Competitive Landscape
- Overview on criticality of inputs and factors of differentiation
- 11.3 Landscape disruption
- Overview on factors of disruption
- 11.4 Industry risks
- Impact of key risks on business
12 Competitive Analysis
- 12.1 Companies profiled
- Companies covered
- 12.2 Market positioning of companies
- Matrix on companies position and classification
- 12.3 Anritsu Corp.
- Anritsu Corp. - Overview
- Anritsu Corp. - Business segments
- Anritsu Corp. - Key news
- Anritsu Corp. - Key offerings
- Anritsu Corp. - Segment focus
- 12.4 Briticom
- Briticom - Overview
- Briticom - Product / Service
- Briticom - Key offerings
- 12.5 Connectix Ltd.
- Connectix Ltd. - Overview
- Connectix Ltd. - Product / Service
- Connectix Ltd. - Key offerings
- 12.6 Corning Inc.
- Corning Inc. - Overview
- Corning Inc. - Business segments
- Corning Inc. - Key news
- Corning Inc. - Key offerings
- Corning Inc. - Segment focus
- 12.7 EXFO Inc.
- EXFO Inc. - Overview
- EXFO Inc. - Product / Service
- EXFO Inc. - Key offerings
- 12.8 Fibertronics Inc.
- Fibertronics Inc. - Overview
- Fibertronics Inc. - Product / Service
- Fibertronics Inc. - Key offerings
- 12.9 Fortive Corp.
- Fortive Corp. - Overview
- Fortive Corp. - Business segments
- Fortive Corp. - Key news
- Fortive Corp. - Key offerings
- Fortive Corp. - Segment focus
- 12.10 Fujikura Co. Ltd.
- Fujikura Co. Ltd. - Overview
- Fujikura Co. Ltd. - Business segments
- Fujikura Co. Ltd. - Key news
- Fujikura Co. Ltd. - Key offerings
- Fujikura Co. Ltd. - Segment focus
- 12.11 GAO Tek Inc.
- GAO Tek Inc. - Overview
- GAO Tek Inc. - Product / Service
- GAO Tek Inc. - Key offerings
- 12.12 INNO Instrument Inc.
- INNO Instrument Inc. - Overview
- INNO Instrument Inc. - Product / Service
- INNO Instrument Inc. - Key offerings
- 12.13 Multicom Inc.
- Multicom Inc. - Overview
- Multicom Inc. - Product / Service
- Multicom Inc. - Key offerings
- 12.14 Teledyne Technologies Inc.
- Teledyne Technologies Inc. - Overview
- Teledyne Technologies Inc. - Business segments
- Teledyne Technologies Inc. - Key news
- Teledyne Technologies Inc. - Key offerings
- Teledyne Technologies Inc. - Segment focus
- 12.15 Texas Instruments Inc.
- Texas Instruments Inc. - Overview
- Texas Instruments Inc. - Business segments
- Texas Instruments Inc. - Key news
- Texas Instruments Inc. - Key offerings
- Texas Instruments Inc. - Segment focus
- 12.16 Viavi Solutions Inc.
- Viavi Solutions Inc. - Overview
- Viavi Solutions Inc. - Business segments
- Viavi Solutions Inc. - Key offerings
- Viavi Solutions Inc. - Segment focus
- 12.17 Yokogawa Electric Corp.
- Yokogawa Electric Corp. - Overview
- Yokogawa Electric Corp. - Business segments
- Yokogawa Electric Corp. - Key news
- Yokogawa Electric Corp. - Key offerings
- Yokogawa Electric Corp. - Segment focus
13 Appendix
- 13.1 Scope of the report
- 13.2 Inclusions and exclusions checklist
- Inclusions checklist
- Exclusions checklist
- 13.3 Currency conversion rates for US$
- Currency conversion rates for US$
- 13.4 Research methodology
- Research methodology
- 13.5 Data procurement
- Information sources
- 13.6 Data validation
- Data validation
- 13.7 Validation techniques employed for market sizing
- Validation techniques employed for market sizing
- 13.8 Data synthesis
- Data synthesis
- 13.9 360 degree market analysis
- 360 degree market analysis
- 13.10 List of abbreviations
- List of abbreviations

