|
|
市場調査レポート
商品コード
1502511
高炉の世界市場 2024-2028Global blast furnaces market 2024-2028 |
||||||

|
|||||||
カスタマイズ可能
|
|||||||


| 高炉の世界市場 2024-2028 |
|
出版日: 2024年05月17日
発行: TechNavio
ページ情報: 英文 169 Pages
納期: 即納可能
|

全表示
- 概要
- 図表
- 目次
Technavio社は、高炉市場をモニターしており、2023年から2028年にかけて25億1,780万米ドル、予測期間中のCAGRは5.95%で成長すると予測しています。
当レポートでは、高炉市場の全体的な分析、市場規模・予測、動向、成長促進要因、課題、約25のベンダーを網羅したベンダー分析などを掲載しています。
現在の市場シナリオ、最新動向と促進要因、市場環境全体に関する最新分析を提供しています。市場は、高炉の大規模な設置ベース、インドとロシアからの鉄鋼需要の増加、鉄鋼工場に環境フットプリントの削減を求める規制によって牽引されています。
| 市場範囲 | |
|---|---|
| 基準年 | 2024 |
| 終了年 | 2028 |
| 予測期間 | 2024-2028 |
| 成長モメンタム | 加速 |
| 前年比2024年 | 5.53% |
| CAGR | 5.95% |
| 増分額 | 25億1,780万米ドル |
本調査では、今後数年間の高炉市場成長を牽引する主要因の1つとして、サービスとしての設備を挙げています。また、中国の鉄鋼産業が沿岸部へシフトしつつあり、個人所有が増加していることも、市場の大きな需要につながります。
目次
第1章 エグゼクティブサマリー
- 市場概要
第2章 市場情勢
- 市場エコシステム
- 市場の特徴
- バリューチェーン分析
第3章 市場規模の評価
- 市場の定義
- 市場セグメント分析
- 市場規模 2023
- 市場の見通し 2023-2028
第4章 市場規模実績
- 世界高炉市場 2018-2022
- 用途別セグメント分析 2018-2022
- タイプ別セグメント分析 2018-2022
- 地域別セグメント分析 2018-2022
- 国別セグメント分析 2018-2022
第5章 ファイブフォース分析
- ファイブフォースの要約
- 買い手の交渉力
- 供給企業の交渉力
- 新規参入業者の脅威
- 代替品の脅威
- 競争の脅威
- 市況
第6章 市場セグメンテーション:用途別
- 市場セグメンテーション
- 比較:用途別
- 改修プロジェクト:市場規模と予測 2023-2028
- 容量の追加:市場規模と予測 2023-2028
- 市場機会:用途別
第7章 市場セグメンテーション:タイプ別
- 市場セグメンテーション
- 比較:タイプ別
- 熱風炉:市場規模と予測 2023-2028
- 冷風送風機:市場規模と予測 2023-2028
- 市場機会:タイプ別
第8章 顧客情勢
- 顧客情勢の概要
第9章 地域別情勢
- 地域別セグメンテーション
- 地域別比較
- アジア太平洋:市場規模と予測 2023-2028
- 欧州:市場規模と予測 2023-2028
- 北米:市場規模と予測 2023-2028
- 中東・アフリカ:市場規模と予測 2023-2028
- 南米:市場規模と予測 2023-2028
- 中国:市場規模と予測 2023-2028
- インド:市場規模と予測 2023-2028
- 米国:市場規模と予測 2023-2028
- ロシア:市場規模と予測 2023-2028
- 日本:市場規模と予測 2023-2028
- 市場機会:地域情勢別
第10章 促進要因・課題・機会・抑制要因
- 市場促進要因
- 市場の課題
- 促進要因と課題の影響
- 市場の機会・抑制要因
第11章 競合情勢
- 概要
- 競合情勢
- 混乱の状況
- 業界のリスク
第12章 競合分析
- 企業プロファイル
- 企業の市場ポジショニング
- China Metallurgical Engineering and Project Corp.
- Compagnie de Saint Gobain
- Danieli and C. Officine Meccaniche Spa
- Gillanders Arbuthnot and Co. Ltd.
- IHI Corp.
- JP Steel Plantech Co.
- Larsen and Toubro Ltd.
- McNally Bharat Engineering Co. Ltd.
- MECON Ltd.
- Nippon Steel Corp.
- Noble Industrial Furnace Co. Inc.
- POSCO holdings Inc.
- Primetals Technologies Ltd.
- Shandong Province Metallurgical Engineering Co. Ltd.
- SMS group GmbH
第13章 付録
Exhibits:
- Exhibits1: Executive Summary - Chart on Market Overview
- Exhibits2: Executive Summary - Data Table on Market Overview
- Exhibits3: Executive Summary - Chart on Global Market Characteristics
- Exhibits4: Executive Summary - Chart on Market By Geographical Landscape
- Exhibits5: Executive Summary - Chart on Market Segmentation by Application
- Exhibits6: Executive Summary - Chart on Market Segmentation by Type
- Exhibits7: Executive Summary - Chart on Incremental Growth
- Exhibits8: Executive Summary - Data Table on Incremental Growth
- Exhibits9: Executive Summary - Chart on Company Market Positioning
- Exhibits10: Parent Market
- Exhibits11: Data Table on - Parent Market
- Exhibits12: Market characteristics analysis
- Exhibits13: Value Chain Analysis
- Exhibits14: Offerings of companies included in the market definition
- Exhibits15: Market segments
- Exhibits16: Chart on Global - Market size and forecast 2023-2028 ($ million)
- Exhibits17: Data Table on Global - Market size and forecast 2023-2028 ($ million)
- Exhibits18: Chart on Global Market: Year-over-year growth 2023-2028 (%)
- Exhibits19: Data Table on Global Market: Year-over-year growth 2023-2028 (%)
- Exhibits20: Historic Market Size - Data Table on Global Blast Furnaces Market 2018 - 2022 ($ million)
- Exhibits21: Historic Market Size - Application Segment 2018 - 2022 ($ million)
- Exhibits22: Historic Market Size - Type Segment 2018 - 2022 ($ million)
- Exhibits23: Historic Market Size - Geography Segment 2018 - 2022 ($ million)
- Exhibits24: Historic Market Size - Country Segment 2018 - 2022 ($ million)
- Exhibits25: Five forces analysis - Comparison between 2023 and 2028
- Exhibits26: Bargaining power of buyers - Impact of key factors 2023 and 2028
- Exhibits27: Bargaining power of suppliers - Impact of key factors in 2023 and 2028
- Exhibits28: Threat of new entrants - Impact of key factors in 2023 and 2028
- Exhibits29: Threat of substitutes - Impact of key factors in 2023 and 2028
- Exhibits30: Threat of rivalry - Impact of key factors in 2023 and 2028
- Exhibits31: Chart on Market condition - Five forces 2023 and 2028
- Exhibits32: Chart on Application - Market share 2023-2028 (%)
- Exhibits33: Data Table on Application - Market share 2023-2028 (%)
- Exhibits34: Chart on Comparison by Application
- Exhibits35: Data Table on Comparison by Application
- Exhibits36: Chart on Revamping projects - Market size and forecast 2023-2028 ($ million)
- Exhibits37: Data Table on Revamping projects - Market size and forecast 2023-2028 ($ million)
- Exhibits38: Chart on Revamping projects - Year-over-year growth 2023-2028 (%)
- Exhibits39: Data Table on Revamping projects - Year-over-year growth 2023-2028 (%)
- Exhibits40: Chart on Capacity additions - Market size and forecast 2023-2028 ($ million)
- Exhibits41: Data Table on Capacity additions - Market size and forecast 2023-2028 ($ million)
- Exhibits42: Chart on Capacity additions - Year-over-year growth 2023-2028 (%)
- Exhibits43: Data Table on Capacity additions - Year-over-year growth 2023-2028 (%)
- Exhibits44: Market opportunity by Application ($ million)
- Exhibits45: Data Table on Market opportunity by Application ($ million)
- Exhibits46: Chart on Type - Market share 2023-2028 (%)
- Exhibits47: Data Table on Type - Market share 2023-2028 (%)
- Exhibits48: Chart on Comparison by Type
- Exhibits49: Data Table on Comparison by Type
- Exhibits50: Chart on Hot blast ovens - Market size and forecast 2023-2028 ($ million)
- Exhibits51: Data Table on Hot blast ovens - Market size and forecast 2023-2028 ($ million)
- Exhibits52: Chart on Hot blast ovens - Year-over-year growth 2023-2028 (%)
- Exhibits53: Data Table on Hot blast ovens - Year-over-year growth 2023-2028 (%)
- Exhibits54: Chart on Cold blast blowers - Market size and forecast 2023-2028 ($ million)
- Exhibits55: Data Table on Cold blast blowers - Market size and forecast 2023-2028 ($ million)
- Exhibits56: Chart on Cold blast blowers - Year-over-year growth 2023-2028 (%)
- Exhibits57: Data Table on Cold blast blowers - Year-over-year growth 2023-2028 (%)
- Exhibits58: Market opportunity by Type ($ million)
- Exhibits59: Data Table on Market opportunity by Type ($ million)
- Exhibits60: Analysis of price sensitivity, lifecycle, customer purchase basket, adoption rates, and purchase criteria
- Exhibits61: Chart on Market share By Geographical Landscape 2023-2028 (%)
- Exhibits62: Data Table on Market share By Geographical Landscape 2023-2028 (%)
- Exhibits63: Chart on Geographic comparison
- Exhibits64: Data Table on Geographic comparison
- Exhibits65: Chart on APAC - Market size and forecast 2023-2028 ($ million)
- Exhibits66: Data Table on APAC - Market size and forecast 2023-2028 ($ million)
- Exhibits67: Chart on APAC - Year-over-year growth 2023-2028 (%)
- Exhibits68: Data Table on APAC - Year-over-year growth 2023-2028 (%)
- Exhibits69: Chart on Europe - Market size and forecast 2023-2028 ($ million)
- Exhibits70: Data Table on Europe - Market size and forecast 2023-2028 ($ million)
- Exhibits71: Chart on Europe - Year-over-year growth 2023-2028 (%)
- Exhibits72: Data Table on Europe - Year-over-year growth 2023-2028 (%)
- Exhibits73: Chart on North America - Market size and forecast 2023-2028 ($ million)
- Exhibits74: Data Table on North America - Market size and forecast 2023-2028 ($ million)
- Exhibits75: Chart on North America - Year-over-year growth 2023-2028 (%)
- Exhibits76: Data Table on North America - Year-over-year growth 2023-2028 (%)
- Exhibits77: Chart on Middle East and Africa - Market size and forecast 2023-2028 ($ million)
- Exhibits78: Data Table on Middle East and Africa - Market size and forecast 2023-2028 ($ million)
- Exhibits79: Chart on Middle East and Africa - Year-over-year growth 2023-2028 (%)
- Exhibits80: Data Table on Middle East and Africa - Year-over-year growth 2023-2028 (%)
- Exhibits81: Chart on South America - Market size and forecast 2023-2028 ($ million)
- Exhibits82: Data Table on South America - Market size and forecast 2023-2028 ($ million)
- Exhibits83: Chart on South America - Year-over-year growth 2023-2028 (%)
- Exhibits84: Data Table on South America - Year-over-year growth 2023-2028 (%)
- Exhibits85: Chart on China - Market size and forecast 2023-2028 ($ million)
- Exhibits86: Data Table on China - Market size and forecast 2023-2028 ($ million)
- Exhibits87: Chart on China - Year-over-year growth 2023-2028 (%)
- Exhibits88: Data Table on China - Year-over-year growth 2023-2028 (%)
- Exhibits89: Chart on India - Market size and forecast 2023-2028 ($ million)
- Exhibits90: Data Table on India - Market size and forecast 2023-2028 ($ million)
- Exhibits91: Chart on India - Year-over-year growth 2023-2028 (%)
- Exhibits92: Data Table on India - Year-over-year growth 2023-2028 (%)
- Exhibits93: Chart on US - Market size and forecast 2023-2028 ($ million)
- Exhibits94: Data Table on US - Market size and forecast 2023-2028 ($ million)
- Exhibits95: Chart on US - Year-over-year growth 2023-2028 (%)
- Exhibits96: Data Table on US - Year-over-year growth 2023-2028 (%)
- Exhibits97: Chart on Russia - Market size and forecast 2023-2028 ($ million)
- Exhibits98: Data Table on Russia - Market size and forecast 2023-2028 ($ million)
- Exhibits99: Chart on Russia - Year-over-year growth 2023-2028 (%)
- Exhibits100: Data Table on Russia - Year-over-year growth 2023-2028 (%)
- Exhibits101: Chart on Japan - Market size and forecast 2023-2028 ($ million)
- Exhibits102: Data Table on Japan - Market size and forecast 2023-2028 ($ million)
- Exhibits103: Chart on Japan - Year-over-year growth 2023-2028 (%)
- Exhibits104: Data Table on Japan - Year-over-year growth 2023-2028 (%)
- Exhibits105: Market opportunity By Geographical Landscape ($ million)
- Exhibits106: Data Tables on Market opportunity By Geographical Landscape ($ million)
- Exhibits107: Impact of drivers and challenges in 2023 and 2028
- Exhibits108: Overview on criticality of inputs and factors of differentiation
- Exhibits109: Overview on factors of disruption
- Exhibits110: Impact of key risks on business
- Exhibits111: Companies covered
- Exhibits112: Matrix on companies position and classification
- Exhibits113: China Metallurgical Engineering and Project Corp. - Overview
- Exhibits114: China Metallurgical Engineering and Project Corp. - Product / Service
- Exhibits115: China Metallurgical Engineering and Project Corp. - Key offerings
- Exhibits116: Compagnie de Saint Gobain - Overview
- Exhibits117: Compagnie de Saint Gobain - Business segments
- Exhibits118: Compagnie de Saint Gobain - Key news
- Exhibits119: Compagnie de Saint Gobain - Key offerings
- Exhibits120: Compagnie de Saint Gobain - Segment focus
- Exhibits121: Danieli and C. Officine Meccaniche Spa - Overview
- Exhibits122: Danieli and C. Officine Meccaniche Spa - Business segments
- Exhibits123: Danieli and C. Officine Meccaniche Spa - Key offerings
- Exhibits124: Danieli and C. Officine Meccaniche Spa - Segment focus
- Exhibits125: Gillanders Arbuthnot and Co. Ltd. - Overview
- Exhibits126: Gillanders Arbuthnot and Co. Ltd. - Business segments
- Exhibits127: Gillanders Arbuthnot and Co. Ltd. - Key offerings
- Exhibits128: Gillanders Arbuthnot and Co. Ltd. - Segment focus
- Exhibits129: IHI Corp. - Overview
- Exhibits130: IHI Corp. - Business segments
- Exhibits131: IHI Corp. - Key offerings
- Exhibits132: IHI Corp. - Segment focus
- Exhibits133: JP Steel Plantech Co. - Overview
- Exhibits134: JP Steel Plantech Co. - Product / Service
- Exhibits135: JP Steel Plantech Co. - Key offerings
- Exhibits136: Larsen and Toubro Ltd. - Overview
- Exhibits137: Larsen and Toubro Ltd. - Business segments
- Exhibits138: Larsen and Toubro Ltd. - Key news
- Exhibits139: Larsen and Toubro Ltd. - Key offerings
- Exhibits140: Larsen and Toubro Ltd. - Segment focus
- Exhibits141: McNally Bharat Engineering Co. Ltd. - Overview
- Exhibits142: McNally Bharat Engineering Co. Ltd. - Product / Service
- Exhibits143: McNally Bharat Engineering Co. Ltd. - Key offerings
- Exhibits144: MECON Ltd. - Overview
- Exhibits145: MECON Ltd. - Business segments
- Exhibits146: MECON Ltd. - Key offerings
- Exhibits147: MECON Ltd. - Segment focus
- Exhibits148: Nippon Steel Corp. - Overview
- Exhibits149: Nippon Steel Corp. - Business segments
- Exhibits150: Nippon Steel Corp. - Key offerings
- Exhibits151: Nippon Steel Corp. - Segment focus
- Exhibits152: Noble Industrial Furnace Co. Inc. - Overview
- Exhibits153: Noble Industrial Furnace Co. Inc. - Product / Service
- Exhibits154: Noble Industrial Furnace Co. Inc. - Key offerings
- Exhibits155: POSCO holdings Inc. - Overview
- Exhibits156: POSCO holdings Inc. - Product / Service
- Exhibits157: POSCO holdings Inc. - Key offerings
- Exhibits158: Primetals Technologies Ltd. - Overview
- Exhibits159: Primetals Technologies Ltd. - Product / Service
- Exhibits160: Primetals Technologies Ltd. - Key offerings
- Exhibits161: Shandong Province Metallurgical Engineering Co. Ltd. - Overview
- Exhibits162: Shandong Province Metallurgical Engineering Co. Ltd. - Product / Service
- Exhibits163: Shandong Province Metallurgical Engineering Co. Ltd. - Key offerings
- Exhibits164: SMS group GmbH - Overview
- Exhibits165: SMS group GmbH - Product / Service
- Exhibits166: SMS group GmbH - Key offerings
- Exhibits167: Inclusions checklist
- Exhibits168: Exclusions checklist
- Exhibits169: Currency conversion rates for US$
- Exhibits170: Research methodology
- Exhibits171: Information sources
- Exhibits172: Data validation
- Exhibits173: Validation techniques employed for market sizing
- Exhibits174: Data synthesis
- Exhibits175: 360 degree market analysis
- Exhibits176: List of abbreviations
Technavio has been monitoring the blast furnaces market and is forecast to grow by $ 2517.8 mn during 2023-2028, accelerating at a CAGR of 5.95% during the forecast period. Our report on the blast furnaces market provides a holistic analysis, market size and forecast, trends, growth drivers, and challenges, as well as vendor analysis covering around 25 vendors.
The report offers an up-to-date analysis regarding the current market scenario, the latest trends and drivers, and the overall market environment. The market is driven by large installed base of blast furnaces, growing steel demand from india and russia, and regulations requiring steel plants to reduce the environmental footprint.
Technavio's blast furnaces market is segmented as below:
| Market Scope | |
|---|---|
| Base Year | 2024 |
| End Year | 2028 |
| Series Year | 2024-2028 |
| Growth Momentum | Accelerate |
| YOY 2024 | 5.53% |
| CAGR | 5.95% |
| Incremental Value | $2517.8mn |
By Application
- Revamping projects
- Capacity additions
By Type
- Hot blast ovens
- Cold blast blowers
By Geographical Landscape
- APAC
- Europe
- North America
- Middle East and Africa
- South America
This study identifies the equipment as a service as one of the prime reasons driving the blast furnaces market growth during the next few years. Also, the ongoing shift of the chinese steel industry toward coastal areas and increasing private ownership will lead to sizable demand in the market.
Technavio presents a detailed picture of the market by the way of study, synthesis, and summation of data from multiple sources by an analysis of key parameters. Our report on the blast furnaces market covers the following areas:
- Blast furnaces market sizing
- Blast furnaces market forecast
- Blast furnaces market industry analysis
Technavio's robust vendor analysis is designed to help clients improve their market position, and in line with this, this report provides a detailed analysis of several leading blast furnaces market vendors that include Ansteel Group Corp. Ltd., China Metallurgical Engineering and Project Corp., Compagnie de Saint Gobain, Danieli and C. Officine Meccaniche Spa, Gillanders Arbuthnot and Co. Ltd., Heavy Engineering Corp. Ltd., IHI Corp., JP Steel Plantech Co., Krosaki Harima Corp., Larsen and Toubro Ltd., McNally Bharat Engineering Co. Ltd., MECON Ltd., Nippon Steel Corp., Noble Industrial Furnace Co. Inc., POSCO holdings Inc., Primetals Technologies Ltd., Qinhuangdao Qinye Heavy Industry Co. Ltd., Shandong Province Metallurgical Engineering Co. Ltd., Sinosteel Corp., and SMS group GmbH. Also, the blast furnaces market analysis report includes information on upcoming trends and challenges that will influence market growth. This is to help companies strategize and leverage all forthcoming growth opportunities.
The study was conducted using an objective combination of primary and secondary information including inputs from key participants in the industry. The report contains a comprehensive market and vendor landscape in addition to an analysis of the key vendors.
Technavio presents a detailed picture of the market by the way of study, synthesis, and summation of data from multiple sources by an analysis of key parameters such as profit, pricing, competition, and promotions. It presents various market facets by identifying the key industry influencers. The data presented is comprehensive, reliable, and a result of extensive research - both primary and secondary. Technavio's market research reports provide a complete competitive landscape and an in-depth vendor selection methodology and analysis using qualitative and quantitative research to forecast accurate market growth.
Table of Contents
1 Executive Summary
- 1.1 Market overview
- Executive Summary - Chart on Market Overview
- Executive Summary - Data Table on Market Overview
- Executive Summary - Chart on Global Market Characteristics
- Executive Summary - Chart on Market By Geographical Landscape
- Executive Summary - Chart on Market Segmentation by Application
- Executive Summary - Chart on Market Segmentation by Type
- Executive Summary - Chart on Incremental Growth
- Executive Summary - Data Table on Incremental Growth
- Executive Summary - Chart on Company Market Positioning
2 Market Landscape
- 2.1 Market ecosystem
- Parent Market
- Data Table on - Parent Market
- 2.2 Market characteristics
- Market characteristics analysis
- 2.3 Value chain analysis
- Value Chain Analysis
3 Market Sizing
- 3.1 Market definition
- Offerings of companies included in the market definition
- 3.2 Market segment analysis
- Market segments
- 3.3 Market size 2023
- 3.4 Market outlook: Forecast for 2023-2028
- Chart on Global - Market size and forecast 2023-2028 ($ million)
- Data Table on Global - Market size and forecast 2023-2028 ($ million)
- Chart on Global Market: Year-over-year growth 2023-2028 (%)
- Data Table on Global Market: Year-over-year growth 2023-2028 (%)
4 Historic Market Size
- 4.1 Global Blast Furnaces Market 2018 - 2022
- Historic Market Size - Data Table on Global Blast Furnaces Market 2018 - 2022 ($ million)
- 4.2 Application segment analysis 2018 - 2022
- Historic Market Size - Application Segment 2018 - 2022 ($ million)
- 4.3 Type segment analysis 2018 - 2022
- Historic Market Size - Type Segment 2018 - 2022 ($ million)
- 4.4 Geography segment analysis 2018 - 2022
- Historic Market Size - Geography Segment 2018 - 2022 ($ million)
- 4.5 Country segment analysis 2018 - 2022
- Historic Market Size - Country Segment 2018 - 2022 ($ million)
5 Five Forces Analysis
- 5.1 Five forces summary
- Five forces analysis - Comparison between 2023 and 2028
- 5.2 Bargaining power of buyers
- Bargaining power of buyers - Impact of key factors 2023 and 2028
- 5.3 Bargaining power of suppliers
- Bargaining power of suppliers - Impact of key factors in 2023 and 2028
- 5.4 Threat of new entrants
- Threat of new entrants - Impact of key factors in 2023 and 2028
- 5.5 Threat of substitutes
- Threat of substitutes - Impact of key factors in 2023 and 2028
- 5.6 Threat of rivalry
- Threat of rivalry - Impact of key factors in 2023 and 2028
- 5.7 Market condition
- Chart on Market condition - Five forces 2023 and 2028
6 Market Segmentation by Application
- 6.1 Market segments
- Chart on Application - Market share 2023-2028 (%)
- Data Table on Application - Market share 2023-2028 (%)
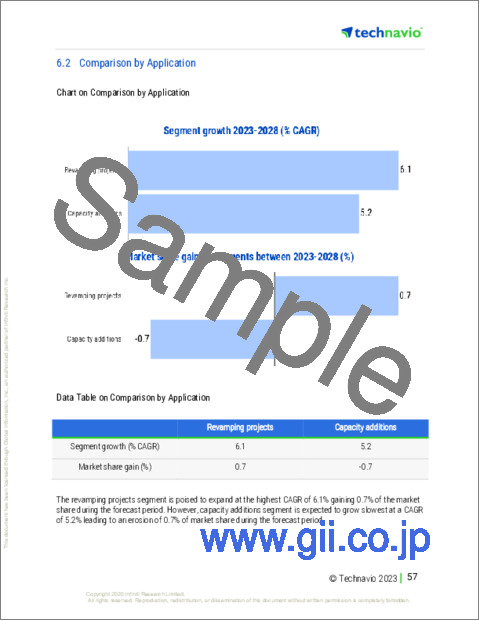
- 6.2 Comparison by Application
- Chart on Comparison by Application
- Data Table on Comparison by Application
- 6.3 Revamping projects - Market size and forecast 2023-2028
- Chart on Revamping projects - Market size and forecast 2023-2028 ($ million)
- Data Table on Revamping projects - Market size and forecast 2023-2028 ($ million)
- Chart on Revamping projects - Year-over-year growth 2023-2028 (%)
- Data Table on Revamping projects - Year-over-year growth 2023-2028 (%)
- 6.4 Capacity additions - Market size and forecast 2023-2028
- Chart on Capacity additions - Market size and forecast 2023-2028 ($ million)
- Data Table on Capacity additions - Market size and forecast 2023-2028 ($ million)
- Chart on Capacity additions - Year-over-year growth 2023-2028 (%)
- Data Table on Capacity additions - Year-over-year growth 2023-2028 (%)
- 6.5 Market opportunity by Application
- Market opportunity by Application ($ million)
- Data Table on Market opportunity by Application ($ million)
7 Market Segmentation by Type
- 7.1 Market segments
- Chart on Type - Market share 2023-2028 (%)
- Data Table on Type - Market share 2023-2028 (%)
- 7.2 Comparison by Type
- Chart on Comparison by Type
- Data Table on Comparison by Type
- 7.3 Hot blast ovens - Market size and forecast 2023-2028
- Chart on Hot blast ovens - Market size and forecast 2023-2028 ($ million)
- Data Table on Hot blast ovens - Market size and forecast 2023-2028 ($ million)
- Chart on Hot blast ovens - Year-over-year growth 2023-2028 (%)
- Data Table on Hot blast ovens - Year-over-year growth 2023-2028 (%)
- 7.4 Cold blast blowers - Market size and forecast 2023-2028
- Chart on Cold blast blowers - Market size and forecast 2023-2028 ($ million)
- Data Table on Cold blast blowers - Market size and forecast 2023-2028 ($ million)
- Chart on Cold blast blowers - Year-over-year growth 2023-2028 (%)
- Data Table on Cold blast blowers - Year-over-year growth 2023-2028 (%)
- 7.5 Market opportunity by Type
- Market opportunity by Type ($ million)
- Data Table on Market opportunity by Type ($ million)
8 Customer Landscape
- 8.1 Customer landscape overview
- Analysis of price sensitivity, lifecycle, customer purchase basket, adoption rates, and purchase criteria
9 Geographic Landscape
- 9.1 Geographic segmentation
- Chart on Market share By Geographical Landscape 2023-2028 (%)
- Data Table on Market share By Geographical Landscape 2023-2028 (%)
- 9.2 Geographic comparison
- Chart on Geographic comparison
- Data Table on Geographic comparison
- 9.3 APAC - Market size and forecast 2023-2028
- Chart on APAC - Market size and forecast 2023-2028 ($ million)
- Data Table on APAC - Market size and forecast 2023-2028 ($ million)
- Chart on APAC - Year-over-year growth 2023-2028 (%)
- Data Table on APAC - Year-over-year growth 2023-2028 (%)
- 9.4 Europe - Market size and forecast 2023-2028
- Chart on Europe - Market size and forecast 2023-2028 ($ million)
- Data Table on Europe - Market size and forecast 2023-2028 ($ million)
- Chart on Europe - Year-over-year growth 2023-2028 (%)
- Data Table on Europe - Year-over-year growth 2023-2028 (%)
- 9.5 North America - Market size and forecast 2023-2028
- Chart on North America - Market size and forecast 2023-2028 ($ million)
- Data Table on North America - Market size and forecast 2023-2028 ($ million)
- Chart on North America - Year-over-year growth 2023-2028 (%)
- Data Table on North America - Year-over-year growth 2023-2028 (%)
- 9.6 Middle East and Africa - Market size and forecast 2023-2028
- Chart on Middle East and Africa - Market size and forecast 2023-2028 ($ million)
- Data Table on Middle East and Africa - Market size and forecast 2023-2028 ($ million)
- Chart on Middle East and Africa - Year-over-year growth 2023-2028 (%)
- Data Table on Middle East and Africa - Year-over-year growth 2023-2028 (%)
- 9.7 South America - Market size and forecast 2023-2028
- Chart on South America - Market size and forecast 2023-2028 ($ million)
- Data Table on South America - Market size and forecast 2023-2028 ($ million)
- Chart on South America - Year-over-year growth 2023-2028 (%)
- Data Table on South America - Year-over-year growth 2023-2028 (%)
- 9.8 China - Market size and forecast 2023-2028
- Chart on China - Market size and forecast 2023-2028 ($ million)
- Data Table on China - Market size and forecast 2023-2028 ($ million)
- Chart on China - Year-over-year growth 2023-2028 (%)
- Data Table on China - Year-over-year growth 2023-2028 (%)
- 9.9 India - Market size and forecast 2023-2028
- Chart on India - Market size and forecast 2023-2028 ($ million)
- Data Table on India - Market size and forecast 2023-2028 ($ million)
- Chart on India - Year-over-year growth 2023-2028 (%)
- Data Table on India - Year-over-year growth 2023-2028 (%)
- 9.10 US - Market size and forecast 2023-2028
- Chart on US - Market size and forecast 2023-2028 ($ million)
- Data Table on US - Market size and forecast 2023-2028 ($ million)
- Chart on US - Year-over-year growth 2023-2028 (%)
- Data Table on US - Year-over-year growth 2023-2028 (%)
- 9.11 Russia - Market size and forecast 2023-2028
- Chart on Russia - Market size and forecast 2023-2028 ($ million)
- Data Table on Russia - Market size and forecast 2023-2028 ($ million)
- Chart on Russia - Year-over-year growth 2023-2028 (%)
- Data Table on Russia - Year-over-year growth 2023-2028 (%)
- 9.12 Japan - Market size and forecast 2023-2028
- Chart on Japan - Market size and forecast 2023-2028 ($ million)
- Data Table on Japan - Market size and forecast 2023-2028 ($ million)
- Chart on Japan - Year-over-year growth 2023-2028 (%)
- Data Table on Japan - Year-over-year growth 2023-2028 (%)
- 9.13 Market opportunity By Geographical Landscape
- Market opportunity By Geographical Landscape ($ million)
- Data Tables on Market opportunity By Geographical Landscape ($ million)
10 Drivers, Challenges, and Opportunity/Restraints
- 10.1 Market drivers
- 10.2 Market challenges
- 10.3 Impact of drivers and challenges
- Impact of drivers and challenges in 2023 and 2028
- 10.4 Market opportunities/restraints
11 Competitive Landscape
- 11.1 Overview
- 11.2 Competitive Landscape
- Overview on criticality of inputs and factors of differentiation
- 11.3 Landscape disruption
- Overview on factors of disruption
- 11.4 Industry risks
- Impact of key risks on business
12 Competitive Analysis
- 12.1 Companies profiled
- Companies covered
- 12.2 Market positioning of companies
- Matrix on companies position and classification
- 12.3 China Metallurgical Engineering and Project Corp.
- China Metallurgical Engineering and Project Corp. - Overview
- China Metallurgical Engineering and Project Corp. - Product / Service
- China Metallurgical Engineering and Project Corp. - Key offerings
- 12.4 Compagnie de Saint Gobain
- Compagnie de Saint Gobain - Overview
- Compagnie de Saint Gobain - Business segments
- Compagnie de Saint Gobain - Key news
- Compagnie de Saint Gobain - Key offerings
- Compagnie de Saint Gobain - Segment focus
- 12.5 Danieli and C. Officine Meccaniche Spa
- Danieli and C. Officine Meccaniche Spa - Overview
- Danieli and C. Officine Meccaniche Spa - Business segments
- Danieli and C. Officine Meccaniche Spa - Key offerings
- Danieli and C. Officine Meccaniche Spa - Segment focus
- 12.6 Gillanders Arbuthnot and Co. Ltd.
- Gillanders Arbuthnot and Co. Ltd. - Overview
- Gillanders Arbuthnot and Co. Ltd. - Business segments
- Gillanders Arbuthnot and Co. Ltd. - Key offerings
- Gillanders Arbuthnot and Co. Ltd. - Segment focus
- 12.7 IHI Corp.
- IHI Corp. - Overview
- IHI Corp. - Business segments
- IHI Corp. - Key offerings
- IHI Corp. - Segment focus
- 12.8 JP Steel Plantech Co.
- JP Steel Plantech Co. - Overview
- JP Steel Plantech Co. - Product / Service
- JP Steel Plantech Co. - Key offerings
- 12.9 Larsen and Toubro Ltd.
- Larsen and Toubro Ltd. - Overview
- Larsen and Toubro Ltd. - Business segments
- Larsen and Toubro Ltd. - Key news
- Larsen and Toubro Ltd. - Key offerings
- Larsen and Toubro Ltd. - Segment focus
- 12.10 McNally Bharat Engineering Co. Ltd.
- McNally Bharat Engineering Co. Ltd. - Overview
- McNally Bharat Engineering Co. Ltd. - Product / Service
- McNally Bharat Engineering Co. Ltd. - Key offerings
- 12.11 MECON Ltd.
- MECON Ltd. - Overview
- MECON Ltd. - Business segments
- MECON Ltd. - Key offerings
- MECON Ltd. - Segment focus
- 12.12 Nippon Steel Corp.
- Nippon Steel Corp. - Overview
- Nippon Steel Corp. - Business segments
- Nippon Steel Corp. - Key offerings
- Nippon Steel Corp. - Segment focus
- 12.13 Noble Industrial Furnace Co. Inc.
- Noble Industrial Furnace Co. Inc. - Overview
- Noble Industrial Furnace Co. Inc. - Product / Service
- Noble Industrial Furnace Co. Inc. - Key offerings
- 12.14 POSCO holdings Inc.
- POSCO holdings Inc. - Overview
- POSCO holdings Inc. - Product / Service
- POSCO holdings Inc. - Key offerings
- 12.15 Primetals Technologies Ltd.
- Primetals Technologies Ltd. - Overview
- Primetals Technologies Ltd. - Product / Service
- Primetals Technologies Ltd. - Key offerings
- 12.16 Shandong Province Metallurgical Engineering Co. Ltd.
- Shandong Province Metallurgical Engineering Co. Ltd. - Overview
- Shandong Province Metallurgical Engineering Co. Ltd. - Product / Service
- Shandong Province Metallurgical Engineering Co. Ltd. - Key offerings
- 12.17 SMS group GmbH
- SMS group GmbH - Overview
- SMS group GmbH - Product / Service
- SMS group GmbH - Key offerings
13 Appendix
- 13.1 Scope of the report
- 13.2 Inclusions and exclusions checklist
- Inclusions checklist
- Exclusions checklist
- 13.3 Currency conversion rates for US$
- Currency conversion rates for US$
- 13.4 Research methodology
- Research methodology
- 13.5 Data procurement
- Information sources
- 13.6 Data validation
- Data validation
- 13.7 Validation techniques employed for market sizing
- Validation techniques employed for market sizing
- 13.8 Data synthesis
- Data synthesis
- 13.9 360 degree market analysis
- 360 degree market analysis
- 13.10 List of abbreviations
- List of abbreviations

