|
|
市場調査レポート
商品コード
1626359
内視鏡クロージャーデバイスの世界市場 2025-2029年Global Endoscopic Closure Devices Market 2025-2029 |
||||||

|
|||||||
カスタマイズ可能
|
|||||||


| 内視鏡クロージャーデバイスの世界市場 2025-2029年 |
|
出版日: 2024年12月17日
発行: TechNavio
ページ情報: 英文 207 Pages
納期: 即納可能
|

全表示
- 概要
- 図表
- 目次
内視鏡クロージャーデバイス市場 2025-2029年
内視鏡クロージャーデバイス市場は2024-2029年に8億2,570万米ドル、予測期間中のCAGRは8%と予測されています。当レポートでは、内視鏡クロージャーデバイス市場の全体的な分析、市場規模・予測、動向、成長促進要因、課題、約25のベンダーを網羅したベンダー分析などを掲載しています。
現在の市場シナリオ、最新動向と促進要因、市場環境全体に関する最新分析を提供しています。市場は、消化器系疾患の罹患率の増加、対象人口の増加に伴う内視鏡検査件数の増加、MI手技に対する需要の高まりによって牽引されています。
| 市場範囲 | |
|---|---|
| 基準年 | 2025 |
| 終了年 | 2029 |
| 予測期間 | 2025-2029 |
| 成長モメンタム | 加速 |
| 前年比2025年 | 7.3% |
| CAGR | 8% |
| 増分額 | 8億2,570万米ドル |
本調査では、今後数年間の内視鏡クロージャーデバイス市場成長を牽引する主要因の一つとして、内視鏡機器の技術進歩を挙げています。また、内視鏡手術におけるロボット導入へのパラダイムシフトや、内視鏡クロージャーデバイスにおける画像技術の統合が進むことで、同市場は大きな需要につながると思われます。
目次
第1章 エグゼクティブサマリー
- 市場概要
第2章 Technavio別分析
- 価格・ライフサイクル・顧客購入バスケット・採用率・購入基準の分析
- インプットの重要性と差別化の要因
- 混乱の要因
- 促進要因と課題の影響
第3章 市場情勢
- 市場エコシステム
- 市場の特徴
- バリューチェーン分析
第4章 市場規模
- 市場の定義
- 市場セグメント分析
- 市場規模 2024
- 市場の見通し 2024-2029
第5章 市場規模実績
- 内視鏡クロージャーデバイスの世界市場 2019-2023
- 製品別セグメント分析 2019-2023
- エンドユーザー別セグメント分析 2019-2023
- 地域別セグメント分析 2019-2023
- 国別セグメント分析 2019-2023
第6章 定性分析
- AIの影響内視鏡クロージャーデバイスの世界市場
第7章 ファイブフォース分析
- ファイブフォースの要約
- 買い手の交渉力
- 供給企業の交渉力
- 新規参入業者の脅威
- 代替品の脅威
- 競争の脅威
- 市況
第8章 市場セグメンテーション:製品別
- 市場セグメント
- 比較:製品別
- 内視鏡クロージャシステム:市場規模と予測 2024-2029
- 内視鏡クリップ:市場規模と予測 2024-2029
- その他:市場規模と予測 2024-2029
- 市場機会:製品別
第9章 市場セグメンテーション:エンドユーザー別
- 市場セグメント
- 比較:エンドユーザー別
- 病院:市場規模と予測 2024-2029
- 外来手術センター:市場規模と予測 2024-2029
- その他:市場規模と予測 2024-2029
- 市場機会:エンドユーザー別
第10章 顧客情勢
- 顧客情勢の概要
第11章 地域別情勢
- 地域別セグメンテーション
- 地域別:比較
- 北米:市場規模と予測 2024-2029
- 欧州:市場規模と予測 2024-2029
- アジア:市場規模と予測 2024-2029
- 世界のその他の地域:市場規模と予測 2024-2029
- 米国:市場規模と予測 2024-2029
- 中国:市場規模と予測 2024-2029
- ドイツ:市場規模と予測 2024-2029
- カナダ:市場規模と予測 2024-2029
- 英国:市場規模と予測 2024-2029
- 日本:市場規模と予測 2024-2029
- フランス:市場規模と予測 2024-2029
- ブラジル:市場規模と予測 2024-2029
- アラブ首長国連邦:市場規模と予測 2024-2029
- インド:市場規模と予測 2024-2029
- 市場機会:地域情勢別
第12章 促進要因・課題・機会・抑制要因
- 市場促進要因
- 市場の課題
- 促進要因と課題の影響
- 市場の機会・抑制要因
第13章 競合情勢
- 概要
- 競合情勢
- 混乱の状況
- 業界のリスク
第14章 競合分析
- 企業プロファイル
- 企業ランキング指数
- 企業の市場ポジショニング
- Abbott Laboratories
- Ackermann Instrumente GmbH
- B.Braun SE
- Boston Scientific Corp.
- Changzhou Jiuhong Medical Instrument Co.
- Cook Group Inc.
- Haemonetics Corp.
- Johnson and Johnson Inc.
- Medtronic Plc
- Micro Tech Nanjing Co. Ltd.
- Olympus Corp.
- Ovesco Endoscopy AG
- STERIS plc
- Teleflex Inc.
- The Cooper Companies Inc.
第15章 付録
Exhibits:
- Exhibits1: Executive Summary - Chart on Market Overview
- Exhibits2: Executive Summary - Data Table on Market Overview
- Exhibits3: Executive Summary - Chart on Global Market Characteristics
- Exhibits4: Executive Summary - Chart on Market By Geographical Landscape
- Exhibits5: Executive Summary - Chart on Market Segmentation by Product
- Exhibits6: Executive Summary - Chart on Market Segmentation by End-user
- Exhibits7: Executive Summary - Chart on Incremental Growth
- Exhibits8: Executive Summary - Data Table on Incremental Growth
- Exhibits9: Executive Summary - Chart on Company Market Positioning
- Exhibits10: Analysis of price sensitivity, lifecycle, customer purchase basket, adoption rates, and purchase criteria
- Exhibits11: Overview on criticality of inputs and factors of differentiation
- Exhibits12: Overview on factors of disruption
- Exhibits13: Impact of drivers and challenges in 2024 and 2029
- Exhibits14: Parent Market
- Exhibits15: Data Table on - Parent Market
- Exhibits16: Market characteristics analysis
- Exhibits17: Value chain analysis
- Exhibits18: Offerings of companies included in the market definition
- Exhibits19: Market segments
- Exhibits20: Chart on Global - Market size and forecast 2024-2029 ($ million)
- Exhibits21: Data Table on Global - Market size and forecast 2024-2029 ($ million)
- Exhibits22: Chart on Global Market: Year-over-year growth 2024-2029 (%)
- Exhibits23: Data Table on Global Market: Year-over-year growth 2024-2029 (%)
- Exhibits24: Historic Market Size - Data Table on Global Endoscopic Closure Devices Market 2019 - 2023 ($ million)
- Exhibits25: Historic Market Size - Product Segment 2019 - 2023 ($ million)
- Exhibits26: Historic Market Size - End-user Segment 2019 - 2023 ($ million)
- Exhibits27: Historic Market Size - Geography Segment 2019 - 2023 ($ million)
- Exhibits28: Historic Market Size - Country Segment 2019 - 2023 ($ million)
- Exhibits29: Five forces analysis - Comparison between 2024 and 2029
- Exhibits30: Bargaining power of buyers - Impact of key factors 2024 and 2029
- Exhibits31: Bargaining power of suppliers - Impact of key factors in 2024 and 2029
- Exhibits32: Threat of new entrants - Impact of key factors in 2024 and 2029
- Exhibits33: Threat of substitutes - Impact of key factors in 2024 and 2029
- Exhibits34: Threat of rivalry - Impact of key factors in 2024 and 2029
- Exhibits35: Chart on Market condition - Five forces 2024 and 2029
- Exhibits36: Chart on Product - Market share 2024-2029 (%)
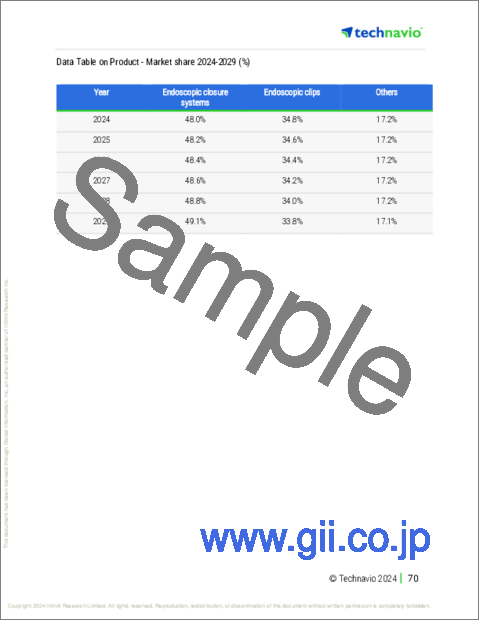
- Exhibits37: Data Table on Product - Market share 2024-2029 (%)
- Exhibits38: Chart on Comparison by Product
- Exhibits39: Data Table on Comparison by Product
- Exhibits40: Chart on Endoscopic closure systems - Market size and forecast 2024-2029 ($ million)
- Exhibits41: Data Table on Endoscopic closure systems - Market size and forecast 2024-2029 ($ million)
- Exhibits42: Chart on Endoscopic closure systems - Year-over-year growth 2024-2029 (%)
- Exhibits43: Data Table on Endoscopic closure systems - Year-over-year growth 2024-2029 (%)
- Exhibits44: Chart on Endoscopic clips - Market size and forecast 2024-2029 ($ million)
- Exhibits45: Data Table on Endoscopic clips - Market size and forecast 2024-2029 ($ million)
- Exhibits46: Chart on Endoscopic clips - Year-over-year growth 2024-2029 (%)
- Exhibits47: Data Table on Endoscopic clips - Year-over-year growth 2024-2029 (%)
- Exhibits48: Chart on Others - Market size and forecast 2024-2029 ($ million)
- Exhibits49: Data Table on Others - Market size and forecast 2024-2029 ($ million)
- Exhibits50: Chart on Others - Year-over-year growth 2024-2029 (%)
- Exhibits51: Data Table on Others - Year-over-year growth 2024-2029 (%)
- Exhibits52: Market opportunity by Product ($ million)
- Exhibits53: Data Table on Market opportunity by Product ($ million)
- Exhibits54: Chart on End-user - Market share 2024-2029 (%)
- Exhibits55: Data Table on End-user - Market share 2024-2029 (%)
- Exhibits56: Chart on Comparison by End-user
- Exhibits57: Data Table on Comparison by End-user
- Exhibits58: Chart on Hospitals - Market size and forecast 2024-2029 ($ million)
- Exhibits59: Data Table on Hospitals - Market size and forecast 2024-2029 ($ million)
- Exhibits60: Chart on Hospitals - Year-over-year growth 2024-2029 (%)
- Exhibits61: Data Table on Hospitals - Year-over-year growth 2024-2029 (%)
- Exhibits62: Chart on Ambulatory surgery centers - Market size and forecast 2024-2029 ($ million)
- Exhibits63: Data Table on Ambulatory surgery centers - Market size and forecast 2024-2029 ($ million)
- Exhibits64: Chart on Ambulatory surgery centers - Year-over-year growth 2024-2029 (%)
- Exhibits65: Data Table on Ambulatory surgery centers - Year-over-year growth 2024-2029 (%)
- Exhibits66: Chart on Others - Market size and forecast 2024-2029 ($ million)
- Exhibits67: Data Table on Others - Market size and forecast 2024-2029 ($ million)
- Exhibits68: Chart on Others - Year-over-year growth 2024-2029 (%)
- Exhibits69: Data Table on Others - Year-over-year growth 2024-2029 (%)
- Exhibits70: Market opportunity by End-user ($ million)
- Exhibits71: Data Table on Market opportunity by End-user ($ million)
- Exhibits72: Analysis of price sensitivity, lifecycle, customer purchase basket, adoption rates, and purchase criteria
- Exhibits73: Chart on Market share By Geographical Landscape 2024-2029 (%)
- Exhibits74: Data Table on Market share By Geographical Landscape 2024-2029 (%)
- Exhibits75: Chart on Geographic comparison
- Exhibits76: Data Table on Geographic comparison
- Exhibits77: Chart on North America - Market size and forecast 2024-2029 ($ million)
- Exhibits78: Data Table on North America - Market size and forecast 2024-2029 ($ million)
- Exhibits79: Chart on North America - Year-over-year growth 2024-2029 (%)
- Exhibits80: Data Table on North America - Year-over-year growth 2024-2029 (%)
- Exhibits81: Chart on Europe - Market size and forecast 2024-2029 ($ million)
- Exhibits82: Data Table on Europe - Market size and forecast 2024-2029 ($ million)
- Exhibits83: Chart on Europe - Year-over-year growth 2024-2029 (%)
- Exhibits84: Data Table on Europe - Year-over-year growth 2024-2029 (%)
- Exhibits85: Chart on Asia - Market size and forecast 2024-2029 ($ million)
- Exhibits86: Data Table on Asia - Market size and forecast 2024-2029 ($ million)
- Exhibits87: Chart on Asia - Year-over-year growth 2024-2029 (%)
- Exhibits88: Data Table on Asia - Year-over-year growth 2024-2029 (%)
- Exhibits89: Chart on Rest of World (ROW) - Market size and forecast 2024-2029 ($ million)
- Exhibits90: Data Table on Rest of World (ROW) - Market size and forecast 2024-2029 ($ million)
- Exhibits91: Chart on Rest of World (ROW) - Year-over-year growth 2024-2029 (%)
- Exhibits92: Data Table on Rest of World (ROW) - Year-over-year growth 2024-2029 (%)
- Exhibits93: Chart on US - Market size and forecast 2024-2029 ($ million)
- Exhibits94: Data Table on US - Market size and forecast 2024-2029 ($ million)
- Exhibits95: Chart on US - Year-over-year growth 2024-2029 (%)
- Exhibits96: Data Table on US - Year-over-year growth 2024-2029 (%)
- Exhibits97: Chart on China - Market size and forecast 2024-2029 ($ million)
- Exhibits98: Data Table on China - Market size and forecast 2024-2029 ($ million)
- Exhibits99: Chart on China - Year-over-year growth 2024-2029 (%)
- Exhibits100: Data Table on China - Year-over-year growth 2024-2029 (%)
- Exhibits101: Chart on Germany - Market size and forecast 2024-2029 ($ million)
- Exhibits102: Data Table on Germany - Market size and forecast 2024-2029 ($ million)
- Exhibits103: Chart on Germany - Year-over-year growth 2024-2029 (%)
- Exhibits104: Data Table on Germany - Year-over-year growth 2024-2029 (%)
- Exhibits105: Chart on Canada - Market size and forecast 2024-2029 ($ million)
- Exhibits106: Data Table on Canada - Market size and forecast 2024-2029 ($ million)
- Exhibits107: Chart on Canada - Year-over-year growth 2024-2029 (%)
- Exhibits108: Data Table on Canada - Year-over-year growth 2024-2029 (%)
- Exhibits109: Chart on UK - Market size and forecast 2024-2029 ($ million)
- Exhibits110: Data Table on UK - Market size and forecast 2024-2029 ($ million)
- Exhibits111: Chart on UK - Year-over-year growth 2024-2029 (%)
- Exhibits112: Data Table on UK - Year-over-year growth 2024-2029 (%)
- Exhibits113: Chart on Japan - Market size and forecast 2024-2029 ($ million)
- Exhibits114: Data Table on Japan - Market size and forecast 2024-2029 ($ million)
- Exhibits115: Chart on Japan - Year-over-year growth 2024-2029 (%)
- Exhibits116: Data Table on Japan - Year-over-year growth 2024-2029 (%)
- Exhibits117: Chart on France - Market size and forecast 2024-2029 ($ million)
- Exhibits118: Data Table on France - Market size and forecast 2024-2029 ($ million)
- Exhibits119: Chart on France - Year-over-year growth 2024-2029 (%)
- Exhibits120: Data Table on France - Year-over-year growth 2024-2029 (%)
- Exhibits121: Chart on Brazil - Market size and forecast 2024-2029 ($ million)
- Exhibits122: Data Table on Brazil - Market size and forecast 2024-2029 ($ million)
- Exhibits123: Chart on Brazil - Year-over-year growth 2024-2029 (%)
- Exhibits124: Data Table on Brazil - Year-over-year growth 2024-2029 (%)
- Exhibits125: Chart on UAE - Market size and forecast 2024-2029 ($ million)
- Exhibits126: Data Table on UAE - Market size and forecast 2024-2029 ($ million)
- Exhibits127: Chart on UAE - Year-over-year growth 2024-2029 (%)
- Exhibits128: Data Table on UAE - Year-over-year growth 2024-2029 (%)
- Exhibits129: Chart on India - Market size and forecast 2024-2029 ($ million)
- Exhibits130: Data Table on India - Market size and forecast 2024-2029 ($ million)
- Exhibits131: Chart on India - Year-over-year growth 2024-2029 (%)
- Exhibits132: Data Table on India - Year-over-year growth 2024-2029 (%)
- Exhibits133: Market opportunity By Geographical Landscape ($ million)
- Exhibits134: Data Tables on Market opportunity By Geographical Landscape ($ million)
- Exhibits135: Impact of drivers and challenges in 2024 and 2029
- Exhibits136: Overview on criticality of inputs and factors of differentiation
- Exhibits137: Overview on factors of disruption
- Exhibits138: Impact of key risks on business
- Exhibits139: Companies covered
- Exhibits140: Company ranking index
- Exhibits141: Matrix on companies position and classification
- Exhibits142: Abbott Laboratories - Overview
- Exhibits143: Abbott Laboratories - Business segments
- Exhibits144: Abbott Laboratories - Key news
- Exhibits145: Abbott Laboratories - Key offerings
- Exhibits146: Abbott Laboratories - Segment focus
- Exhibits147: SWOT
- Exhibits148: Ackermann Instrumente GmbH - Overview
- Exhibits149: Ackermann Instrumente GmbH - Product / Service
- Exhibits150: Ackermann Instrumente GmbH - Key offerings
- Exhibits151: SWOT
- Exhibits152: B.Braun SE - Overview
- Exhibits153: B.Braun SE - Product / Service
- Exhibits154: B.Braun SE - Key news
- Exhibits155: B.Braun SE - Key offerings
- Exhibits156: SWOT
- Exhibits157: Boston Scientific Corp. - Overview
- Exhibits158: Boston Scientific Corp. - Business segments
- Exhibits159: Boston Scientific Corp. - Key news
- Exhibits160: Boston Scientific Corp. - Key offerings
- Exhibits161: Boston Scientific Corp. - Segment focus
- Exhibits162: SWOT
- Exhibits163: Changzhou Jiuhong Medical Instrument Co. - Overview
- Exhibits164: Changzhou Jiuhong Medical Instrument Co. - Product / Service
- Exhibits165: Changzhou Jiuhong Medical Instrument Co. - Key offerings
- Exhibits166: SWOT
- Exhibits167: Cook Group Inc. - Overview
- Exhibits168: Cook Group Inc. - Product / Service
- Exhibits169: Cook Group Inc. - Key offerings
- Exhibits170: SWOT
- Exhibits171: Haemonetics Corp. - Overview
- Exhibits172: Haemonetics Corp. - Business segments
- Exhibits173: Haemonetics Corp. - Key offerings
- Exhibits174: Haemonetics Corp. - Segment focus
- Exhibits175: SWOT
- Exhibits176: Johnson and Johnson Inc. - Overview
- Exhibits177: Johnson and Johnson Inc. - Business segments
- Exhibits178: Johnson and Johnson Inc. - Key news
- Exhibits179: Johnson and Johnson Inc. - Key offerings
- Exhibits180: Johnson and Johnson Inc. - Segment focus
- Exhibits181: SWOT
- Exhibits182: Medtronic Plc - Overview
- Exhibits183: Medtronic Plc - Business segments
- Exhibits184: Medtronic Plc - Key news
- Exhibits185: Medtronic Plc - Key offerings
- Exhibits186: Medtronic Plc - Segment focus
- Exhibits187: SWOT
- Exhibits188: Micro Tech Nanjing Co. Ltd. - Overview
- Exhibits189: Micro Tech Nanjing Co. Ltd. - Product / Service
- Exhibits190: Micro Tech Nanjing Co. Ltd. - Key offerings
- Exhibits191: SWOT
- Exhibits192: Olympus Corp. - Overview
- Exhibits193: Olympus Corp. - Business segments
- Exhibits194: Olympus Corp. - Key news
- Exhibits195: Olympus Corp. - Key offerings
- Exhibits196: Olympus Corp. - Segment focus
- Exhibits197: SWOT
- Exhibits198: Ovesco Endoscopy AG - Overview
- Exhibits199: Ovesco Endoscopy AG - Product / Service
- Exhibits200: Ovesco Endoscopy AG - Key offerings
- Exhibits201: SWOT
- Exhibits202: STERIS plc - Overview
- Exhibits203: STERIS plc - Business segments
- Exhibits204: STERIS plc - Key news
- Exhibits205: STERIS plc - Key offerings
- Exhibits206: STERIS plc - Segment focus
- Exhibits207: SWOT
- Exhibits208: Teleflex Inc. - Overview
- Exhibits209: Teleflex Inc. - Business segments
- Exhibits210: Teleflex Inc. - Key news
- Exhibits211: Teleflex Inc. - Key offerings
- Exhibits212: Teleflex Inc. - Segment focus
- Exhibits213: SWOT
- Exhibits214: The Cooper Companies Inc. - Overview
- Exhibits215: The Cooper Companies Inc. - Business segments
- Exhibits216: The Cooper Companies Inc. - Key news
- Exhibits217: The Cooper Companies Inc. - Key offerings
- Exhibits218: The Cooper Companies Inc. - Segment focus
- Exhibits219: SWOT
- Exhibits220: Inclusions checklist
- Exhibits221: Exclusions checklist
- Exhibits222: Currency conversion rates for US$
- Exhibits223: Research methodology
- Exhibits224: Information sources
- Exhibits225: Data validation
- Exhibits226: Validation techniques employed for market sizing
- Exhibits227: Data synthesis
- Exhibits228: 360 degree market analysis
- Exhibits229: List of abbreviations
Endoscopic Closure Devices Market 2025-2029
The endoscopic closure devices market is forecasted to grow by USD 825.7 mn during 2024-2029, accelerating at a CAGR of 8% during the forecast period. The report on the endoscopic closure devices market provides a holistic analysis, market size and forecast, trends, growth drivers, and challenges, as well as vendor analysis covering around 25 vendors.
The report offers an up-to-date analysis regarding the current market scenario, the latest trends and drivers, and the overall market environment. The market is driven by increasing incidence of gastrointestinal diseases, increasing volume of endoscopy procedures coupled with growing target population, and growing demand for mi procedures.
| Market Scope | |
|---|---|
| Base Year | 2025 |
| End Year | 2029 |
| Series Year | 2025-2029 |
| Growth Momentum | Accelerate |
| YOY 2025 | 7.3% |
| CAGR | 8% |
| Incremental Value | $825.7 mn |
Technavio's endoscopic closure devices market is segmented as below:
By Product
- Endoscopic closure systems
- Endoscopic clips
- Others
By End-user
- Hospitals
- Ambulatory surgery centers
- Others
By Geographical Landscape
- North America
- Europe
- Asia
- Rest of World (ROW)
This study identifies the technological advances in endoscopic devices as one of the prime reasons driving the endoscopic closure devices market growth during the next few years. Also, paradigm shift toward adoption of robotics in endoscopic surgeries and rise in integration of imaging technologies in endoscopic closure devices will lead to sizable demand in the market.
The report on the endoscopic closure devices market covers the following areas:
- Endoscopic Closure Devices Market sizing
- Endoscopic Closure Devices Market forecast
- Endoscopic Closure Devices Market industry analysis
The robust vendor analysis is designed to help clients improve their market position, and in line with this, this report provides a detailed analysis of several leading endoscopic closure devices market vendors that include Abbott Laboratories, Ackermann Instrumente GmbH, AHM Grup, Ambu AS, B.Braun SE, Boston Scientific Corp., Cardinal Health Inc., Changzhou Jiuhong Medical Instrument Co., Cook Group Inc., Endocor GmbH and Co. KG, Era Endoscopy Srl, Haemonetics Corp., Johnson and Johnson Inc., Medtronic Plc, Micro Tech Nanjing Co. Ltd., Olympus Corp., Ovesco Endoscopy AG, STERIS plc, Teleflex Inc., and The Cooper Companies Inc.. Also, the endoscopic closure devices market analysis report includes information on upcoming trends and challenges that will influence market growth. This is to help companies strategize and leverage all forthcoming growth opportunities.
The study was conducted using an objective combination of primary and secondary information including inputs from key participants in the industry. The report contains a comprehensive market and vendor landscape in addition to an analysis of the key vendors.
The publisher presents a detailed picture of the market by the way of study, synthesis, and summation of data from multiple sources by an analysis of key parameters such as profit, pricing, competition, and promotions. It presents various market facets by identifying the key industry influencers. The data presented is comprehensive, reliable, and a result of extensive primary and secondary research. The market research reports provide a complete competitive landscape and an in-depth vendor selection methodology and analysis using qualitative and quantitative research to forecast accurate market growth.
Table of Contents
1 Executive Summary
- 1.1 Market overview
- Executive Summary - Chart on Market Overview
- Executive Summary - Data Table on Market Overview
- Executive Summary - Chart on Global Market Characteristics
- Executive Summary - Chart on Market By Geographical Landscape
- Executive Summary - Chart on Market Segmentation by Product
- Executive Summary - Chart on Market Segmentation by End-user
- Executive Summary - Chart on Incremental Growth
- Executive Summary - Data Table on Incremental Growth
- Executive Summary - Chart on Company Market Positioning
2 Technavio Analysis
- 2.1 Analysis of price sensitivity, lifecycle, customer purchase basket, adoption rates, and purchase criteria
- Analysis of price sensitivity, lifecycle, customer purchase basket, adoption rates, and purchase criteria
- 2.2 Criticality of inputs and Factors of differentiation
- Overview on criticality of inputs and factors of differentiation
- 2.3 Factors of disruption
- Overview on factors of disruption
- 2.4 Impact of drivers and challenges
- Impact of drivers and challenges in 2024 and 2029
3 Market Landscape
- 3.1 Market ecosystem
- Parent Market
- Data Table on - Parent Market
- 3.2 Market characteristics
- Market characteristics analysis
- 3.3 Value chain analysis
- Value chain analysis
4 Market Sizing
- 4.1 Market definition
- Offerings of companies included in the market definition
- 4.2 Market segment analysis
- Market segments
- 4.3 Market size 2024
- 4.4 Market outlook: Forecast for 2024-2029
- Chart on Global - Market size and forecast 2024-2029 ($ million)
- Data Table on Global - Market size and forecast 2024-2029 ($ million)
- Chart on Global Market: Year-over-year growth 2024-2029 (%)
- Data Table on Global Market: Year-over-year growth 2024-2029 (%)
5 Historic Market Size
- 5.1 Global Endoscopic Closure Devices Market 2019 - 2023
- Historic Market Size - Data Table on Global Endoscopic Closure Devices Market 2019 - 2023 ($ million)
- 5.2 Product segment analysis 2019 - 2023
- Historic Market Size - Product Segment 2019 - 2023 ($ million)
- 5.3 End-user segment analysis 2019 - 2023
- Historic Market Size - End-user Segment 2019 - 2023 ($ million)
- 5.4 Geography segment analysis 2019 - 2023
- Historic Market Size - Geography Segment 2019 - 2023 ($ million)
- 5.5 Country segment analysis 2019 - 2023
- Historic Market Size - Country Segment 2019 - 2023 ($ million)
6 Qualitative Analysis
- 6.1 Impact of AI on Global Endoscopic Closure Devices Market
7 Five Forces Analysis
- 7.1 Five forces summary
- Five forces analysis - Comparison between 2024 and 2029
- 7.2 Bargaining power of buyers
- Bargaining power of buyers - Impact of key factors 2024 and 2029
- 7.3 Bargaining power of suppliers
- Bargaining power of suppliers - Impact of key factors in 2024 and 2029
- 7.4 Threat of new entrants
- Threat of new entrants - Impact of key factors in 2024 and 2029
- 7.5 Threat of substitutes
- Threat of substitutes - Impact of key factors in 2024 and 2029
- 7.6 Threat of rivalry
- Threat of rivalry - Impact of key factors in 2024 and 2029
- 7.7 Market condition
- Chart on Market condition - Five forces 2024 and 2029
8 Market Segmentation by Product
- 8.1 Market segments
- Chart on Product - Market share 2024-2029 (%)
- Data Table on Product - Market share 2024-2029 (%)
- 8.2 Comparison by Product
- Chart on Comparison by Product
- Data Table on Comparison by Product
- 8.3 Endoscopic closure systems - Market size and forecast 2024-2029
- Chart on Endoscopic closure systems - Market size and forecast 2024-2029 ($ million)
- Data Table on Endoscopic closure systems - Market size and forecast 2024-2029 ($ million)
- Chart on Endoscopic closure systems - Year-over-year growth 2024-2029 (%)
- Data Table on Endoscopic closure systems - Year-over-year growth 2024-2029 (%)
- 8.4 Endoscopic clips - Market size and forecast 2024-2029
- Chart on Endoscopic clips - Market size and forecast 2024-2029 ($ million)
- Data Table on Endoscopic clips - Market size and forecast 2024-2029 ($ million)
- Chart on Endoscopic clips - Year-over-year growth 2024-2029 (%)
- Data Table on Endoscopic clips - Year-over-year growth 2024-2029 (%)
- 8.5 Others - Market size and forecast 2024-2029
- Chart on Others - Market size and forecast 2024-2029 ($ million)
- Data Table on Others - Market size and forecast 2024-2029 ($ million)
- Chart on Others - Year-over-year growth 2024-2029 (%)
- Data Table on Others - Year-over-year growth 2024-2029 (%)
- 8.6 Market opportunity by Product
- Market opportunity by Product ($ million)
- Data Table on Market opportunity by Product ($ million)
9 Market Segmentation by End-user
- 9.1 Market segments
- Chart on End-user - Market share 2024-2029 (%)
- Data Table on End-user - Market share 2024-2029 (%)
- 9.2 Comparison by End-user
- Chart on Comparison by End-user
- Data Table on Comparison by End-user
- 9.3 Hospitals - Market size and forecast 2024-2029
- Chart on Hospitals - Market size and forecast 2024-2029 ($ million)
- Data Table on Hospitals - Market size and forecast 2024-2029 ($ million)
- Chart on Hospitals - Year-over-year growth 2024-2029 (%)
- Data Table on Hospitals - Year-over-year growth 2024-2029 (%)
- 9.4 Ambulatory surgery centers - Market size and forecast 2024-2029
- Chart on Ambulatory surgery centers - Market size and forecast 2024-2029 ($ million)
- Data Table on Ambulatory surgery centers - Market size and forecast 2024-2029 ($ million)
- Chart on Ambulatory surgery centers - Year-over-year growth 2024-2029 (%)
- Data Table on Ambulatory surgery centers - Year-over-year growth 2024-2029 (%)
- 9.5 Others - Market size and forecast 2024-2029
- Chart on Others - Market size and forecast 2024-2029 ($ million)
- Data Table on Others - Market size and forecast 2024-2029 ($ million)
- Chart on Others - Year-over-year growth 2024-2029 (%)
- Data Table on Others - Year-over-year growth 2024-2029 (%)
- 9.6 Market opportunity by End-user
- Market opportunity by End-user ($ million)
- Data Table on Market opportunity by End-user ($ million)
10 Customer Landscape
- 10.1 Customer landscape overview
- Analysis of price sensitivity, lifecycle, customer purchase basket, adoption rates, and purchase criteria
11 Geographic Landscape
- 11.1 Geographic segmentation
- Chart on Market share By Geographical Landscape 2024-2029 (%)
- Data Table on Market share By Geographical Landscape 2024-2029 (%)
- 11.2 Geographic comparison
- Chart on Geographic comparison
- Data Table on Geographic comparison
- 11.3 North America - Market size and forecast 2024-2029
- Chart on North America - Market size and forecast 2024-2029 ($ million)
- Data Table on North America - Market size and forecast 2024-2029 ($ million)
- Chart on North America - Year-over-year growth 2024-2029 (%)
- Data Table on North America - Year-over-year growth 2024-2029 (%)
- 11.4 Europe - Market size and forecast 2024-2029
- Chart on Europe - Market size and forecast 2024-2029 ($ million)
- Data Table on Europe - Market size and forecast 2024-2029 ($ million)
- Chart on Europe - Year-over-year growth 2024-2029 (%)
- Data Table on Europe - Year-over-year growth 2024-2029 (%)
- 11.5 Asia - Market size and forecast 2024-2029
- Chart on Asia - Market size and forecast 2024-2029 ($ million)
- Data Table on Asia - Market size and forecast 2024-2029 ($ million)
- Chart on Asia - Year-over-year growth 2024-2029 (%)
- Data Table on Asia - Year-over-year growth 2024-2029 (%)
- 11.6 Rest of World (ROW) - Market size and forecast 2024-2029
- Chart on Rest of World (ROW) - Market size and forecast 2024-2029 ($ million)
- Data Table on Rest of World (ROW) - Market size and forecast 2024-2029 ($ million)
- Chart on Rest of World (ROW) - Year-over-year growth 2024-2029 (%)
- Data Table on Rest of World (ROW) - Year-over-year growth 2024-2029 (%)
- 11.7 US - Market size and forecast 2024-2029
- Chart on US - Market size and forecast 2024-2029 ($ million)
- Data Table on US - Market size and forecast 2024-2029 ($ million)
- Chart on US - Year-over-year growth 2024-2029 (%)
- Data Table on US - Year-over-year growth 2024-2029 (%)
- 11.8 China - Market size and forecast 2024-2029
- Chart on China - Market size and forecast 2024-2029 ($ million)
- Data Table on China - Market size and forecast 2024-2029 ($ million)
- Chart on China - Year-over-year growth 2024-2029 (%)
- Data Table on China - Year-over-year growth 2024-2029 (%)
- 11.9 Germany - Market size and forecast 2024-2029
- Chart on Germany - Market size and forecast 2024-2029 ($ million)
- Data Table on Germany - Market size and forecast 2024-2029 ($ million)
- Chart on Germany - Year-over-year growth 2024-2029 (%)
- Data Table on Germany - Year-over-year growth 2024-2029 (%)
- 11.10 Canada - Market size and forecast 2024-2029
- Chart on Canada - Market size and forecast 2024-2029 ($ million)
- Data Table on Canada - Market size and forecast 2024-2029 ($ million)
- Chart on Canada - Year-over-year growth 2024-2029 (%)
- Data Table on Canada - Year-over-year growth 2024-2029 (%)
- 11.11 UK - Market size and forecast 2024-2029
- Chart on UK - Market size and forecast 2024-2029 ($ million)
- Data Table on UK - Market size and forecast 2024-2029 ($ million)
- Chart on UK - Year-over-year growth 2024-2029 (%)
- Data Table on UK - Year-over-year growth 2024-2029 (%)
- 11.12 Japan - Market size and forecast 2024-2029
- Chart on Japan - Market size and forecast 2024-2029 ($ million)
- Data Table on Japan - Market size and forecast 2024-2029 ($ million)
- Chart on Japan - Year-over-year growth 2024-2029 (%)
- Data Table on Japan - Year-over-year growth 2024-2029 (%)
- 11.13 France - Market size and forecast 2024-2029
- Chart on France - Market size and forecast 2024-2029 ($ million)
- Data Table on France - Market size and forecast 2024-2029 ($ million)
- Chart on France - Year-over-year growth 2024-2029 (%)
- Data Table on France - Year-over-year growth 2024-2029 (%)
- 11.14 Brazil - Market size and forecast 2024-2029
- Chart on Brazil - Market size and forecast 2024-2029 ($ million)
- Data Table on Brazil - Market size and forecast 2024-2029 ($ million)
- Chart on Brazil - Year-over-year growth 2024-2029 (%)
- Data Table on Brazil - Year-over-year growth 2024-2029 (%)
- 11.15 UAE - Market size and forecast 2024-2029
- Chart on UAE - Market size and forecast 2024-2029 ($ million)
- Data Table on UAE - Market size and forecast 2024-2029 ($ million)
- Chart on UAE - Year-over-year growth 2024-2029 (%)
- Data Table on UAE - Year-over-year growth 2024-2029 (%)
- 11.16 India - Market size and forecast 2024-2029
- Chart on India - Market size and forecast 2024-2029 ($ million)
- Data Table on India - Market size and forecast 2024-2029 ($ million)
- Chart on India - Year-over-year growth 2024-2029 (%)
- Data Table on India - Year-over-year growth 2024-2029 (%)
- 11.17 Market opportunity By Geographical Landscape
- Market opportunity By Geographical Landscape ($ million)
- Data Tables on Market opportunity By Geographical Landscape ($ million)
12 Drivers, Challenges, and Opportunity/Restraints
- 12.1 Market drivers
- 12.2 Market challenges
- 12.3 Impact of drivers and challenges
- Impact of drivers and challenges in 2024 and 2029
- 12.4 Market opportunities/restraints
13 Competitive Landscape
- 13.1 Overview
- 13.2 Competitive Landscape
- Overview on criticality of inputs and factors of differentiation
- 13.3 Landscape disruption
- Overview on factors of disruption
- 13.4 Industry risks
- Impact of key risks on business
14 Competitive Analysis
- 14.1 Companies profiled
- Companies covered
- 14.2 Company ranking index
- Company ranking index
- 14.3 Market positioning of companies
- Matrix on companies position and classification
- 14.4 Abbott Laboratories
- Abbott Laboratories - Overview
- Abbott Laboratories - Business segments
- Abbott Laboratories - Key news
- Abbott Laboratories - Key offerings
- Abbott Laboratories - Segment focus
- SWOT
- 14.5 Ackermann Instrumente GmbH
- Ackermann Instrumente GmbH - Overview
- Ackermann Instrumente GmbH - Product / Service
- Ackermann Instrumente GmbH - Key offerings
- SWOT
- 14.6 B.Braun SE
- B.Braun SE - Overview
- B.Braun SE - Product / Service
- B.Braun SE - Key news
- B.Braun SE - Key offerings
- SWOT
- 14.7 Boston Scientific Corp.
- Boston Scientific Corp. - Overview
- Boston Scientific Corp. - Business segments
- Boston Scientific Corp. - Key news
- Boston Scientific Corp. - Key offerings
- Boston Scientific Corp. - Segment focus
- SWOT
- 14.8 Changzhou Jiuhong Medical Instrument Co.
- Changzhou Jiuhong Medical Instrument Co. - Overview
- Changzhou Jiuhong Medical Instrument Co. - Product / Service
- Changzhou Jiuhong Medical Instrument Co. - Key offerings
- SWOT
- 14.9 Cook Group Inc.
- Cook Group Inc. - Overview
- Cook Group Inc. - Product / Service
- Cook Group Inc. - Key offerings
- SWOT
- 14.10 Haemonetics Corp.
- Haemonetics Corp. - Overview
- Haemonetics Corp. - Business segments
- Haemonetics Corp. - Key offerings
- Haemonetics Corp. - Segment focus
- SWOT
- 14.11 Johnson and Johnson Inc.
- Johnson and Johnson Inc. - Overview
- Johnson and Johnson Inc. - Business segments
- Johnson and Johnson Inc. - Key news
- Johnson and Johnson Inc. - Key offerings
- Johnson and Johnson Inc. - Segment focus
- SWOT
- 14.12 Medtronic Plc
- Medtronic Plc - Overview
- Medtronic Plc - Business segments
- Medtronic Plc - Key news
- Medtronic Plc - Key offerings
- Medtronic Plc - Segment focus
- SWOT
- 14.13 Micro Tech Nanjing Co. Ltd.
- Micro Tech Nanjing Co. Ltd. - Overview
- Micro Tech Nanjing Co. Ltd. - Product / Service
- Micro Tech Nanjing Co. Ltd. - Key offerings
- SWOT
- 14.14 Olympus Corp.
- Olympus Corp. - Overview
- Olympus Corp. - Business segments
- Olympus Corp. - Key news
- Olympus Corp. - Key offerings
- Olympus Corp. - Segment focus
- SWOT
- 14.15 Ovesco Endoscopy AG
- Ovesco Endoscopy AG - Overview
- Ovesco Endoscopy AG - Product / Service
- Ovesco Endoscopy AG - Key offerings
- SWOT
- 14.16 STERIS plc
- STERIS plc - Overview
- STERIS plc - Business segments
- STERIS plc - Key news
- STERIS plc - Key offerings
- STERIS plc - Segment focus
- SWOT
- 14.17 Teleflex Inc.
- Teleflex Inc. - Overview
- Teleflex Inc. - Business segments
- Teleflex Inc. - Key news
- Teleflex Inc. - Key offerings
- Teleflex Inc. - Segment focus
- SWOT
- 14.18 The Cooper Companies Inc.
- The Cooper Companies Inc. - Overview
- The Cooper Companies Inc. - Business segments
- The Cooper Companies Inc. - Key news
- The Cooper Companies Inc. - Key offerings
- The Cooper Companies Inc. - Segment focus
- SWOT
15 Appendix
- 15.1 Scope of the report
- 15.2 Inclusions and exclusions checklist
- Inclusions checklist
- Exclusions checklist
- 15.3 Currency conversion rates for US$
- Currency conversion rates for US$
- 15.4 Research methodology
- Research methodology
- 15.5 Data procurement
- Information sources
- 15.6 Data validation
- Data validation
- 15.7 Validation techniques employed for market sizing
- Validation techniques employed for market sizing
- 15.8 Data synthesis
- Data synthesis
- 15.9 360 degree market analysis
- 360 degree market analysis
- 15.10 List of abbreviations
- List of abbreviations

