|
|
市場調査レポート
商品コード
1557401
自動車用等速ジョイント(CVJ)の世界市場 2024-2028Global Automotive Constant Velocity Joint (CVJ) Market 2024-2028 |
||||||

|
|||||||
カスタマイズ可能
|
|||||||

| 自動車用等速ジョイント(CVJ)の世界市場 2024-2028 |
|
出版日: 2024年08月13日
発行: TechNavio
ページ情報: 英文 170 Pages
納期: 即納可能
|

全表示
- 概要
- 図表
- 目次
自動車用等速ジョイント(CVJ)市場は2023-2028年に1億4,750万米ドル、予測期間中のCAGRは5.35%と予測されています。
当レポートでは、自動車用等速ジョイント(CVJ)市場の全体的な分析、市場規模・予測、動向、成長促進要因、課題、約25のベンダーを網羅したベンダー分析などを掲載しています。
現在の市場シナリオ、最新動向と促進要因、市場環境全体に関する最新分析を提供しています。市場は、SUVやピックアップトラックの需要拡大、燃費効率への注目の高まり、市場参入企業による研究開発投資の拡大が牽引しています。
| 市場範囲 | |
|---|---|
| 基準年 | 2024 |
| 終了年 | 2028 |
| 予測期間 | 2024-2028 |
| 成長モメンタム | 加速 |
| 前年比2024年 | 4.78% |
| CAGR | 5.35% |
| 増分額 | 1億4,750万米ドル |
本調査では、今後数年間の自動車用等速ジョイント(CVJ)市場の成長を促進する主な要因の1つとして、設計の進歩を挙げています。また、自律走行車の進歩や、CVジョイントブーツの小型化に注力することで、同市場では大きな需要が見込まれます。
目次
第1章 エグゼクティブサマリー
- 市場概要
第2章 市場情勢
- 市場エコシステム
- 市場の特徴
- バリューチェーン分析
第3章 市場規模の評価
- 市場の定義
- 市場セグメント分析
- 市場規模 2023
- 市場の見通し 2023-2028
第4章 市場規模実績
- 自動車用等速ジョイント(CVJ)の世界市場 2018-2022
- 用途別セグメント分析 2018-2022
- エンドユーザー別セグメント分析 2018-2022
- 地域別セグメント分析 2018-2022
- 国別セグメント分析 2018-2022
第5章 ファイブフォース分析
- ファイブフォースの要約
- 買い手の交渉力
- 供給企業の交渉力
- 新規参入業者の脅威
- 代替品の脅威
- 競争の脅威
- 市況
第6章 市場セグメンテーション:用途別
- 市場セグメンテーション
- 比較:用途別
- 乗用車:市場規模と予測 2023-2028
- 商用車:市場規模と予測 2023-2028
- 市場機会:用途別
第7章 市場セグメンテーション:エンドユーザー別
- 市場セグメンテーション
- 比較:エンドユーザー別
- OEM:市場規模と予測 2023-2028
- アフターマーケット:市場規模と予測 2023-2028
- 市場機会:エンドユーザー別
第8章 顧客情勢
- 顧客情勢の概要
第9章 地域別情勢
- 地域別セグメンテーション
- 地域別比較
- アジア太平洋:市場規模と予測 2023-2028
- 欧州:市場規模と予測 2023-2028
- 北米:市場規模と予測 2023-2028
- 南米:市場規模と予測 2023-2028
- 中東・アフリカ:市場規模と予測 2023-2028
- 中国:市場規模と予測 2023-2028
- 米国:市場規模と予測 2023-2028
- 日本:市場規模と予測 2023-2028
- インド:市場規模と予測 2023-2028
- 韓国:市場規模と予測 2023-2028
- 市場機会:地域情勢別
第10章 促進要因・課題・機会・抑制要因
- 市場促進要因
- 市場の課題
- 促進要因と課題の影響
- 市場の機会・抑制要因
第11章 競合情勢
- 概要
- 競合情勢
- 混乱の状況
- 業界のリスク
第12章 競合分析
- 企業プロファイル
- 企業の市場ポジショニング
- AB SKF
- AIKOKU ALPHA
- American Axle and Manufacturing Holdings Inc.
- Comer Industries Spa
- Comline Auto Parts Ltd.
- Dana Inc.
- ECO SHAFT(M)SDN BHD
- GKN Automotive Ltd.
- Hartford Technologies Inc.
- IFA Holding GmbH
- Melrose Industries Plc
- Nexteer Automotive Group Ltd.
- NTN Corp.
- Nuova Tecnodelta Spa
- Taizhou Heri Auto Parts Co. Ltd.
第13章 付録
Exhibits:
- Exhibits1: Executive Summary - Chart on Market Overview
- Exhibits2: Executive Summary - Data Table on Market Overview
- Exhibits3: Executive Summary - Chart on Global Market Characteristics
- Exhibits4: Executive Summary - Chart on Market By Geographical Landscape
- Exhibits5: Executive Summary - Chart on Market Segmentation by Application
- Exhibits6: Executive Summary - Chart on Market Segmentation by End-user
- Exhibits7: Executive Summary - Chart on Incremental Growth
- Exhibits8: Executive Summary - Data Table on Incremental Growth
- Exhibits9: Executive Summary - Chart on Company Market Positioning
- Exhibits10: Parent Market
- Exhibits11: Data Table on - Parent Market
- Exhibits12: Market characteristics analysis
- Exhibits13: Value Chain Analysis
- Exhibits14: Offerings of companies included in the market definition
- Exhibits15: Market segments
- Exhibits16: Chart on Global - Market size and forecast 2023-2028 ($ million)
- Exhibits17: Data Table on Global - Market size and forecast 2023-2028 ($ million)
- Exhibits18: Chart on Global Market: Year-over-year growth 2023-2028 (%)
- Exhibits19: Data Table on Global Market: Year-over-year growth 2023-2028 (%)
- Exhibits20: Historic Market Size - Data Table on Global Automotive Constant Velocity Joint (CVJ) Market 2018 - 2022 ($ million)
- Exhibits21: Historic Market Size - Application Segment 2018 - 2022 ($ million)
- Exhibits22: Historic Market Size - End-user Segment 2018 - 2022 ($ million)
- Exhibits23: Historic Market Size - Geography Segment 2018 - 2022 ($ million)
- Exhibits24: Historic Market Size - Country Segment 2018 - 2022 ($ million)
- Exhibits25: Five forces analysis - Comparison between 2023 and 2028
- Exhibits26: Bargaining power of buyers - Impact of key factors 2023 and 2028
- Exhibits27: Bargaining power of suppliers - Impact of key factors in 2023 and 2028
- Exhibits28: Threat of new entrants - Impact of key factors in 2023 and 2028
- Exhibits29: Threat of substitutes - Impact of key factors in 2023 and 2028
- Exhibits30: Threat of rivalry - Impact of key factors in 2023 and 2028
- Exhibits31: Chart on Market condition - Five forces 2023 and 2028
- Exhibits32: Chart on Application - Market share 2023-2028 (%)
- Exhibits33: Data Table on Application - Market share 2023-2028 (%)
- Exhibits34: Chart on Comparison by Application
- Exhibits35: Data Table on Comparison by Application
- Exhibits36: Chart on Passenger cars - Market size and forecast 2023-2028 ($ million)
- Exhibits37: Data Table on Passenger cars - Market size and forecast 2023-2028 ($ million)
- Exhibits38: Chart on Passenger cars - Year-over-year growth 2023-2028 (%)
- Exhibits39: Data Table on Passenger cars - Year-over-year growth 2023-2028 (%)
- Exhibits40: Chart on Commercial vehicles - Market size and forecast 2023-2028 ($ million)
- Exhibits41: Data Table on Commercial vehicles - Market size and forecast 2023-2028 ($ million)
- Exhibits42: Chart on Commercial vehicles - Year-over-year growth 2023-2028 (%)
- Exhibits43: Data Table on Commercial vehicles - Year-over-year growth 2023-2028 (%)
- Exhibits44: Market opportunity by Application ($ million)
- Exhibits45: Data Table on Market opportunity by Application ($ million)
- Exhibits46: Chart on End-user - Market share 2023-2028 (%)
- Exhibits47: Data Table on End-user - Market share 2023-2028 (%)
- Exhibits48: Chart on Comparison by End-user
- Exhibits49: Data Table on Comparison by End-user
- Exhibits50: Chart on OEMs - Market size and forecast 2023-2028 ($ million)
- Exhibits51: Data Table on OEMs - Market size and forecast 2023-2028 ($ million)
- Exhibits52: Chart on OEMs - Year-over-year growth 2023-2028 (%)
- Exhibits53: Data Table on OEMs - Year-over-year growth 2023-2028 (%)
- Exhibits54: Chart on Aftermarket - Market size and forecast 2023-2028 ($ million)
- Exhibits55: Data Table on Aftermarket - Market size and forecast 2023-2028 ($ million)
- Exhibits56: Chart on Aftermarket - Year-over-year growth 2023-2028 (%)
- Exhibits57: Data Table on Aftermarket - Year-over-year growth 2023-2028 (%)
- Exhibits58: Market opportunity by End-user ($ million)
- Exhibits59: Data Table on Market opportunity by End-user ($ million)
- Exhibits60: Analysis of price sensitivity, lifecycle, customer purchase basket, adoption rates, and purchase criteria
- Exhibits61: Chart on Market share By Geographical Landscape 2023-2028 (%)
- Exhibits62: Data Table on Market share By Geographical Landscape 2023-2028 (%)
- Exhibits63: Chart on Geographic comparison
- Exhibits64: Data Table on Geographic comparison
- Exhibits65: Chart on APAC - Market size and forecast 2023-2028 ($ million)
- Exhibits66: Data Table on APAC - Market size and forecast 2023-2028 ($ million)
- Exhibits67: Chart on APAC - Year-over-year growth 2023-2028 (%)
- Exhibits68: Data Table on APAC - Year-over-year growth 2023-2028 (%)
- Exhibits69: Chart on Europe - Market size and forecast 2023-2028 ($ million)
- Exhibits70: Data Table on Europe - Market size and forecast 2023-2028 ($ million)
- Exhibits71: Chart on Europe - Year-over-year growth 2023-2028 (%)
- Exhibits72: Data Table on Europe - Year-over-year growth 2023-2028 (%)
- Exhibits73: Chart on North America - Market size and forecast 2023-2028 ($ million)
- Exhibits74: Data Table on North America - Market size and forecast 2023-2028 ($ million)
- Exhibits75: Chart on North America - Year-over-year growth 2023-2028 (%)
- Exhibits76: Data Table on North America - Year-over-year growth 2023-2028 (%)
- Exhibits77: Chart on South America - Market size and forecast 2023-2028 ($ million)
- Exhibits78: Data Table on South America - Market size and forecast 2023-2028 ($ million)
- Exhibits79: Chart on South America - Year-over-year growth 2023-2028 (%)
- Exhibits80: Data Table on South America - Year-over-year growth 2023-2028 (%)
- Exhibits81: Chart on Middle East and Africa - Market size and forecast 2023-2028 ($ million)
- Exhibits82: Data Table on Middle East and Africa - Market size and forecast 2023-2028 ($ million)
- Exhibits83: Chart on Middle East and Africa - Year-over-year growth 2023-2028 (%)
- Exhibits84: Data Table on Middle East and Africa - Year-over-year growth 2023-2028 (%)
- Exhibits85: Chart on China - Market size and forecast 2023-2028 ($ million)
- Exhibits86: Data Table on China - Market size and forecast 2023-2028 ($ million)
- Exhibits87: Chart on China - Year-over-year growth 2023-2028 (%)
- Exhibits88: Data Table on China - Year-over-year growth 2023-2028 (%)
- Exhibits89: Chart on US - Market size and forecast 2023-2028 ($ million)
- Exhibits90: Data Table on US - Market size and forecast 2023-2028 ($ million)
- Exhibits91: Chart on US - Year-over-year growth 2023-2028 (%)
- Exhibits92: Data Table on US - Year-over-year growth 2023-2028 (%)
- Exhibits93: Chart on Japan - Market size and forecast 2023-2028 ($ million)
- Exhibits94: Data Table on Japan - Market size and forecast 2023-2028 ($ million)
- Exhibits95: Chart on Japan - Year-over-year growth 2023-2028 (%)
- Exhibits96: Data Table on Japan - Year-over-year growth 2023-2028 (%)
- Exhibits97: Chart on India - Market size and forecast 2023-2028 ($ million)
- Exhibits98: Data Table on India - Market size and forecast 2023-2028 ($ million)
- Exhibits99: Chart on India - Year-over-year growth 2023-2028 (%)
- Exhibits100: Data Table on India - Year-over-year growth 2023-2028 (%)
- Exhibits101: Chart on South Korea - Market size and forecast 2023-2028 ($ million)
- Exhibits102: Data Table on South Korea - Market size and forecast 2023-2028 ($ million)
- Exhibits103: Chart on South Korea - Year-over-year growth 2023-2028 (%)
- Exhibits104: Data Table on South Korea - Year-over-year growth 2023-2028 (%)
- Exhibits105: Market opportunity By Geographical Landscape ($ million)
- Exhibits106: Data Tables on Market opportunity By Geographical Landscape ($ million)
- Exhibits107: Impact of drivers and challenges in 2023 and 2028
- Exhibits108: Overview on criticality of inputs and factors of differentiation
- Exhibits109: Overview on factors of disruption
- Exhibits110: Impact of key risks on business
- Exhibits111: Companies covered
- Exhibits112: Matrix on companies position and classification
- Exhibits113: AB SKF - Overview
- Exhibits114: AB SKF - Business segments
- Exhibits115: AB SKF - Key news
- Exhibits116: AB SKF - Key offerings
- Exhibits117: AB SKF - Segment focus
- Exhibits118: AIKOKU ALPHA - Overview
- Exhibits119: AIKOKU ALPHA - Product / Service
- Exhibits120: AIKOKU ALPHA - Key offerings
- Exhibits121: American Axle and Manufacturing Holdings Inc. - Overview
- Exhibits122: American Axle and Manufacturing Holdings Inc. - Business segments
- Exhibits123: American Axle and Manufacturing Holdings Inc. - Key news
- Exhibits124: American Axle and Manufacturing Holdings Inc. - Key offerings
- Exhibits125: American Axle and Manufacturing Holdings Inc. - Segment focus
- Exhibits126: Comer Industries Spa - Overview
- Exhibits127: Comer Industries Spa - Product / Service
- Exhibits128: Comer Industries Spa - Key offerings
- Exhibits129: Comline Auto Parts Ltd. - Overview
- Exhibits130: Comline Auto Parts Ltd. - Product / Service
- Exhibits131: Comline Auto Parts Ltd. - Key offerings
- Exhibits132: Dana Inc. - Overview
- Exhibits133: Dana Inc. - Business segments
- Exhibits134: Dana Inc. - Key news
- Exhibits135: Dana Inc. - Key offerings
- Exhibits136: Dana Inc. - Segment focus
- Exhibits137: ECO SHAFT (M) SDN BHD - Overview
- Exhibits138: ECO SHAFT (M) SDN BHD - Product / Service
- Exhibits139: ECO SHAFT (M) SDN BHD - Key offerings
- Exhibits140: GKN Automotive Ltd. - Overview
- Exhibits141: GKN Automotive Ltd. - Product / Service
- Exhibits142: GKN Automotive Ltd. - Key news
- Exhibits143: GKN Automotive Ltd. - Key offerings
- Exhibits144: Hartford Technologies Inc. - Overview
- Exhibits145: Hartford Technologies Inc. - Product / Service
- Exhibits146: Hartford Technologies Inc. - Key offerings
- Exhibits147: IFA Holding GmbH - Overview
- Exhibits148: IFA Holding GmbH - Product / Service
- Exhibits149: IFA Holding GmbH - Key offerings
- Exhibits150: Melrose Industries Plc - Overview
- Exhibits151: Melrose Industries Plc - Business segments
- Exhibits152: Melrose Industries Plc - Key offerings
- Exhibits153: Melrose Industries Plc - Segment focus
- Exhibits154: Nexteer Automotive Group Ltd. - Overview
- Exhibits155: Nexteer Automotive Group Ltd. - Business segments
- Exhibits156: Nexteer Automotive Group Ltd. - Key offerings
- Exhibits157: Nexteer Automotive Group Ltd. - Segment focus
- Exhibits158: NTN Corp. - Overview
- Exhibits159: NTN Corp. - Business segments
- Exhibits160: NTN Corp. - Key offerings
- Exhibits161: NTN Corp. - Segment focus
- Exhibits162: Nuova Tecnodelta Spa - Overview
- Exhibits163: Nuova Tecnodelta Spa - Product / Service
- Exhibits164: Nuova Tecnodelta Spa - Key offerings
- Exhibits165: Taizhou Heri Auto Parts Co. Ltd. - Overview
- Exhibits166: Taizhou Heri Auto Parts Co. Ltd. - Product / Service
- Exhibits167: Taizhou Heri Auto Parts Co. Ltd. - Key offerings
- Exhibits168: Inclusions checklist
- Exhibits169: Exclusions checklist
- Exhibits170: Currency conversion rates for US$
- Exhibits171: Research methodology
- Exhibits172: Information sources
- Exhibits173: Data validation
- Exhibits174: Validation techniques employed for market sizing
- Exhibits175: Data synthesis
- Exhibits176: 360 degree market analysis
- Exhibits177: List of abbreviations
The automotive constant velocity joint (cvj) market is forecasted to grow by USD 147.5 mn during 2023-2028, accelerating at a CAGR of 5.35% during the forecast period. The report on the automotive constant velocity joint (cvj) market provides a holistic analysis, market size and forecast, trends, growth drivers, and challenges, as well as vendor analysis covering around 25 vendors.
The report offers an up-to-date analysis regarding the current market scenario, the latest trends and drivers, and the overall market environment. The market is driven by growing demand for suvs and pickup trucks, increasing focus on fuel efficiency, and growing investments in research and development by market players.
Technavio's automotive constant velocity joint (cvj) market is segmented as below:
| Market Scope | |
|---|---|
| Base Year | 2024 |
| End Year | 2028 |
| Series Year | 2024-2028 |
| Growth Momentum | Accelerate |
| YOY 2024 | 4.78% |
| CAGR | 5.35% |
| Incremental Value | $147.5 mn |
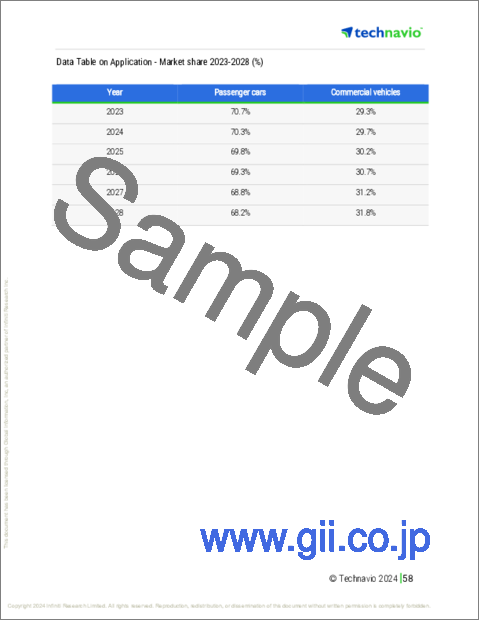
By Application
- Passenger cars
- Commercial vehicles
By End-user
- OEMs
- Aftermarket
By Geographical Landscape
- APAC
- Europe
- North America
- South America
- Middle East and Africa
This study identifies the advancements in design as one of the prime reasons driving the automotive constant velocity joint (cvj) market growth during the next few years. Also, advances in autonomous vehicles and focus on decrease in size of cv joint boots will lead to sizable demand in the market.
The report on the automotive constant velocity joint (cvj) market covers the following areas:
- Automotive constant velocity joint (cvj) market sizing
- Automotive constant velocity joint (cvj) market forecast
- Automotive constant velocity joint (cvj) market industry analysis
The robust vendor analysis is designed to help clients improve their market position, and in line with this, this report provides a detailed analysis of several leading automotive constant velocity joint (cvj) market vendors that include AB SKF, AIKOKU ALPHA, American Axle and Manufacturing Holdings Inc., Comer Industries Spa, Comline Auto Parts Ltd., Cummins Inc., Dana Inc., ECO SHAFT (M) SDN BHD, GKN Automotive Ltd., GSP Automotive Group Wenzhou Co. Ltd., Hartford Technologies Inc., Hyundai Motor Group, IFA Holding GmbH, JTEKT Corp., Melrose Industries Plc, Nexteer Automotive Group Ltd., NTN Corp., Nuova Tecnodelta Spa, Taizhou Heri Auto Parts Co. Ltd., and United Components Inc.. Also, the automotive constant velocity joint (cvj) market analysis report includes information on upcoming trends and challenges that will influence market growth. This is to help companies strategize and leverage all forthcoming growth opportunities.
The study was conducted using an objective combination of primary and secondary information including inputs from key participants in the industry. The report contains a comprehensive market and vendor landscape in addition to an analysis of the key vendors.
The publisher presents a detailed picture of the market by the way of study, synthesis, and summation of data from multiple sources by an analysis of key parameters such as profit, pricing, competition, and promotions. It presents various market facets by identifying the key industry influencers. The data presented is comprehensive, reliable, and a result of extensive research - both primary and secondary. The market research reports provide a complete competitive landscape and an in-depth vendor selection methodology and analysis using qualitative and quantitative research to forecast the accurate market growth.
Table of Contents
1 Executive Summary
- 1.1 Market overview
- Executive Summary - Chart on Market Overview
- Executive Summary - Data Table on Market Overview
- Executive Summary - Chart on Global Market Characteristics
- Executive Summary - Chart on Market By Geographical Landscape
- Executive Summary - Chart on Market Segmentation by Application
- Executive Summary - Chart on Market Segmentation by End-user
- Executive Summary - Chart on Incremental Growth
- Executive Summary - Data Table on Incremental Growth
- Executive Summary - Chart on Company Market Positioning
2 Market Landscape
- 2.1 Market ecosystem
- Parent Market
- Data Table on - Parent Market
- 2.2 Market characteristics
- Market characteristics analysis
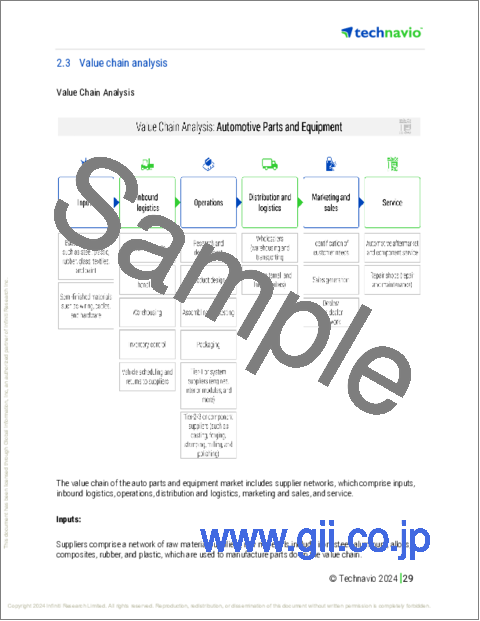
- 2.3 Value chain analysis
- Value Chain Analysis
3 Market Sizing
- 3.1 Market definition
- Offerings of companies included in the market definition
- 3.2 Market segment analysis
- Market segments
- 3.3 Market size 2023
- 3.4 Market outlook: Forecast for 2023-2028
- Chart on Global - Market size and forecast 2023-2028 ($ million)
- Data Table on Global - Market size and forecast 2023-2028 ($ million)
- Chart on Global Market: Year-over-year growth 2023-2028 (%)
- Data Table on Global Market: Year-over-year growth 2023-2028 (%)
4 Historic Market Size
- 4.1 Global Automotive Constant Velocity Joint (CVJ) Market 2018 - 2022
- Historic Market Size - Data Table on Global Automotive Constant Velocity Joint (CVJ) Market 2018 - 2022 ($ million)
- 4.2 Application segment analysis 2018 - 2022
- Historic Market Size - Application Segment 2018 - 2022 ($ million)
- 4.3 End-user segment analysis 2018 - 2022
- Historic Market Size - End-user Segment 2018 - 2022 ($ million)
- 4.4 Geography segment analysis 2018 - 2022
- Historic Market Size - Geography Segment 2018 - 2022 ($ million)
- 4.5 Country segment analysis 2018 - 2022
- Historic Market Size - Country Segment 2018 - 2022 ($ million)
5 Five Forces Analysis
- 5.1 Five forces summary
- Five forces analysis - Comparison between 2023 and 2028
- 5.2 Bargaining power of buyers
- Bargaining power of buyers - Impact of key factors 2023 and 2028
- 5.3 Bargaining power of suppliers
- Bargaining power of suppliers - Impact of key factors in 2023 and 2028
- 5.4 Threat of new entrants
- Threat of new entrants - Impact of key factors in 2023 and 2028
- 5.5 Threat of substitutes
- Threat of substitutes - Impact of key factors in 2023 and 2028
- 5.6 Threat of rivalry
- Threat of rivalry - Impact of key factors in 2023 and 2028
- 5.7 Market condition
- Chart on Market condition - Five forces 2023 and 2028
6 Market Segmentation by Application
- 6.1 Market segments
- Chart on Application - Market share 2023-2028 (%)
- Data Table on Application - Market share 2023-2028 (%)
- 6.2 Comparison by Application
- Chart on Comparison by Application
- Data Table on Comparison by Application
- 6.3 Passenger cars - Market size and forecast 2023-2028
- Chart on Passenger cars - Market size and forecast 2023-2028 ($ million)
- Data Table on Passenger cars - Market size and forecast 2023-2028 ($ million)
- Chart on Passenger cars - Year-over-year growth 2023-2028 (%)
- Data Table on Passenger cars - Year-over-year growth 2023-2028 (%)
- 6.4 Commercial vehicles - Market size and forecast 2023-2028
- Chart on Commercial vehicles - Market size and forecast 2023-2028 ($ million)
- Data Table on Commercial vehicles - Market size and forecast 2023-2028 ($ million)
- Chart on Commercial vehicles - Year-over-year growth 2023-2028 (%)
- Data Table on Commercial vehicles - Year-over-year growth 2023-2028 (%)
- 6.5 Market opportunity by Application
- Market opportunity by Application ($ million)
- Data Table on Market opportunity by Application ($ million)
7 Market Segmentation by End-user
- 7.1 Market segments
- Chart on End-user - Market share 2023-2028 (%)
- Data Table on End-user - Market share 2023-2028 (%)
- 7.2 Comparison by End-user
- Chart on Comparison by End-user
- Data Table on Comparison by End-user
- 7.3 OEMs - Market size and forecast 2023-2028
- Chart on OEMs - Market size and forecast 2023-2028 ($ million)
- Data Table on OEMs - Market size and forecast 2023-2028 ($ million)
- Chart on OEMs - Year-over-year growth 2023-2028 (%)
- Data Table on OEMs - Year-over-year growth 2023-2028 (%)
- 7.4 Aftermarket - Market size and forecast 2023-2028
- Chart on Aftermarket - Market size and forecast 2023-2028 ($ million)
- Data Table on Aftermarket - Market size and forecast 2023-2028 ($ million)
- Chart on Aftermarket - Year-over-year growth 2023-2028 (%)
- Data Table on Aftermarket - Year-over-year growth 2023-2028 (%)
- 7.5 Market opportunity by End-user
- Market opportunity by End-user ($ million)
- Data Table on Market opportunity by End-user ($ million)
8 Customer Landscape
- 8.1 Customer landscape overview
- Analysis of price sensitivity, lifecycle, customer purchase basket, adoption rates, and purchase criteria
9 Geographic Landscape
- 9.1 Geographic segmentation
- Chart on Market share By Geographical Landscape 2023-2028 (%)
- Data Table on Market share By Geographical Landscape 2023-2028 (%)
- 9.2 Geographic comparison
- Chart on Geographic comparison
- Data Table on Geographic comparison
- 9.3 APAC - Market size and forecast 2023-2028
- Chart on APAC - Market size and forecast 2023-2028 ($ million)
- Data Table on APAC - Market size and forecast 2023-2028 ($ million)
- Chart on APAC - Year-over-year growth 2023-2028 (%)
- Data Table on APAC - Year-over-year growth 2023-2028 (%)
- 9.4 Europe - Market size and forecast 2023-2028
- Chart on Europe - Market size and forecast 2023-2028 ($ million)
- Data Table on Europe - Market size and forecast 2023-2028 ($ million)
- Chart on Europe - Year-over-year growth 2023-2028 (%)
- Data Table on Europe - Year-over-year growth 2023-2028 (%)
- 9.5 North America - Market size and forecast 2023-2028
- Chart on North America - Market size and forecast 2023-2028 ($ million)
- Data Table on North America - Market size and forecast 2023-2028 ($ million)
- Chart on North America - Year-over-year growth 2023-2028 (%)
- Data Table on North America - Year-over-year growth 2023-2028 (%)
- 9.6 South America - Market size and forecast 2023-2028
- Chart on South America - Market size and forecast 2023-2028 ($ million)
- Data Table on South America - Market size and forecast 2023-2028 ($ million)
- Chart on South America - Year-over-year growth 2023-2028 (%)
- Data Table on South America - Year-over-year growth 2023-2028 (%)
- 9.7 Middle East and Africa - Market size and forecast 2023-2028
- Chart on Middle East and Africa - Market size and forecast 2023-2028 ($ million)
- Data Table on Middle East and Africa - Market size and forecast 2023-2028 ($ million)
- Chart on Middle East and Africa - Year-over-year growth 2023-2028 (%)
- Data Table on Middle East and Africa - Year-over-year growth 2023-2028 (%)
- 9.8 China - Market size and forecast 2023-2028
- Chart on China - Market size and forecast 2023-2028 ($ million)
- Data Table on China - Market size and forecast 2023-2028 ($ million)
- Chart on China - Year-over-year growth 2023-2028 (%)
- Data Table on China - Year-over-year growth 2023-2028 (%)
- 9.9 US - Market size and forecast 2023-2028
- Chart on US - Market size and forecast 2023-2028 ($ million)
- Data Table on US - Market size and forecast 2023-2028 ($ million)
- Chart on US - Year-over-year growth 2023-2028 (%)
- Data Table on US - Year-over-year growth 2023-2028 (%)
- 9.10 Japan - Market size and forecast 2023-2028
- Chart on Japan - Market size and forecast 2023-2028 ($ million)
- Data Table on Japan - Market size and forecast 2023-2028 ($ million)
- Chart on Japan - Year-over-year growth 2023-2028 (%)
- Data Table on Japan - Year-over-year growth 2023-2028 (%)
- 9.11 India - Market size and forecast 2023-2028
- Chart on India - Market size and forecast 2023-2028 ($ million)
- Data Table on India - Market size and forecast 2023-2028 ($ million)
- Chart on India - Year-over-year growth 2023-2028 (%)
- Data Table on India - Year-over-year growth 2023-2028 (%)
- 9.12 South Korea - Market size and forecast 2023-2028
- Chart on South Korea - Market size and forecast 2023-2028 ($ million)
- Data Table on South Korea - Market size and forecast 2023-2028 ($ million)
- Chart on South Korea - Year-over-year growth 2023-2028 (%)
- Data Table on South Korea - Year-over-year growth 2023-2028 (%)
- 9.13 Market opportunity By Geographical Landscape
- Market opportunity By Geographical Landscape ($ million)
- Data Tables on Market opportunity By Geographical Landscape ($ million)
10 Drivers, Challenges, and Opportunity/Restraints
- 10.1 Market drivers
- 10.2 Market challenges
- 10.3 Impact of drivers and challenges
- Impact of drivers and challenges in 2023 and 2028
- 10.4 Market opportunities/restraints
11 Competitive Landscape
- 11.1 Overview
- 11.2 Competitive Landscape
- Overview on criticality of inputs and factors of differentiation
- 11.3 Landscape disruption
- Overview on factors of disruption
- 11.4 Industry risks
- Impact of key risks on business
12 Competitive Analysis
- 12.1 Companies profiled
- Companies covered
- 12.2 Market positioning of companies
- Matrix on companies position and classification
- 12.3 AB SKF
- AB SKF - Overview
- AB SKF - Business segments
- AB SKF - Key news
- AB SKF - Key offerings
- AB SKF - Segment focus
- 12.4 AIKOKU ALPHA
- AIKOKU ALPHA - Overview
- AIKOKU ALPHA - Product / Service
- AIKOKU ALPHA - Key offerings
- 12.5 American Axle and Manufacturing Holdings Inc.
- American Axle and Manufacturing Holdings Inc. - Overview
- American Axle and Manufacturing Holdings Inc. - Business segments
- American Axle and Manufacturing Holdings Inc. - Key news
- American Axle and Manufacturing Holdings Inc. - Key offerings
- American Axle and Manufacturing Holdings Inc. - Segment focus
- 12.6 Comer Industries Spa
- Comer Industries Spa - Overview
- Comer Industries Spa - Product / Service
- Comer Industries Spa - Key offerings
- 12.7 Comline Auto Parts Ltd.
- Comline Auto Parts Ltd. - Overview
- Comline Auto Parts Ltd. - Product / Service
- Comline Auto Parts Ltd. - Key offerings
- 12.8 Dana Inc.
- Dana Inc. - Overview
- Dana Inc. - Business segments
- Dana Inc. - Key news
- Dana Inc. - Key offerings
- Dana Inc. - Segment focus
- 12.9 ECO SHAFT (M) SDN BHD
- ECO SHAFT (M) SDN BHD - Overview
- ECO SHAFT (M) SDN BHD - Product / Service
- ECO SHAFT (M) SDN BHD - Key offerings
- 12.10 GKN Automotive Ltd.
- GKN Automotive Ltd. - Overview
- GKN Automotive Ltd. - Product / Service
- GKN Automotive Ltd. - Key news
- GKN Automotive Ltd. - Key offerings
- 12.11 Hartford Technologies Inc.
- Hartford Technologies Inc. - Overview
- Hartford Technologies Inc. - Product / Service
- Hartford Technologies Inc. - Key offerings
- 12.12 IFA Holding GmbH
- IFA Holding GmbH - Overview
- IFA Holding GmbH - Product / Service
- IFA Holding GmbH - Key offerings
- 12.13 Melrose Industries Plc
- Melrose Industries Plc - Overview
- Melrose Industries Plc - Business segments
- Melrose Industries Plc - Key offerings
- Melrose Industries Plc - Segment focus
- 12.14 Nexteer Automotive Group Ltd.
- Nexteer Automotive Group Ltd. - Overview
- Nexteer Automotive Group Ltd. - Business segments
- Nexteer Automotive Group Ltd. - Key offerings
- Nexteer Automotive Group Ltd. - Segment focus
- 12.15 NTN Corp.
- NTN Corp. - Overview
- NTN Corp. - Business segments
- NTN Corp. - Key offerings
- NTN Corp. - Segment focus
- 12.16 Nuova Tecnodelta Spa
- Nuova Tecnodelta Spa - Overview
- Nuova Tecnodelta Spa - Product / Service
- Nuova Tecnodelta Spa - Key offerings
- 12.17 Taizhou Heri Auto Parts Co. Ltd.
- Taizhou Heri Auto Parts Co. Ltd. - Overview
- Taizhou Heri Auto Parts Co. Ltd. - Product / Service
- Taizhou Heri Auto Parts Co. Ltd. - Key offerings
13 Appendix
- 13.1 Scope of the report
- 13.2 Inclusions and exclusions checklist
- Inclusions checklist
- Exclusions checklist
- 13.3 Currency conversion rates for US$
- Currency conversion rates for US$
- 13.4 Research methodology
- Research methodology
- 13.5 Data procurement
- Information sources
- 13.6 Data validation
- Data validation
- 13.7 Validation techniques employed for market sizing
- Validation techniques employed for market sizing
- 13.8 Data synthesis
- Data synthesis
- 360 degree market analysis
- 360 degree market analysis
- 13.10 List of abbreviations
- List of abbreviations
