|
|
市場調査レポート
商品コード
1501974
産業用食品・飲料ろ過システムの世界市場 2024-2028Global industrial food and beverage filtration systems market 2024-2028 |
||||||
|
|||||||
カスタマイズ可能
|
|||||||

| 産業用食品・飲料ろ過システムの世界市場 2024-2028 |
|
出版日: 2024年05月22日
発行: TechNavio
ページ情報: 英文 171 Pages
納期: 即納可能
|

全表示
- 概要
- 図表
- 目次
産業用食品・飲料ろ過システム市場2024-2028
産業用食品・飲料ろ過システム市場は2023-2028年に29億3,990万米ドル、予測期間中のCAGRは13.83%で成長すると予測されます。当レポートでは、産業用食品・飲料ろ過システム市場の全体的な分析、市場規模・予測、動向、成長促進要因、課題、約25のベンダーを網羅したベンダー分析などを掲載しています。
現在の市場シナリオ、最新動向と促進要因、市場環境全体に関する最新分析を提供しています。食品汚染防止への関心の高まり、飲食品用ろ過システムの幅広い用途、高効率フィルターの市場開拓が市場を牽引しています。
| 市場範囲 | |
|---|---|
| 基準年 | 2024 |
| 終了年 | 2028 |
| 予測期間 | 2024-2028 |
| 成長モメンタム | 加速 |
| 前年比2024年 | 11.87% |
| CAGR | 13.83% |
| 増分額 | 29億3,990万米ドル |
本調査では、今後数年間の産業用食品・飲料ろ過システム市場成長を牽引する主要因の1つとして、新しい飲食品ろ過システムのイントロダクションを挙げています。また、エネルギー効率の高いろ過システムの利用可能性と製品リコールは、市場の大規模な需要につながります。
目次
第1章 エグゼクティブサマリー
- 市場概要
第2章 市場情勢
- 市場エコシステム
- 市場の特徴
- バリューチェーン分析
第3章 市場規模の評価
- 市場の定義
- 市場セグメント分析
- 市場規模 2023
- 市場の見通し 2023-2028
第4章 市場規模実績
- 世界の産業用食品・飲料ろ過システム市場 2018-2022
- 製品別セグメント分析 2018-2022
- 用途別セグメント分析 2018-2022
- 地域別セグメント分析 2018-2022
- 国別セグメント分析 2018-2022
第5章 ファイブフォース分析
- ファイブフォースの要約
- 買い手の交渉力
- 供給企業の交渉力
- 新規参入業者の脅威
- 代替品の脅威
- 競争の脅威
- 市況
第6章 市場セグメンテーション:製品別
- 市場セグメンテーション
- 比較:製品別
- 液体ろ過システム:市場規模と予測 2023-2028
- 空気濾過システム:市場規模と予測 2023-2028
- 市場機会:製品別
第7章 市場セグメンテーション:用途別
- 市場セグメンテーション
- 比較:用途別
- 飲料:市場規模と予測 2023-2028
- 乳製品:市場規模と予測 2023-2028
- 食品と材料:市場規模と予測 2023-2028
- 市場機会:用途別
第8章 顧客情勢
- 顧客情勢の概要
第9章 地域別情勢
- 地域別セグメンテーション
- 地域別比較
- 欧州:市場規模と予測 2023-2028
- アジア太平洋:市場規模と予測 2023-2028
- 北米:市場規模と予測 2023-2028
- 南米:市場規模と予測 2023-2028
- 中東・アフリカ:市場規模と予測 2023-2028
- 米国:市場規模と予測 2023-2028
- 中国:市場規模と予測 2023-2028
- ドイツ:市場規模と予測 2023-2028
- フランス:市場規模と予測 2023-2028
- インド:市場規模と予測 2023-2028
- 市場機会:地域別
第10章 促進要因・課題・機会・抑制要因
- 市場促進要因
- 市場の課題
- 促進要因と課題の影響
- 市場の機会・抑制要因
第11章 競合情勢
- 概要
- 競合情勢
- 混乱の状況
- 業界のリスク
第12章 競合分析
- 企業プロファイル
- 企業の市場ポジショニング
- Albert Handtmann Holding GmbH and Co. KG
- Alfa Laval AB
- American Air Filter Co. Inc.
- Critical Process Filtration Inc.
- Donaldson Co. Inc.
- Eaton Corp. Plc
- Filter Concept Pvt. Ltd.
- Freudenberg and Co. KG
- GEA Group AG
- Graver Technologies LLC
- Krones AG
- MORI TEM srl
- Parker Hannifin Corp.
- Schenck Process Holding GmbH
第13章 付録
Exhibits:
- Exhibits1: Executive Summary - Chart on Market Overview
- Exhibits2: Executive Summary - Data Table on Market Overview
- Exhibits3: Executive Summary - Chart on Global Market Characteristics
- Exhibits4: Executive Summary - Chart on Market by Geography
- Exhibits5: Executive Summary - Chart on Market Segmentation by Product
- Exhibits6: Executive Summary - Chart on Market Segmentation by Application
- Exhibits7: Executive Summary - Chart on Incremental Growth
- Exhibits8: Executive Summary - Data Table on Incremental Growth
- Exhibits9: Executive Summary - Chart on Company Market Positioning
- Exhibits10: Parent Market
- Exhibits11: Data Table on - Parent Market
- Exhibits12: Market characteristics analysis
- Exhibits13: Value Chain Analysis
- Exhibits14: Offerings of companies included in the market definition
- Exhibits15: Market segments
- Exhibits16: Chart on Global - Market size and forecast 2023-2028 ($ million)
- Exhibits17: Data Table on Global - Market size and forecast 2023-2028 ($ million)
- Exhibits18: Chart on Global Market: Year-over-year growth 2023-2028 (%)
- Exhibits19: Data Table on Global Market: Year-over-year growth 2023-2028 (%)
- Exhibits20: Historic Market Size - Data Table on Global Industrial Food And Beverage Filtration Systems Market 2018 - 2022 ($ million)
- Exhibits21: Historic Market Size - Product Segment 2018 - 2022 ($ million)
- Exhibits22: Historic Market Size - Application Segment 2018 - 2022 ($ million)
- Exhibits23: Historic Market Size - Geography Segment 2018 - 2022 ($ million)
- Exhibits24: Historic Market Size - Country Segment 2018 - 2022 ($ million)
- Exhibits25: Five forces analysis - Comparison between 2023 and 2028
- Exhibits26: Bargaining power of buyers - Impact of key factors 2023 and 2028
- Exhibits27: Bargaining power of suppliers - Impact of key factors in 2023 and 2028
- Exhibits28: Threat of new entrants - Impact of key factors in 2023 and 2028
- Exhibits29: Threat of substitutes - Impact of key factors in 2023 and 2028
- Exhibits30: Threat of rivalry - Impact of key factors in 2023 and 2028
- Exhibits31: Chart on Market condition - Five forces 2023 and 2028
- Exhibits32: Chart on Product - Market share 2023-2028 (%)
- Exhibits33: Data Table on Product - Market share 2023-2028 (%)
- Exhibits34: Chart on Comparison by Product
- Exhibits35: Data Table on Comparison by Product
- Exhibits36: Chart on Liquid filtration systems - Market size and forecast 2023-2028 ($ million)
- Exhibits37: Data Table on Liquid filtration systems - Market size and forecast 2023-2028 ($ million)
- Exhibits38: Chart on Liquid filtration systems - Year-over-year growth 2023-2028 (%)
- Exhibits39: Data Table on Liquid filtration systems - Year-over-year growth 2023-2028 (%)
- Exhibits40: Chart on Air filtration systems - Market size and forecast 2023-2028 ($ million)
- Exhibits41: Data Table on Air filtration systems - Market size and forecast 2023-2028 ($ million)
- Exhibits42: Chart on Air filtration systems - Year-over-year growth 2023-2028 (%)
- Exhibits43: Data Table on Air filtration systems - Year-over-year growth 2023-2028 (%)
- Exhibits44: Market opportunity by Product ($ million)
- Exhibits45: Data Table on Market opportunity by Product ($ million)
- Exhibits46: Chart on Application - Market share 2023-2028 (%)
- Exhibits47: Data Table on Application - Market share 2023-2028 (%)
- Exhibits48: Chart on Comparison by Application
- Exhibits49: Data Table on Comparison by Application
- Exhibits50: Chart on Beverages - Market size and forecast 2023-2028 ($ million)
- Exhibits51: Data Table on Beverages - Market size and forecast 2023-2028 ($ million)
- Exhibits52: Chart on Beverages - Year-over-year growth 2023-2028 (%)
- Exhibits53: Data Table on Beverages - Year-over-year growth 2023-2028 (%)
- Exhibits54: Chart on Dairy - Market size and forecast 2023-2028 ($ million)
- Exhibits55: Data Table on Dairy - Market size and forecast 2023-2028 ($ million)
- Exhibits56: Chart on Dairy - Year-over-year growth 2023-2028 (%)
- Exhibits57: Data Table on Dairy - Year-over-year growth 2023-2028 (%)
- Exhibits58: Chart on Food and ingredients - Market size and forecast 2023-2028 ($ million)
- Exhibits59: Data Table on Food and ingredients - Market size and forecast 2023-2028 ($ million)
- Exhibits60: Chart on Food and ingredients - Year-over-year growth 2023-2028 (%)
- Exhibits61: Data Table on Food and ingredients - Year-over-year growth 2023-2028 (%)
- Exhibits62: Market opportunity by Application ($ million)
- Exhibits63: Data Table on Market opportunity by Application ($ million)
- Exhibits64: Analysis of price sensitivity, lifecycle, customer purchase basket, adoption rates, and purchase criteria
- Exhibits65: Chart on Market share By Geographical Landscape2023-2028 (%)
- Exhibits66: Data Table on Market share By Geographical Landscape2023-2028 (%)
- Exhibits67: Chart on Geographic comparison
- Exhibits68: Data Table on Geographic comparison
- Exhibits69: Chart on Europe - Market size and forecast 2023-2028 ($ million)
- Exhibits70: Data Table on Europe - Market size and forecast 2023-2028 ($ million)
- Exhibits71: Chart on Europe - Year-over-year growth 2023-2028 (%)
- Exhibits72: Data Table on Europe - Year-over-year growth 2023-2028 (%)
- Exhibits73: Chart on APAC - Market size and forecast 2023-2028 ($ million)
- Exhibits74: Data Table on APAC - Market size and forecast 2023-2028 ($ million)
- Exhibits75: Chart on APAC - Year-over-year growth 2023-2028 (%)
- Exhibits76: Data Table on APAC - Year-over-year growth 2023-2028 (%)
- Exhibits77: Chart on North America - Market size and forecast 2023-2028 ($ million)
- Exhibits78: Data Table on North America - Market size and forecast 2023-2028 ($ million)
- Exhibits79: Chart on North America - Year-over-year growth 2023-2028 (%)
- Exhibits80: Data Table on North America - Year-over-year growth 2023-2028 (%)
- Exhibits81: Chart on South America - Market size and forecast 2023-2028 ($ million)
- Exhibits82: Data Table on South America - Market size and forecast 2023-2028 ($ million)
- Exhibits83: Chart on South America - Year-over-year growth 2023-2028 (%)
- Exhibits84: Data Table on South America - Year-over-year growth 2023-2028 (%)
- Exhibits85: Chart on Middle East and Africa - Market size and forecast 2023-2028 ($ million)
- Exhibits86: Data Table on Middle East and Africa - Market size and forecast 2023-2028 ($ million)
- Exhibits87: Chart on Middle East and Africa - Year-over-year growth 2023-2028 (%)
- Exhibits88: Data Table on Middle East and Africa - Year-over-year growth 2023-2028 (%)
- Exhibits89: Chart on US - Market size and forecast 2023-2028 ($ million)
- Exhibits90: Data Table on US - Market size and forecast 2023-2028 ($ million)
- Exhibits91: Chart on US - Year-over-year growth 2023-2028 (%)
- Exhibits92: Data Table on US - Year-over-year growth 2023-2028 (%)
- Exhibits93: Chart on China - Market size and forecast 2023-2028 ($ million)
- Exhibits94: Data Table on China - Market size and forecast 2023-2028 ($ million)
- Exhibits95: Chart on China - Year-over-year growth 2023-2028 (%)
- Exhibits96: Data Table on China - Year-over-year growth 2023-2028 (%)
- Exhibits97: Chart on Germany - Market size and forecast 2023-2028 ($ million)
- Exhibits98: Data Table on Germany - Market size and forecast 2023-2028 ($ million)
- Exhibits99: Chart on Germany - Year-over-year growth 2023-2028 (%)
- Exhibits100: Data Table on Germany - Year-over-year growth 2023-2028 (%)
- Exhibits101: Chart on France - Market size and forecast 2023-2028 ($ million)
- Exhibits102: Data Table on France - Market size and forecast 2023-2028 ($ million)
- Exhibits103: Chart on France - Year-over-year growth 2023-2028 (%)
- Exhibits104: Data Table on France - Year-over-year growth 2023-2028 (%)
- Exhibits105: Chart on India - Market size and forecast 2023-2028 ($ million)
- Exhibits106: Data Table on India - Market size and forecast 2023-2028 ($ million)
- Exhibits107: Chart on India - Year-over-year growth 2023-2028 (%)
- Exhibits108: Data Table on India - Year-over-year growth 2023-2028 (%)
- Exhibits109: Market opportunity By Geographical Landscape($ million)
- Exhibits110: Data Tables on Market opportunity By Geographical Landscape($ million)
- Exhibits111: Impact of drivers and challenges in 2023 and 2028
- Exhibits112: Overview on criticality of inputs and factors of differentiation
- Exhibits113: Overview on factors of disruption
- Exhibits114: Impact of key risks on business
- Exhibits115: Companies covered
- Exhibits116: Matrix on companies position and classification
- Exhibits117: 3M Co. - Overview
- Exhibits118: 3M Co. - Business segments
- Exhibits119: 3M Co. - Key news
- Exhibits120: 3M Co. - Key offerings
- Exhibits121: 3M Co. - Segment focus
- Exhibits122: Albert Handtmann Holding GmbH and Co. KG - Overview
- Exhibits123: Albert Handtmann Holding GmbH and Co. KG - Product / Service
- Exhibits124: Albert Handtmann Holding GmbH and Co. KG - Key offerings
- Exhibits125: Alfa Laval AB - Overview
- Exhibits126: Alfa Laval AB - Business segments
- Exhibits127: Alfa Laval AB - Key news
- Exhibits128: Alfa Laval AB - Key offerings
- Exhibits129: Alfa Laval AB - Segment focus
- Exhibits130: American Air Filter Co. Inc. - Overview
- Exhibits131: American Air Filter Co. Inc. - Product / Service
- Exhibits132: American Air Filter Co. Inc. - Key offerings
- Exhibits133: Critical Process Filtration Inc. - Overview
- Exhibits134: Critical Process Filtration Inc. - Product / Service
- Exhibits135: Critical Process Filtration Inc. - Key offerings
- Exhibits136: Donaldson Co. Inc. - Overview
- Exhibits137: Donaldson Co. Inc. - Business segments
- Exhibits138: Donaldson Co. Inc. - Key news
- Exhibits139: Donaldson Co. Inc. - Key offerings
- Exhibits140: Donaldson Co. Inc. - Segment focus
- Exhibits141: Eaton Corp. Plc - Overview
- Exhibits142: Eaton Corp. Plc - Business segments
- Exhibits143: Eaton Corp. Plc - Key news
- Exhibits144: Eaton Corp. Plc - Key offerings
- Exhibits145: Eaton Corp. Plc - Segment focus
- Exhibits146: Filter Concept Pvt. Ltd. - Overview
- Exhibits147: Filter Concept Pvt. Ltd. - Product / Service
- Exhibits148: Filter Concept Pvt. Ltd. - Key offerings
- Exhibits149: Freudenberg and Co. KG - Overview
- Exhibits150: Freudenberg and Co. KG - Business segments
- Exhibits151: Freudenberg and Co. KG - Key news
- Exhibits152: Freudenberg and Co. KG - Key offerings
- Exhibits153: Freudenberg and Co. KG - Segment focus
- Exhibits154: GEA Group AG - Overview
- Exhibits155: GEA Group AG - Business segments
- Exhibits156: GEA Group AG - Key offerings
- Exhibits157: GEA Group AG - Segment focus
- Exhibits158: Graver Technologies LLC - Overview
- Exhibits159: Graver Technologies LLC - Product / Service
- Exhibits160: Graver Technologies LLC - Key offerings
- Exhibits161: Krones AG - Overview
- Exhibits162: Krones AG - Product / Service
- Exhibits163: Krones AG - Key news
- Exhibits164: Krones AG - Key offerings
- Exhibits165: MORI TEM srl - Overview
- Exhibits166: MORI TEM srl - Product / Service
- Exhibits167: MORI TEM srl - Key offerings
- Exhibits168: Parker Hannifin Corp. - Overview
- Exhibits169: Parker Hannifin Corp. - Business segments
- Exhibits170: Parker Hannifin Corp. - Key news
- Exhibits171: Parker Hannifin Corp. - Key offerings
- Exhibits172: Parker Hannifin Corp. - Segment focus
- Exhibits173: Schenck Process Holding GmbH - Overview
- Exhibits174: Schenck Process Holding GmbH - Product / Service
- Exhibits175: Schenck Process Holding GmbH - Key offerings
- Exhibits176: Inclusions checklist
- Exhibits177: Exclusions checklist
- Exhibits178: Currency conversion rates for US$
- Exhibits179: Research methodology
- Exhibits180: Information sources
- Exhibits181: Data validation
- Exhibits182: Validation techniques employed for market sizing
- Exhibits183: Data synthesis
- Exhibits184: 360 degree market analysis
- Exhibits185: List of abbreviations
Industrial Food And Beverage Filtration Systems Market 2024-2028
The industrial food and beverage filtration systems market is forecasted to grow by USD 2939.9 mn during 2023-2028, accelerating at a CAGR of 13.83% during the forecast period. The report on the industrial food and beverage filtration systems market provides a holistic analysis, market size and forecast, trends, growth drivers, and challenges, as well as vendor analysis covering around 25 vendors.
The report offers an up-to-date analysis regarding the current market scenario, the latest trends and drivers, and the overall market environment. The market is driven by rise in focus on prevention of food contamination, wide applications of food and beverage filtration systems, and development of high-efficiency filters.
| Market Scope | |
|---|---|
| Base Year | 2024 |
| End Year | 2028 |
| Series Year | 2024-2028 |
| Growth Momentum | Accelerate |
| YOY 2024 | 11.87% |
| CAGR | 13.83% |
| Incremental Value | $2939.9mn |
Technavio's industrial food and beverage filtration systems market is segmented as below:
By Product
- Liquid filtration systems
- Air filtration systems
By Application
- Beverages
- Dairy
- Food and ingredients
By Geography
- Europe
- APAC
- North America
- South America
- Middle East and Africa
This study identifies the introduction of new food and beverage filtration systems as one of the prime reasons driving the industrial food and beverage filtration systems market growth during the next few years. Also, availability of energy-efficient filtration systems and product recalls will lead to sizable demand in the market.
The report on the industrial food and beverage filtration systems market covers the following areas:
- Industrial food and beverage filtration systems market sizing
- Industrial food and beverage filtration systems market forecast
- Industrial food and beverage filtration systems market industry analysis
The robust vendor analysis is designed to help clients improve their market position, and in line with this, this report provides a detailed analysis of several leading industrial food and beverage filtration systems market vendors that include 3M Co., AJR Filtration Inc., Albert Handtmann Holding GmbH and Co. KG, Alfa Laval AB, American Air Filter Co. Inc., Camfil AB, Compositech Products Manufacturing Inc., Critical Process Filtration Inc., Donaldson Co. Inc., Eaton Corp. Plc, Filter Concept Pvt. Ltd., Freudenberg and Co. KG, GEA Group AG, Graver Technologies LLC, Krones AG, MORI TEM srl, Mott Corp., Parker Hannifin Corp., Russell Finex Ltd., and Schenck Process Holding GmbH. Also, the industrial food and beverage filtration systems market analysis report includes information on upcoming trends and challenges that will influence market growth. This is to help companies strategize and leverage all forthcoming growth opportunities.
The study was conducted using an objective combination of primary and secondary information including inputs from key participants in the industry. The report contains a comprehensive market and vendor landscape in addition to an analysis of the key vendors.
The publisher presents a detailed picture of the market by the way of study, synthesis, and summation of data from multiple sources by an analysis of key parameters such as profit, pricing, competition, and promotions. It presents various market facets by identifying the key industry influencers. The data presented is comprehensive, reliable, and a result of extensive research - both primary and secondary. The market research reports provide a complete competitive landscape and an in-depth vendor selection methodology and analysis using qualitative and quantitative research to forecast the accurate market growth.
Table of Contents
1 Executive Summary
- 1.1 Market overview
- Executive Summary - Chart on Market Overview
- Executive Summary - Data Table on Market Overview
- Executive Summary - Chart on Global Market Characteristics
- Executive Summary - Chart on Market by Geography
- Executive Summary - Chart on Market Segmentation by Product
- Executive Summary - Chart on Market Segmentation by Application
- Executive Summary - Chart on Incremental Growth
- Executive Summary - Data Table on Incremental Growth
- Executive Summary - Chart on Company Market Positioning
2 Market Landscape
- 2.1 Market ecosystem
- Parent Market
- Data Table on - Parent Market
- 2.2 Market characteristics
- Market characteristics analysis
- 2.3 Value chain analysis
- Value Chain Analysis
3 Market Sizing
- 3.1 Market definition
- Offerings of companies included in the market definition
- 3.2 Market segment analysis
- Market segments
- 3.3 Market size 2023
- 3.4 Market outlook: Forecast for 2023-2028
- Chart on Global - Market size and forecast 2023-2028 ($ million)
- Data Table on Global - Market size and forecast 2023-2028 ($ million)
- Chart on Global Market: Year-over-year growth 2023-2028 (%)
- Data Table on Global Market: Year-over-year growth 2023-2028 (%)
4 Historic Market Size
- 4.1 Global Industrial Food And Beverage Filtration Systems Market 2018 - 2022
- Historic Market Size - Data Table on Global Industrial Food And Beverage Filtration Systems Market 2018 - 2022 ($ million)
- 4.2 Product segment analysis 2018 - 2022
- Historic Market Size - Product Segment 2018 - 2022 ($ million)
- 4.3 Application segment analysis 2018 - 2022
- Historic Market Size - Application Segment 2018 - 2022 ($ million)
- 4.4 Geography segment analysis 2018 - 2022
- Historic Market Size - Geography Segment 2018 - 2022 ($ million)
- 4.5 Country segment analysis 2018 - 2022
- Historic Market Size - Country Segment 2018 - 2022 ($ million)
5 Five Forces Analysis
- 5.1 Five forces summary
- Five forces analysis - Comparison between 2023 and 2028
- 5.2 Bargaining power of buyers
- Bargaining power of buyers - Impact of key factors 2023 and 2028
- 5.3 Bargaining power of suppliers
- Bargaining power of suppliers - Impact of key factors in 2023 and 2028
- 5.4 Threat of new entrants
- Threat of new entrants - Impact of key factors in 2023 and 2028
- 5.5 Threat of substitutes
- Threat of substitutes - Impact of key factors in 2023 and 2028
- 5.6 Threat of rivalry
- Threat of rivalry - Impact of key factors in 2023 and 2028
- 5.7 Market condition
- Chart on Market condition - Five forces 2023 and 2028
6 Market Segmentation by Product
- 6.1 Market segments
- Chart on Product - Market share 2023-2028 (%)
- Data Table on Product - Market share 2023-2028 (%)
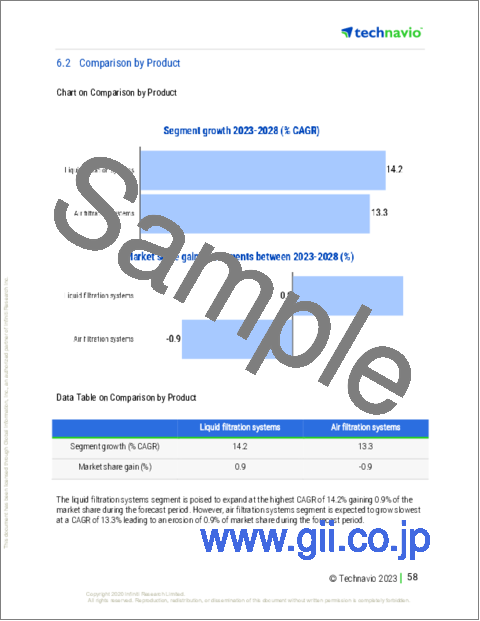
- 6.2 Comparison by Product
- Chart on Comparison by Product
- Data Table on Comparison by Product
- 6.3 Liquid filtration systems - Market size and forecast 2023-2028
- Chart on Liquid filtration systems - Market size and forecast 2023-2028 ($ million)
- Data Table on Liquid filtration systems - Market size and forecast 2023-2028 ($ million)
- Chart on Liquid filtration systems - Year-over-year growth 2023-2028 (%)
- Data Table on Liquid filtration systems - Year-over-year growth 2023-2028 (%)
- 6.4 Air filtration systems - Market size and forecast 2023-2028
- Chart on Air filtration systems - Market size and forecast 2023-2028 ($ million)
- Data Table on Air filtration systems - Market size and forecast 2023-2028 ($ million)
- Chart on Air filtration systems - Year-over-year growth 2023-2028 (%)
- Data Table on Air filtration systems - Year-over-year growth 2023-2028 (%)
- 6.5 Market opportunity by Product
- Market opportunity by Product ($ million)
- Data Table on Market opportunity by Product ($ million)
7 Market Segmentation by Application
- 7.1 Market segments
- Chart on Application - Market share 2023-2028 (%)
- Data Table on Application - Market share 2023-2028 (%)
- 7.2 Comparison by Application
- Chart on Comparison by Application
- Data Table on Comparison by Application
- 7.3 Beverages - Market size and forecast 2023-2028
- Chart on Beverages - Market size and forecast 2023-2028 ($ million)
- Data Table on Beverages - Market size and forecast 2023-2028 ($ million)
- Chart on Beverages - Year-over-year growth 2023-2028 (%)
- Data Table on Beverages - Year-over-year growth 2023-2028 (%)
- 7.4 Dairy - Market size and forecast 2023-2028
- Chart on Dairy - Market size and forecast 2023-2028 ($ million)
- Data Table on Dairy - Market size and forecast 2023-2028 ($ million)
- Chart on Dairy - Year-over-year growth 2023-2028 (%)
- Data Table on Dairy - Year-over-year growth 2023-2028 (%)
- 7.5 Food and ingredients - Market size and forecast 2023-2028
- Chart on Food and ingredients - Market size and forecast 2023-2028 ($ million)
- Data Table on Food and ingredients - Market size and forecast 2023-2028 ($ million)
- Chart on Food and ingredients - Year-over-year growth 2023-2028 (%)
- Data Table on Food and ingredients - Year-over-year growth 2023-2028 (%)
- 7.6 Market opportunity by Application
- Market opportunity by Application ($ million)
- Data Table on Market opportunity by Application ($ million)
8 Customer Landscape
- 8.1 Customer landscape overview
- Analysis of price sensitivity, lifecycle, customer purchase basket, adoption rates, and purchase criteria
9 Geographic Landscape
- 9.1 Geographic segmentation
- Chart on Market share By Geographical Landscape2023-2028 (%)
- Data Table on Market share By Geographical Landscape2023-2028 (%)
- 9.2 Geographic comparison
- Chart on Geographic comparison
- Data Table on Geographic comparison
- 9.3 Europe - Market size and forecast 2023-2028
- Chart on Europe - Market size and forecast 2023-2028 ($ million)
- Data Table on Europe - Market size and forecast 2023-2028 ($ million)
- Chart on Europe - Year-over-year growth 2023-2028 (%)
- Data Table on Europe - Year-over-year growth 2023-2028 (%)
- 9.4 APAC - Market size and forecast 2023-2028
- Chart on APAC - Market size and forecast 2023-2028 ($ million)
- Data Table on APAC - Market size and forecast 2023-2028 ($ million)
- Chart on APAC - Year-over-year growth 2023-2028 (%)
- Data Table on APAC - Year-over-year growth 2023-2028 (%)
- 9.5 North America - Market size and forecast 2023-2028
- Chart on North America - Market size and forecast 2023-2028 ($ million)
- Data Table on North America - Market size and forecast 2023-2028 ($ million)
- Chart on North America - Year-over-year growth 2023-2028 (%)
- Data Table on North America - Year-over-year growth 2023-2028 (%)
- 9.6 South America - Market size and forecast 2023-2028
- Chart on South America - Market size and forecast 2023-2028 ($ million)
- Data Table on South America - Market size and forecast 2023-2028 ($ million)
- Chart on South America - Year-over-year growth 2023-2028 (%)
- Data Table on South America - Year-over-year growth 2023-2028 (%)
- 9.7 Middle East and Africa - Market size and forecast 2023-2028
- Chart on Middle East and Africa - Market size and forecast 2023-2028 ($ million)
- Data Table on Middle East and Africa - Market size and forecast 2023-2028 ($ million)
- Chart on Middle East and Africa - Year-over-year growth 2023-2028 (%)
- Data Table on Middle East and Africa - Year-over-year growth 2023-2028 (%)
- 9.8 US - Market size and forecast 2023-2028
- Chart on US - Market size and forecast 2023-2028 ($ million)
- Data Table on US - Market size and forecast 2023-2028 ($ million)
- Chart on US - Year-over-year growth 2023-2028 (%)
- Data Table on US - Year-over-year growth 2023-2028 (%)
- 9.9 China - Market size and forecast 2023-2028
- Chart on China - Market size and forecast 2023-2028 ($ million)
- Data Table on China - Market size and forecast 2023-2028 ($ million)
- Chart on China - Year-over-year growth 2023-2028 (%)
- Data Table on China - Year-over-year growth 2023-2028 (%)
- 9.10 Germany - Market size and forecast 2023-2028
- Chart on Germany - Market size and forecast 2023-2028 ($ million)
- Data Table on Germany - Market size and forecast 2023-2028 ($ million)
- Chart on Germany - Year-over-year growth 2023-2028 (%)
- Data Table on Germany - Year-over-year growth 2023-2028 (%)
- 9.11 France - Market size and forecast 2023-2028
- Chart on France - Market size and forecast 2023-2028 ($ million)
- Data Table on France - Market size and forecast 2023-2028 ($ million)
- Chart on France - Year-over-year growth 2023-2028 (%)
- Data Table on France - Year-over-year growth 2023-2028 (%)
- 9.12 India - Market size and forecast 2023-2028
- Chart on India - Market size and forecast 2023-2028 ($ million)
- Data Table on India - Market size and forecast 2023-2028 ($ million)
- Chart on India - Year-over-year growth 2023-2028 (%)
- Data Table on India - Year-over-year growth 2023-2028 (%)
- 9.13 Market opportunity by geography
- Market opportunity By Geographical Landscape($ million)
- Data Tables on Market opportunity By Geographical Landscape($ million)
10 Drivers, Challenges, and Opportunity/Restraints
- 10.1 Market drivers
- 10.2 Market challenges
- 10.3 Impact of drivers and challenges
- Impact of drivers and challenges in 2023 and 2028
- 10.4 Market opportunities/restraints
11 Competitive Landscape
- 11.1 Overview
- 11.2 Competitive Landscape
- Overview on criticality of inputs and factors of differentiation
- 11.3 Landscape disruption
- Overview on factors of disruption
- 11.4 Industry risks
- Impact of key risks on business
12 Competitive Analysis
- 12.1 Companies profiled
- Companies covered
- 12.2 Market positioning of companies
- Matrix on companies position and classification
- 3M Co.
- 3M Co. - Overview
- 3M Co. - Business segments
- 3M Co. - Key news
- 3M Co. - Key offerings
- 3M Co. - Segment focus
- 12.4 Albert Handtmann Holding GmbH and Co. KG
- Albert Handtmann Holding GmbH and Co. KG - Overview
- Albert Handtmann Holding GmbH and Co. KG - Product / Service
- Albert Handtmann Holding GmbH and Co. KG - Key offerings
- 12.5 Alfa Laval AB
- Alfa Laval AB - Overview
- Alfa Laval AB - Business segments
- Alfa Laval AB - Key news
- Alfa Laval AB - Key offerings
- Alfa Laval AB - Segment focus
- 12.6 American Air Filter Co. Inc.
- American Air Filter Co. Inc. - Overview
- American Air Filter Co. Inc. - Product / Service
- American Air Filter Co. Inc. - Key offerings
- 12.7 Critical Process Filtration Inc.
- Critical Process Filtration Inc. - Overview
- Critical Process Filtration Inc. - Product / Service
- Critical Process Filtration Inc. - Key offerings
- 12.8 Donaldson Co. Inc.
- Donaldson Co. Inc. - Overview
- Donaldson Co. Inc. - Business segments
- Donaldson Co. Inc. - Key news
- Donaldson Co. Inc. - Key offerings
- Donaldson Co. Inc. - Segment focus
- 12.9 Eaton Corp. Plc
- Eaton Corp. Plc - Overview
- Eaton Corp. Plc - Business segments
- Eaton Corp. Plc - Key news
- Eaton Corp. Plc - Key offerings
- Eaton Corp. Plc - Segment focus
- 12.10 Filter Concept Pvt. Ltd.
- Filter Concept Pvt. Ltd. - Overview
- Filter Concept Pvt. Ltd. - Product / Service
- Filter Concept Pvt. Ltd. - Key offerings
- 12.11 Freudenberg and Co. KG
- Freudenberg and Co. KG - Overview
- Freudenberg and Co. KG - Business segments
- Freudenberg and Co. KG - Key news
- Freudenberg and Co. KG - Key offerings
- Freudenberg and Co. KG - Segment focus
- 12.12 GEA Group AG
- GEA Group AG - Overview
- GEA Group AG - Business segments
- GEA Group AG - Key offerings
- GEA Group AG - Segment focus
- 12.13 Graver Technologies LLC
- Graver Technologies LLC - Overview
- Graver Technologies LLC - Product / Service
- Graver Technologies LLC - Key offerings
- 12.14 Krones AG
- Krones AG - Overview
- Krones AG - Product / Service
- Krones AG - Key news
- Krones AG - Key offerings
- 12.15 MORI TEM srl
- MORI TEM srl - Overview
- MORI TEM srl - Product / Service
- MORI TEM srl - Key offerings
- 12.16 Parker Hannifin Corp.
- Parker Hannifin Corp. - Overview
- Parker Hannifin Corp. - Business segments
- Parker Hannifin Corp. - Key news
- Parker Hannifin Corp. - Key offerings
- Parker Hannifin Corp. - Segment focus
- 12.17 Schenck Process Holding GmbH
- Schenck Process Holding GmbH - Overview
- Schenck Process Holding GmbH - Product / Service
- Schenck Process Holding GmbH - Key offerings
13 Appendix
- 13.1 Scope of the report
- 13.2 Inclusions and exclusions checklist
- Inclusions checklist
- Exclusions checklist
- 13.3 Currency conversion rates for US$
- Currency conversion rates for US$
- 13.4 Research methodology
- Research methodology
- 13.5 Data procurement
- Information sources
- 13.6 Data validation
- Data validation
- 13.7 Validation techniques employed for market sizing
- Validation techniques employed for market sizing
- 13.8 Data synthesis
- Data synthesis
- 13.9 360 degree market analysis
- 360 degree market analysis
- 13.10 List of abbreviations
- List of abbreviations

