|
|
市場調査レポート
商品コード
1502624
自動車用2柱リフトの世界市場 2024~2028年Global automotive two-post lift market 2024-2028 |
||||||
|
|||||||
カスタマイズ可能
|
|||||||

| 自動車用2柱リフトの世界市場 2024~2028年 |
|
出版日: 2024年05月17日
発行: TechNavio
ページ情報: 英文 161 Pages
納期: 即納可能
|

全表示
- 概要
- 図表
- 目次
自動車用2柱リフト市場は、2023年から2028年にかけて6億5,590万米ドル、予測期間中のCAGRは9.59%で成長すると予測されます。
当レポートでは、自動車用2柱リフト市場の全体的な分析、市場規模・予測、動向、成長促進要因、課題、約25のベンダーを網羅したベンダー分析などを掲載しています。
現在の市場シナリオ、最新動向と促進要因、市場環境全体に関する最新分析を提供しています。市場は、四輪車市場の成長、自動車産業における簡素化されたソリューションへの需要、標準化による自動車用2柱リフトの信頼性と安全性の向上が促進しています。
| 市場範囲 | |
|---|---|
| 基準年 | 2024年 |
| 終了年 | 2028年 |
| 予測期間 | 2024~2028年 |
| 成長モメンタム | 加速 |
| 前年比2024年 | 8.52% |
| CAGR | 9.59% |
| 増分値 | 6億5,590万米ドル |
本調査では、今後数年間の自動車用2柱リフト市場成長を促進する主な要因の1つとして、自動車修理・メンテナンスサービス業界を後押しする自動車の平均年齢の上昇を挙げています。また、リフトのような大型工作機器による店舗生産性の向上や、環境に優しい車両リフトの人気の高まりは、市場の大きな需要につながります。
目次
第1章 エグゼクティブサマリー
- 市場概要
第2章 市場情勢
- 市場エコシステム
- 市場の特徴
- バリューチェーン分析
第3章 市場規模の評価
- 市場の定義
- 市場セグメント分析
- 市場規模、2023年
- 市場の見通し、2023~2028年
第4章 市場規模実績
- 世界の自動車用2柱リフト市場、2018~2022年
- 流通チャネルセグメント分析、2018~2022年
- 車両タイプセグメント分析、2018~2022年
- 地域別セグメント分析、2018~2022年
- 国別セグメント分析、2018~2022年
第5章 ファイブフォース分析
- ファイブフォースの要約
- 買い手の交渉力
- 供給企業の交渉力
- 新規参入業者の脅威
- 代替品の脅威
- 競争の脅威
- 市況
第6章 市場セグメンテーション:流通チャネル別
- 市場セグメンテーション
- 比較:流通チャネル別
- オフライン:市場規模と予測、2023~2028年
- オンライン:市場規模と予測、2023~2028年
- 市場機会:流通チャネル別
第7章 市場セグメンテーション:車両タイプ別
- 市場セグメンテーション
- 比較:車両タイプ別
- 旅客:市場規模と予測、2023~2028年
- 商業:市場規模と予測、2023~2028年
- 市場機会:車両タイプ別
第8章 顧客情勢
- 顧客情勢の概要
第9章 地域別情勢
- 地域別セグメンテーション
- 地域別比較
- アジア太平洋:市場規模と予測、2023~2028年
- 欧州:市場規模と予測、2023~2028年
- 北米:市場規模と予測、2023~2028年
- 中東・アフリカ:市場規模と予測、2023~2028年
- 南米:市場規模と予測、2023~2028年
- 中国:市場規模と予測、2023~2028年
- 米国:市場規模と予測、2023~2028年
- ドイツ:市場規模と予測、2023~2028年
- 日本:市場規模と予測、2023~2028年
- 英国:市場規模と予測、2023~2028年
- 市場機会:地域情勢別
第10章 促進要因・課題・機会・抑制要因
- 市場促進要因
- 市場の課題
- 促進要因と課題の影響
- 市場の機会 / 抑制要因
第11章 競合情勢
- 概要
- 競合情勢
- 混乱の状況
- 業界のリスク
第12章 競合分析
- 企業プロファイル
- 企業の市場ポジショニング
- Aichi Brand
- Amfos International
- ARI HETRA
- ATS ELGI
- BendPak Inc.
- Challenger Lifts Inc.
- EAE Automotive Equipment Co. Ltd.
- Hunter Engineering Co.
- LAUNCH Shanghai Machinery Co. Ltd.
- MAHA Maschinenbau Haldenwang GmbH and Co. KG
- MBL Impex Pvt. Ltd.
- Nussbaum Automotive Solutions LP
- PEAK Corp.
- Rotary Lift
- Stertil Koni USA Inc.
第13章 付録
Exhibits:
- Exhibits1: Executive Summary - Chart on Market Overview
- Exhibits2: Executive Summary - Data Table on Market Overview
- Exhibits3: Executive Summary - Chart on Global Market Characteristics
- Exhibits4: Executive Summary - Chart on Market By Geographical Landscape
- Exhibits5: Executive Summary - Chart on Market Segmentation by Distribution Channel
- Exhibits6: Executive Summary - Chart on Market Segmentation by Vehicle Type
- Exhibits7: Executive Summary - Chart on Incremental Growth
- Exhibits8: Executive Summary - Data Table on Incremental Growth
- Exhibits9: Executive Summary - Chart on Company Market Positioning
- Exhibits10: Parent Market
- Exhibits11: Data Table on - Parent Market
- Exhibits12: Market characteristics analysis
- Exhibits13: Value Chain Analysis
- Exhibits14: Offerings of companies included in the market definition
- Exhibits15: Market segments
- Exhibits16: Chart on Global - Market size and forecast 2023-2028 ($ million)
- Exhibits17: Data Table on Global - Market size and forecast 2023-2028 ($ million)
- Exhibits18: Chart on Global Market: Year-over-year growth 2023-2028 (%)
- Exhibits19: Data Table on Global Market: Year-over-year growth 2023-2028 (%)
- Exhibits20: Historic Market Size - Data Table on Global Automotive Two-Post Lift Market 2018 - 2022 ($ million)
- Exhibits21: Historic Market Size - Distribution Channel Segment 2018 - 2022 ($ million)
- Exhibits22: Historic Market Size - Vehicle Type Segment 2018 - 2022 ($ million)
- Exhibits23: Historic Market Size - Geography Segment 2018 - 2022 ($ million)
- Exhibits24: Historic Market Size - Country Segment 2018 - 2022 ($ million)
- Exhibits25: Five forces analysis - Comparison between 2023 and 2028
- Exhibits26: Bargaining power of buyers - Impact of key factors 2023 and 2028
- Exhibits27: Bargaining power of suppliers - Impact of key factors in 2023 and 2028
- Exhibits28: Threat of new entrants - Impact of key factors in 2023 and 2028
- Exhibits29: Threat of substitutes - Impact of key factors in 2023 and 2028
- Exhibits30: Threat of rivalry - Impact of key factors in 2023 and 2028
- Exhibits31: Chart on Market condition - Five forces 2023 and 2028
- Exhibits32: Chart on Distribution Channel - Market share 2023-2028 (%)
- Exhibits33: Data Table on Distribution Channel - Market share 2023-2028 (%)
- Exhibits34: Chart on Comparison by Distribution Channel
- Exhibits35: Data Table on Comparison by Distribution Channel
- Exhibits36: Chart on Offline - Market size and forecast 2023-2028 ($ million)
- Exhibits37: Data Table on Offline - Market size and forecast 2023-2028 ($ million)
- Exhibits38: Chart on Offline - Year-over-year growth 2023-2028 (%)
- Exhibits39: Data Table on Offline - Year-over-year growth 2023-2028 (%)
- Exhibits40: Chart on Online - Market size and forecast 2023-2028 ($ million)
- Exhibits41: Data Table on Online - Market size and forecast 2023-2028 ($ million)
- Exhibits42: Chart on Online - Year-over-year growth 2023-2028 (%)
- Exhibits43: Data Table on Online - Year-over-year growth 2023-2028 (%)
- Exhibits44: Market opportunity by Distribution Channel ($ million)
- Exhibits45: Data Table on Market opportunity by Distribution Channel ($ million)
- Exhibits46: Chart on Vehicle Type - Market share 2023-2028 (%)
- Exhibits47: Data Table on Vehicle Type - Market share 2023-2028 (%)
- Exhibits48: Chart on Comparison by Vehicle Type
- Exhibits49: Data Table on Comparison by Vehicle Type
- Exhibits50: Chart on Passengers - Market size and forecast 2023-2028 ($ million)
- Exhibits51: Data Table on Passengers - Market size and forecast 2023-2028 ($ million)
- Exhibits52: Chart on Passengers - Year-over-year growth 2023-2028 (%)
- Exhibits53: Data Table on Passengers - Year-over-year growth 2023-2028 (%)
- Exhibits54: Chart on Commercial - Market size and forecast 2023-2028 ($ million)
- Exhibits55: Data Table on Commercial - Market size and forecast 2023-2028 ($ million)
- Exhibits56: Chart on Commercial - Year-over-year growth 2023-2028 (%)
- Exhibits57: Data Table on Commercial - Year-over-year growth 2023-2028 (%)
- Exhibits58: Market opportunity by Vehicle Type ($ million)
- Exhibits59: Data Table on Market opportunity by Vehicle Type ($ million)
- Exhibits60: Analysis of price sensitivity, lifecycle, customer purchase basket, adoption rates, and purchase criteria
- Exhibits61: Chart on Market share By Geographical Landscape 2023-2028 (%)
- Exhibits62: Data Table on Market share By Geographical Landscape 2023-2028 (%)
- Exhibits63: Chart on Geographic comparison
- Exhibits64: Data Table on Geographic comparison
- Exhibits65: Chart on APAC - Market size and forecast 2023-2028 ($ million)
- Exhibits66: Data Table on APAC - Market size and forecast 2023-2028 ($ million)
- Exhibits67: Chart on APAC - Year-over-year growth 2023-2028 (%)
- Exhibits68: Data Table on APAC - Year-over-year growth 2023-2028 (%)
- Exhibits69: Chart on Europe - Market size and forecast 2023-2028 ($ million)
- Exhibits70: Data Table on Europe - Market size and forecast 2023-2028 ($ million)
- Exhibits71: Chart on Europe - Year-over-year growth 2023-2028 (%)
- Exhibits72: Data Table on Europe - Year-over-year growth 2023-2028 (%)
- Exhibits73: Chart on North America - Market size and forecast 2023-2028 ($ million)
- Exhibits74: Data Table on North America - Market size and forecast 2023-2028 ($ million)
- Exhibits75: Chart on North America - Year-over-year growth 2023-2028 (%)
- Exhibits76: Data Table on North America - Year-over-year growth 2023-2028 (%)
- Exhibits77: Chart on Middle East and Africa - Market size and forecast 2023-2028 ($ million)
- Exhibits78: Data Table on Middle East and Africa - Market size and forecast 2023-2028 ($ million)
- Exhibits79: Chart on Middle East and Africa - Year-over-year growth 2023-2028 (%)
- Exhibits80: Data Table on Middle East and Africa - Year-over-year growth 2023-2028 (%)
- Exhibits81: Chart on South America - Market size and forecast 2023-2028 ($ million)
- Exhibits82: Data Table on South America - Market size and forecast 2023-2028 ($ million)
- Exhibits83: Chart on South America - Year-over-year growth 2023-2028 (%)
- Exhibits84: Data Table on South America - Year-over-year growth 2023-2028 (%)
- Exhibits85: Chart on China - Market size and forecast 2023-2028 ($ million)
- Exhibits86: Data Table on China - Market size and forecast 2023-2028 ($ million)
- Exhibits87: Chart on China - Year-over-year growth 2023-2028 (%)
- Exhibits88: Data Table on China - Year-over-year growth 2023-2028 (%)
- Exhibits89: Chart on US - Market size and forecast 2023-2028 ($ million)
- Exhibits90: Data Table on US - Market size and forecast 2023-2028 ($ million)
- Exhibits91: Chart on US - Year-over-year growth 2023-2028 (%)
- Exhibits92: Data Table on US - Year-over-year growth 2023-2028 (%)
- Exhibits93: Chart on Germany - Market size and forecast 2023-2028 ($ million)
- Exhibits94: Data Table on Germany - Market size and forecast 2023-2028 ($ million)
- Exhibits95: Chart on Germany - Year-over-year growth 2023-2028 (%)
- Exhibits96: Data Table on Germany - Year-over-year growth 2023-2028 (%)
- Exhibits97: Chart on Japan - Market size and forecast 2023-2028 ($ million)
- Exhibits98: Data Table on Japan - Market size and forecast 2023-2028 ($ million)
- Exhibits99: Chart on Japan - Year-over-year growth 2023-2028 (%)
- Exhibits100: Data Table on Japan - Year-over-year growth 2023-2028 (%)
- Exhibits101: Chart on UK - Market size and forecast 2023-2028 ($ million)
- Exhibits102: Data Table on UK - Market size and forecast 2023-2028 ($ million)
- Exhibits103: Chart on UK - Year-over-year growth 2023-2028 (%)
- Exhibits104: Data Table on UK - Year-over-year growth 2023-2028 (%)
- Exhibits105: Market opportunity By Geographical Landscape ($ million)
- Exhibits106: Data Tables on Market opportunity By Geographical Landscape ($ million)
- Exhibits107: Impact of drivers and challenges in 2023 and 2028
- Exhibits108: Overview on criticality of inputs and factors of differentiation
- Exhibits109: Overview on factors of disruption
- Exhibits110: Impact of key risks on business
- Exhibits111: Companies covered
- Exhibits112: Matrix on companies position and classification
- Exhibits113: Aichi Brand - Overview
- Exhibits114: Aichi Brand - Product / Service
- Exhibits115: Aichi Brand - Key offerings
- Exhibits116: Amfos International - Overview
- Exhibits117: Amfos International - Product / Service
- Exhibits118: Amfos International - Key offerings
- Exhibits119: ARI HETRA - Overview
- Exhibits120: ARI HETRA - Product / Service
- Exhibits121: ARI HETRA - Key offerings
- Exhibits122: ATS ELGI - Overview
- Exhibits123: ATS ELGI - Product / Service
- Exhibits124: ATS ELGI - Key news
- Exhibits125: ATS ELGI - Key offerings
- Exhibits126: BendPak Inc. - Overview
- Exhibits127: BendPak Inc. - Product / Service
- Exhibits128: BendPak Inc. - Key offerings
- Exhibits129: Challenger Lifts Inc. - Overview
- Exhibits130: Challenger Lifts Inc. - Product / Service
- Exhibits131: Challenger Lifts Inc. - Key offerings
- Exhibits132: EAE Automotive Equipment Co. Ltd. - Overview
- Exhibits133: EAE Automotive Equipment Co. Ltd. - Product / Service
- Exhibits134: EAE Automotive Equipment Co. Ltd. - Key offerings
- Exhibits135: Hunter Engineering Co. - Overview
- Exhibits136: Hunter Engineering Co. - Product / Service
- Exhibits137: Hunter Engineering Co. - Key news
- Exhibits138: Hunter Engineering Co. - Key offerings
- Exhibits139: LAUNCH Shanghai Machinery Co. Ltd. - Overview
- Exhibits140: LAUNCH Shanghai Machinery Co. Ltd. - Product / Service
- Exhibits141: LAUNCH Shanghai Machinery Co. Ltd. - Key offerings
- Exhibits142: MAHA Maschinenbau Haldenwang GmbH and Co. KG - Overview
- Exhibits143: MAHA Maschinenbau Haldenwang GmbH and Co. KG - Product / Service
- Exhibits144: MAHA Maschinenbau Haldenwang GmbH and Co. KG - Key offerings
- Exhibits145: MBL Impex Pvt. Ltd. - Overview
- Exhibits146: MBL Impex Pvt. Ltd. - Product / Service
- Exhibits147: MBL Impex Pvt. Ltd. - Key offerings
- Exhibits148: Nussbaum Automotive Solutions LP - Overview
- Exhibits149: Nussbaum Automotive Solutions LP - Product / Service
- Exhibits150: Nussbaum Automotive Solutions LP - Key offerings
- Exhibits151: PEAK Corp. - Overview
- Exhibits152: PEAK Corp. - Product / Service
- Exhibits153: PEAK Corp. - Key offerings
- Exhibits154: Rotary Lift - Overview
- Exhibits155: Rotary Lift - Product / Service
- Exhibits156: Rotary Lift - Key offerings
- Exhibits157: Stertil Koni USA Inc. - Overview
- Exhibits158: Stertil Koni USA Inc. - Product / Service
- Exhibits159: Stertil Koni USA Inc. - Key offerings
- Exhibits160: Inclusions checklist
- Exhibits161: Exclusions checklist
- Exhibits162: Currency conversion rates for US$
- Exhibits163: Research methodology
- Exhibits164: Information sources
- Exhibits165: Data validation
- Exhibits166: Validation techniques employed for market sizing
- Exhibits167: Data synthesis
- Exhibits168: 360 degree market analysis
- Exhibits169: List of abbreviations
The automotive two-post lift market is forecasted to grow by USD 655.9 mn during 2023-2028, accelerating at a CAGR of 9.59% during the forecast period. The report on the automotive two-post lift market provides a holistic analysis, market size and forecast, trends, growth drivers, and challenges, as well as vendor analysis covering around 25 vendors.
The report offers an up-to-date analysis regarding the current market scenario, the latest trends and drivers, and the overall market environment. The market is driven by growing market for four-wheelers, demand for simplified solutions in automotive industry, and increased reliability and safety in automotive two-post lifts through standards.
Technavio's automotive two-post lift market is segmented as below:
| Market Scope | |
|---|---|
| Base Year | 2024 |
| End Year | 2028 |
| Series Year | 2024-2028 |
| Growth Momentum | Accelerate |
| YOY 2024 | 8.52% |
| CAGR | 9.59% |
| Incremental Value | $655.9mn |
By Distribution Channel
- Offline
- Online
By Vehicle Type
- Passengers
- Commercial
By Geographical Landscape
- APAC
- Europe
- North America
- Middle East and Africa
- South America
This study identifies the increasing average age of vehicles to push automotive repair and maintenance service industry as one of the prime reasons driving the automotive two-post lift market growth during the next few years. Also, increased shop productivity through large shop equipment such as lifts and growing popularity of environment-friendly vehicle lifts will lead to sizable demand in the market.
The report on the automotive two-post lift market covers the following areas:
- Automotive two-post lift market sizing
- Automotive two-post lift market forecast
- Automotive two-post lift market industry analysis
The robust vendor analysis is designed to help clients improve their market position, and in line with this, this report provides a detailed analysis of several leading automotive two-post lift market vendors that include Aichi Brand, Amfos International, ARI HETRA, ATS ELGI, BendPak Inc., Challenger Lifts Inc., EAE Automotive Equipment Co. Ltd., Force Auto Solutions, Hunter Engineering Co., LAUNCH Shanghai Machinery Co. Ltd., MAHA Maschinenbau Haldenwang GmbH and Co. KG, MBL Impex Pvt. Ltd., Newtech Equipment, Nussbaum Automotive Solutions LP, PEAK Corp., PRAMUKH EQUIPMENTS, Rotary Lift, Shailendra Enterprises, Shivalik Automotive Garage Equipments, and Stertil Koni USA Inc.. Also, the automotive two-post lift market analysis report includes information on upcoming trends and challenges that will influence market growth. This is to help companies strategize and leverage all forthcoming growth opportunities.
The study was conducted using an objective combination of primary and secondary information including inputs from key participants in the industry. The report contains a comprehensive market and vendor landscape in addition to an analysis of the key vendors.
The publisher presents a detailed picture of the market by the way of study, synthesis, and summation of data from multiple sources by an analysis of key parameters such as profit, pricing, competition, and promotions. It presents various market facets by identifying the key industry influencers. The data presented is comprehensive, reliable, and a result of extensive research - both primary and secondary. The market research reports provide a complete competitive landscape and an in-depth vendor selection methodology and analysis using qualitative and quantitative research to forecast the accurate market growth.
Table of Contents
1 Executive Summary
- 1.1 Market overview
- Executive Summary - Chart on Market Overview
- Executive Summary - Data Table on Market Overview
- Executive Summary - Chart on Global Market Characteristics
- Executive Summary - Chart on Market By Geographical Landscape
- Executive Summary - Chart on Market Segmentation by Distribution Channel
- Executive Summary - Chart on Market Segmentation by Vehicle Type
- Executive Summary - Chart on Incremental Growth
- Executive Summary - Data Table on Incremental Growth
- Executive Summary - Chart on Company Market Positioning
2 Market Landscape
- 2.1 Market ecosystem
- Parent Market
- Data Table on - Parent Market
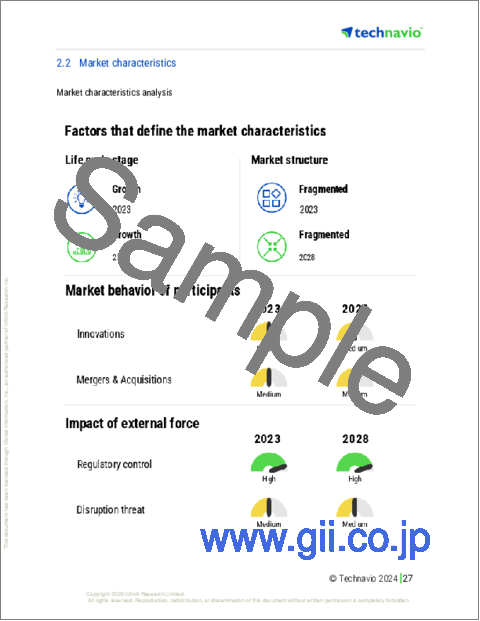
- 2.2 Market characteristics
- Market characteristics analysis
- 2.3 Value chain analysis
- Value Chain Analysis
3 Market Sizing
- 3.1 Market definition
- Offerings of companies included in the market definition
- 3.2 Market segment analysis
- Market segments
- 3.3 Market size 2023
- 3.4 Market outlook: Forecast for 2023-2028
- Chart on Global - Market size and forecast 2023-2028 ($ million)
- Data Table on Global - Market size and forecast 2023-2028 ($ million)
- Chart on Global Market: Year-over-year growth 2023-2028 (%)
- Data Table on Global Market: Year-over-year growth 2023-2028 (%)
4 Historic Market Size
- 4.1 Global Automotive Two-Post Lift Market 2018 - 2022
- Historic Market Size - Data Table on Global Automotive Two-Post Lift Market 2018 - 2022 ($ million)
- 4.2 Distribution Channel segment analysis 2018 - 2022
- Historic Market Size - Distribution Channel Segment 2018 - 2022 ($ million)
- 4.3 Vehicle Type segment analysis 2018 - 2022
- Historic Market Size - Vehicle Type Segment 2018 - 2022 ($ million)
- 4.4 Geography segment analysis 2018 - 2022
- Historic Market Size - Geography Segment 2018 - 2022 ($ million)
- 4.5 Country segment analysis 2018 - 2022
- Historic Market Size - Country Segment 2018 - 2022 ($ million)
5 Five Forces Analysis
- 5.1 Five forces summary
- Five forces analysis - Comparison between 2023 and 2028
- 5.2 Bargaining power of buyers
- Bargaining power of buyers - Impact of key factors 2023 and 2028
- 5.3 Bargaining power of suppliers
- Bargaining power of suppliers - Impact of key factors in 2023 and 2028
- 5.4 Threat of new entrants
- Threat of new entrants - Impact of key factors in 2023 and 2028
- 5.5 Threat of substitutes
- Threat of substitutes - Impact of key factors in 2023 and 2028
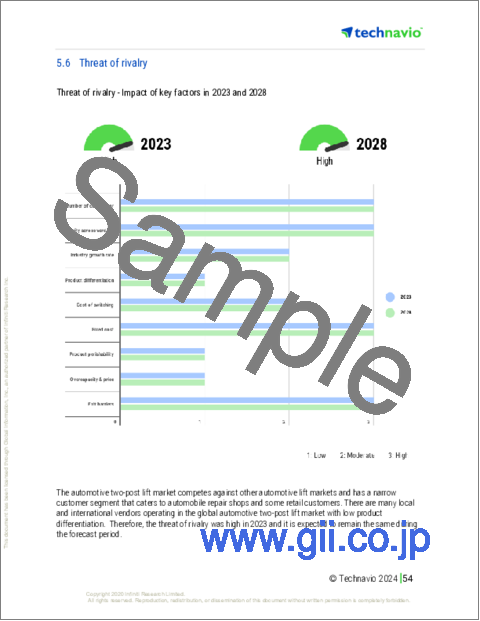
- 5.6 Threat of rivalry
- Threat of rivalry - Impact of key factors in 2023 and 2028
- 5.7 Market condition
- Chart on Market condition - Five forces 2023 and 2028
6 Market Segmentation by Distribution Channel
- 6.1 Market segments
- Chart on Distribution Channel - Market share 2023-2028 (%)
- Data Table on Distribution Channel - Market share 2023-2028 (%)
- 6.2 Comparison by Distribution Channel
- Chart on Comparison by Distribution Channel
- Data Table on Comparison by Distribution Channel
- 6.3 Offline - Market size and forecast 2023-2028
- Chart on Offline - Market size and forecast 2023-2028 ($ million)
- Data Table on Offline - Market size and forecast 2023-2028 ($ million)
- Chart on Offline - Year-over-year growth 2023-2028 (%)
- Data Table on Offline - Year-over-year growth 2023-2028 (%)
- 6.4 Online - Market size and forecast 2023-2028
- Chart on Online - Market size and forecast 2023-2028 ($ million)
- Data Table on Online - Market size and forecast 2023-2028 ($ million)
- Chart on Online - Year-over-year growth 2023-2028 (%)
- Data Table on Online - Year-over-year growth 2023-2028 (%)
- 6.5 Market opportunity by Distribution Channel
- Market opportunity by Distribution Channel ($ million)
- Data Table on Market opportunity by Distribution Channel ($ million)
7 Market Segmentation by Vehicle Type
- 7.1 Market segments
- Chart on Vehicle Type - Market share 2023-2028 (%)
- Data Table on Vehicle Type - Market share 2023-2028 (%)
- 7.2 Comparison by Vehicle Type
- Chart on Comparison by Vehicle Type
- Data Table on Comparison by Vehicle Type
- 7.3 Passengers - Market size and forecast 2023-2028
- Chart on Passengers - Market size and forecast 2023-2028 ($ million)
- Data Table on Passengers - Market size and forecast 2023-2028 ($ million)
- Chart on Passengers - Year-over-year growth 2023-2028 (%)
- Data Table on Passengers - Year-over-year growth 2023-2028 (%)
- 7.4 Commercial - Market size and forecast 2023-2028
- Chart on Commercial - Market size and forecast 2023-2028 ($ million)
- Data Table on Commercial - Market size and forecast 2023-2028 ($ million)
- Chart on Commercial - Year-over-year growth 2023-2028 (%)
- Data Table on Commercial - Year-over-year growth 2023-2028 (%)
- 7.5 Market opportunity by Vehicle Type
- Market opportunity by Vehicle Type ($ million)
- Data Table on Market opportunity by Vehicle Type ($ million)
8 Customer Landscape
- 8.1 Customer landscape overview
- Analysis of price sensitivity, lifecycle, customer purchase basket, adoption rates, and purchase criteria
9 Geographic Landscape
- 9.1 Geographic segmentation
- Chart on Market share By Geographical Landscape 2023-2028 (%)
- Data Table on Market share By Geographical Landscape 2023-2028 (%)
- 9.2 Geographic comparison
- Chart on Geographic comparison
- Data Table on Geographic comparison
- 9.3 APAC - Market size and forecast 2023-2028
- Chart on APAC - Market size and forecast 2023-2028 ($ million)
- Data Table on APAC - Market size and forecast 2023-2028 ($ million)
- Chart on APAC - Year-over-year growth 2023-2028 (%)
- Data Table on APAC - Year-over-year growth 2023-2028 (%)
- 9.4 Europe - Market size and forecast 2023-2028
- Chart on Europe - Market size and forecast 2023-2028 ($ million)
- Data Table on Europe - Market size and forecast 2023-2028 ($ million)
- Chart on Europe - Year-over-year growth 2023-2028 (%)
- Data Table on Europe - Year-over-year growth 2023-2028 (%)
- 9.5 North America - Market size and forecast 2023-2028
- Chart on North America - Market size and forecast 2023-2028 ($ million)
- Data Table on North America - Market size and forecast 2023-2028 ($ million)
- Chart on North America - Year-over-year growth 2023-2028 (%)
- Data Table on North America - Year-over-year growth 2023-2028 (%)
- 9.6 Middle East and Africa - Market size and forecast 2023-2028
- Chart on Middle East and Africa - Market size and forecast 2023-2028 ($ million)
- Data Table on Middle East and Africa - Market size and forecast 2023-2028 ($ million)
- Chart on Middle East and Africa - Year-over-year growth 2023-2028 (%)
- Data Table on Middle East and Africa - Year-over-year growth 2023-2028 (%)
- 9.7 South America - Market size and forecast 2023-2028
- Chart on South America - Market size and forecast 2023-2028 ($ million)
- Data Table on South America - Market size and forecast 2023-2028 ($ million)
- Chart on South America - Year-over-year growth 2023-2028 (%)
- Data Table on South America - Year-over-year growth 2023-2028 (%)
- 9.8 China - Market size and forecast 2023-2028
- Chart on China - Market size and forecast 2023-2028 ($ million)
- Data Table on China - Market size and forecast 2023-2028 ($ million)
- Chart on China - Year-over-year growth 2023-2028 (%)
- Data Table on China - Year-over-year growth 2023-2028 (%)
- 9.9 US - Market size and forecast 2023-2028
- Chart on US - Market size and forecast 2023-2028 ($ million)
- Data Table on US - Market size and forecast 2023-2028 ($ million)
- Chart on US - Year-over-year growth 2023-2028 (%)
- Data Table on US - Year-over-year growth 2023-2028 (%)
- 9.10 Germany - Market size and forecast 2023-2028
- Chart on Germany - Market size and forecast 2023-2028 ($ million)
- Data Table on Germany - Market size and forecast 2023-2028 ($ million)
- Chart on Germany - Year-over-year growth 2023-2028 (%)
- Data Table on Germany - Year-over-year growth 2023-2028 (%)
- 9.11 Japan - Market size and forecast 2023-2028
- Chart on Japan - Market size and forecast 2023-2028 ($ million)
- Data Table on Japan - Market size and forecast 2023-2028 ($ million)
- Chart on Japan - Year-over-year growth 2023-2028 (%)
- Data Table on Japan - Year-over-year growth 2023-2028 (%)
- 9.12 UK - Market size and forecast 2023-2028
- Chart on UK - Market size and forecast 2023-2028 ($ million)
- Data Table on UK - Market size and forecast 2023-2028 ($ million)
- Chart on UK - Year-over-year growth 2023-2028 (%)
- Data Table on UK - Year-over-year growth 2023-2028 (%)
- 9.13 Market opportunity By Geographical Landscape
- Market opportunity By Geographical Landscape ($ million)
- Data Tables on Market opportunity By Geographical Landscape ($ million)
10 Drivers, Challenges, and Opportunity/Restraints
- 10.1 Market drivers
- 10.2 Market challenges
- 10.3 Impact of drivers and challenges
- Impact of drivers and challenges in 2023 and 2028
- 10.4 Market opportunities/restraints
11 Competitive Landscape
- 11.1 Overview
- 11.2 Competitive Landscape
- Overview on criticality of inputs and factors of differentiation
- 11.3 Landscape disruption
- Overview on factors of disruption
- 11.4 Industry risks
- Impact of key risks on business
12 Competitive Analysis
- 12.1 Companies profiled
- Companies covered
- 12.2 Market positioning of companies
- Matrix on companies position and classification
- 12.3 Aichi Brand
- Aichi Brand - Overview
- Aichi Brand - Product / Service
- Aichi Brand - Key offerings
- 12.4 Amfos International
- Amfos International - Overview
- Amfos International - Product / Service
- Amfos International - Key offerings
- 12.5 ARI HETRA
- ARI HETRA - Overview
- ARI HETRA - Product / Service
- ARI HETRA - Key offerings
- 12.6 ATS ELGI
- ATS ELGI - Overview
- ATS ELGI - Product / Service
- ATS ELGI - Key news
- ATS ELGI - Key offerings
- 12.7 BendPak Inc.
- BendPak Inc. - Overview
- BendPak Inc. - Product / Service
- BendPak Inc. - Key offerings
- 12.8 Challenger Lifts Inc.
- Challenger Lifts Inc. - Overview
- Challenger Lifts Inc. - Product / Service
- Challenger Lifts Inc. - Key offerings
- 12.9 EAE Automotive Equipment Co. Ltd.
- EAE Automotive Equipment Co. Ltd. - Overview
- EAE Automotive Equipment Co. Ltd. - Product / Service
- EAE Automotive Equipment Co. Ltd. - Key offerings
- 12.10 Hunter Engineering Co.
- Hunter Engineering Co. - Overview
- Hunter Engineering Co. - Product / Service
- Hunter Engineering Co. - Key news
- Hunter Engineering Co. - Key offerings
- 12.11 LAUNCH Shanghai Machinery Co. Ltd.
- LAUNCH Shanghai Machinery Co. Ltd. - Overview
- LAUNCH Shanghai Machinery Co. Ltd. - Product / Service
- LAUNCH Shanghai Machinery Co. Ltd. - Key offerings
- 12.12 MAHA Maschinenbau Haldenwang GmbH and Co. KG
- MAHA Maschinenbau Haldenwang GmbH and Co. KG - Overview
- MAHA Maschinenbau Haldenwang GmbH and Co. KG - Product / Service
- MAHA Maschinenbau Haldenwang GmbH and Co. KG - Key offerings
- 12.13 MBL Impex Pvt. Ltd.
- MBL Impex Pvt. Ltd. - Overview
- MBL Impex Pvt. Ltd. - Product / Service
- MBL Impex Pvt. Ltd. - Key offerings
- 12.14 Nussbaum Automotive Solutions LP
- Nussbaum Automotive Solutions LP - Overview
- Nussbaum Automotive Solutions LP - Product / Service
- Nussbaum Automotive Solutions LP - Key offerings
- 12.15 PEAK Corp.
- PEAK Corp. - Overview
- PEAK Corp. - Product / Service
- PEAK Corp. - Key offerings
- 12.16 Rotary Lift
- Rotary Lift - Overview
- Rotary Lift - Product / Service
- Rotary Lift - Key offerings
- 12.17 Stertil Koni USA Inc.
- Stertil Koni USA Inc. - Overview
- Stertil Koni USA Inc. - Product / Service
- Stertil Koni USA Inc. - Key offerings
13 Appendix
- 13.1 Scope of the report
- 13.2 Inclusions and exclusions checklist
- Inclusions checklist
- Exclusions checklist
- 13.3 Currency conversion rates for US$
- Currency conversion rates for US$
- 13.4 Research methodology
- Research methodology
- 13.5 Data procurement
- Information sources
- 13.6 Data validation
- Data validation
- 13.7 Validation techniques employed for market sizing
- Validation techniques employed for market sizing
- 13.8 Data synthesis
- Data synthesis
- 13.9 360 degree market analysis
- 360 degree market analysis
- 13.10 List of abbreviations
- List of abbreviations

