|
|
市場調査レポート
商品コード
1515704
クラウドバックアップとリカバリーの世界市場 2024-2028Global cloud backup and recovery market 2024-2028 |
||||||

|
|||||||
カスタマイズ可能
|
|||||||

| クラウドバックアップとリカバリーの世界市場 2024-2028 |
|
出版日: 2024年06月11日
発行: TechNavio
ページ情報: 英文 180 Pages
納期: 即納可能
|

全表示
- 概要
- 図表
- 目次
クラウドバックアップとリカバリー市場は2023-2028年に338億2,040万米ドル、予測期間中のCAGRは23.31%で成長すると予測されます。
当レポートでは、クラウドバックアップとリカバリー市場の全体的な分析、市場規模・予測、動向、成長促進要因、課題、約25のベンダーを網羅したベンダー分析などを掲載しています。
現在の市場シナリオ、最新動向と促進要因、市場環境全体に関する最新分析を提供しています。市場は、IT支出の削減、クラウドベースのアプリケーションに対する需要の増加、顧客データを保護するための厳格なセキュリティ規則や規制によって牽引されています。
| 市場範囲 | |
|---|---|
| 基準年 | 2024 |
| 終了年 | 2028 |
| 予測期間 | 2024-2028 |
| 成長モメンタム | 加速 |
| 前年比2024年 | 18.59% |
| CAGR | 23.31% |
| 増分額 | 338億2,040万米ドル |
本調査では、クラウドセキュリティアプリケーションの増加が、今後数年間のクラウドバックアップとリカバリー市場成長を牽引する主要因の1つであると分析しています。また、クラウドコンピューティングモデルの拡大やマルチクラウドサービスの普及が市場の大きな需要につながります。
目次
第1章 エグゼクティブサマリー
- 市場概要
第2章 市場情勢
- 市場エコシステム
- 市場の特徴
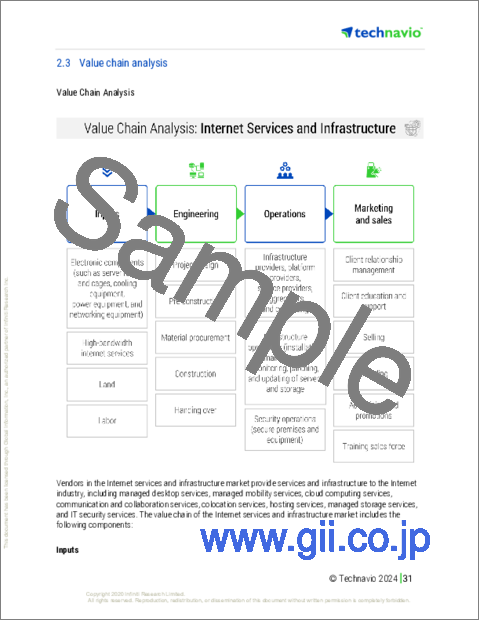
- バリューチェーン分析
第3章 市場規模の評価
- 市場の定義
- 市場セグメント分析
- 市場規模 2023
- 市場の見通し 2023-2028
第4章 市場規模実績
- 世界クラウドバックアップとリカバリー市場 2018-2022
- セクター別セグメント分析 2018-2022
- エンドユーザー別セグメント分析 2018-2022
- 地域別セグメント分析 2018-2022
- 国別セグメント分析 2018-2022
第5章 ファイブフォース分析
- ファイブフォースの要約
- 買い手の交渉力
- 供給企業の交渉力
- 新規参入業者の脅威
- 代替品の脅威
- 競争の脅威
- 市況
第6章 市場セグメンテーションセクター別
- 市場セグメンテーション
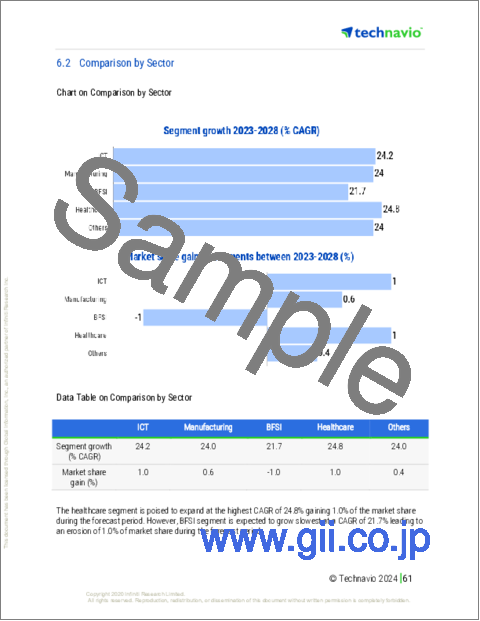
- 比較セクター別
- 情報通信技術:市場規模と予測 2023-2028
- 製造業:市場規模と予測 2023-2028
- BFSI:市場規模と予測 2023-2028
- ヘルスケア:市場規模と予測 2023-2028
- その他:市場規模と予測 2023-2028
- 市場機会セクター別
第7章 市場セグメンテーション:エンドユーザー別
- 市場セグメンテーション
- 比較:エンドユーザー別
- 大企業:市場規模と予測 2023-2028
- 中小企業:市場規模と予測 2023-2028
- 市場機会:エンドユーザー別
第8章 顧客情勢
- 顧客情勢の概要
第9章 地域別情勢
- 地域別セグメンテーション
- 地域別比較
- 北米:市場規模と予測 2023-2028
- 欧州:市場規模と予測 2023-2028
- アジア太平洋:市場規模と予測 2023-2028
- 南米:市場規模と予測 2023-2028
- 中東・アフリカ:市場規模と予測 2023-2028
- 米国:市場規模と予測 2023-2028
- カナダ:市場規模と予測 2023-2028
- 英国:市場規模と予測 2023-2028
- 中国:市場規模と予測 2023-2028
- ドイツ:市場規模と予測 2023-2028
- 市場機会:地域情勢別
第10章 促進要因・課題・機会・抑制要因
- 市場促進要因
- 市場の課題
- 促進要因と課題の影響
- 市場の機会・抑制要因
第11章 競合情勢
- 概要
- 競合情勢
- 混乱の状況
- 業界のリスク
第12章 競合分析
- 企業プロファイル
- 企業の市場ポジショニング
- Acronis International GmbH
- Actifio Inc.
- Arcserve USA LLC
- Asigra Inc.
- Carbonite Inc.
- Commvault Systems Inc.
- Datto Holdings Corp.
- Hewlett Packard Enterprise Co.
- International Business Machines Corp.
- Microsoft Corp.
- N able Solutions ULC and N able Technologies Ltd.
- Rackspace Technology Inc.
- Redstor
- Veeam Software Group GmbH
- Veritas Technologies LLC
第13章 付録
Exhibits:
- Exhibits1: Executive Summary - Chart on Market Overview
- Exhibits2: Executive Summary - Data Table on Market Overview
- Exhibits3: Executive Summary - Chart on Global Market Characteristics
- Exhibits4: Executive Summary - Chart on Market By Geographical Landscape
- Exhibits5: Executive Summary - Chart on Market Segmentation by Sector
- Exhibits6: Executive Summary - Chart on Market Segmentation by End-user
- Exhibits7: Executive Summary - Chart on Incremental Growth
- Exhibits8: Executive Summary - Data Table on Incremental Growth
- Exhibits9: Executive Summary - Chart on Company Market Positioning
- Exhibits10: Parent Market
- Exhibits11: Data Table on - Parent Market
- Exhibits12: Market characteristics analysis
- Exhibits13: Value Chain Analysis
- Exhibits14: Offerings of companies included in the market definition
- Exhibits15: Market segments
- Exhibits16: Chart on Global - Market size and forecast 2023-2028 ($ million)
- Exhibits17: Data Table on Global - Market size and forecast 2023-2028 ($ million)
- Exhibits18: Chart on Global Market: Year-over-year growth 2023-2028 (%)
- Exhibits19: Data Table on Global Market: Year-over-year growth 2023-2028 (%)
- Exhibits20: Historic Market Size - Data Table on Global Cloud Backup And Recovery Market 2018 - 2022 ($ million)
- Exhibits21: Historic Market Size - Sector Segment 2018 - 2022 ($ million)
- Exhibits22: Historic Market Size - End-user Segment 2018 - 2022 ($ million)
- Exhibits23: Historic Market Size - Geography Segment 2018 - 2022 ($ million)
- Exhibits24: Historic Market Size - Country Segment 2018 - 2022 ($ million)
- Exhibits25: Five forces analysis - Comparison between 2023 and 2028
- Exhibits26: Bargaining power of buyers - Impact of key factors 2023 and 2028
- Exhibits27: Bargaining power of suppliers - Impact of key factors in 2023 and 2028
- Exhibits28: Threat of new entrants - Impact of key factors in 2023 and 2028
- Exhibits29: Threat of substitutes - Impact of key factors in 2023 and 2028
- Exhibits30: Threat of rivalry - Impact of key factors in 2023 and 2028
- Exhibits31: Chart on Market condition - Five forces 2023 and 2028
- Exhibits32: Chart on Sector - Market share 2023-2028 (%)
- Exhibits33: Data Table on Sector - Market share 2023-2028 (%)
- Exhibits34: Chart on Comparison by Sector
- Exhibits35: Data Table on Comparison by Sector
- Exhibits36: Chart on ICT - Market size and forecast 2023-2028 ($ million)
- Exhibits37: Data Table on ICT - Market size and forecast 2023-2028 ($ million)
- Exhibits38: Chart on ICT - Year-over-year growth 2023-2028 (%)
- Exhibits39: Data Table on ICT - Year-over-year growth 2023-2028 (%)
- Exhibits40: Chart on Manufacturing - Market size and forecast 2023-2028 ($ million)
- Exhibits41: Data Table on Manufacturing - Market size and forecast 2023-2028 ($ million)
- Exhibits42: Chart on Manufacturing - Year-over-year growth 2023-2028 (%)
- Exhibits43: Data Table on Manufacturing - Year-over-year growth 2023-2028 (%)
- Exhibits44: Chart on BFSI - Market size and forecast 2023-2028 ($ million)
- Exhibits45: Data Table on BFSI - Market size and forecast 2023-2028 ($ million)
- Exhibits46: Chart on BFSI - Year-over-year growth 2023-2028 (%)
- Exhibits47: Data Table on BFSI - Year-over-year growth 2023-2028 (%)
- Exhibits48: Chart on Healthcare - Market size and forecast 2023-2028 ($ million)
- Exhibits49: Data Table on Healthcare - Market size and forecast 2023-2028 ($ million)
- Exhibits50: Chart on Healthcare - Year-over-year growth 2023-2028 (%)
- Exhibits51: Data Table on Healthcare - Year-over-year growth 2023-2028 (%)
- Exhibits52: Chart on Others - Market size and forecast 2023-2028 ($ million)
- Exhibits53: Data Table on Others - Market size and forecast 2023-2028 ($ million)
- Exhibits54: Chart on Others - Year-over-year growth 2023-2028 (%)
- Exhibits55: Data Table on Others - Year-over-year growth 2023-2028 (%)
- Exhibits56: Market opportunity by Sector ($ million)
- Exhibits57: Data Table on Market opportunity by Sector ($ million)
- Exhibits58: Chart on End-user - Market share 2023-2028 (%)
- Exhibits59: Data Table on End-user - Market share 2023-2028 (%)
- Exhibits60: Chart on Comparison by End-user
- Exhibits61: Data Table on Comparison by End-user
- Exhibits62: Chart on Large enterprises - Market size and forecast 2023-2028 ($ million)
- Exhibits63: Data Table on Large enterprises - Market size and forecast 2023-2028 ($ million)
- Exhibits64: Chart on Large enterprises - Year-over-year growth 2023-2028 (%)
- Exhibits65: Data Table on Large enterprises - Year-over-year growth 2023-2028 (%)
- Exhibits66: Chart on SMEs - Market size and forecast 2023-2028 ($ million)
- Exhibits67: Data Table on SMEs - Market size and forecast 2023-2028 ($ million)
- Exhibits68: Chart on SMEs - Year-over-year growth 2023-2028 (%)
- Exhibits69: Data Table on SMEs - Year-over-year growth 2023-2028 (%)
- Exhibits70: Market opportunity by End-user ($ million)
- Exhibits71: Data Table on Market opportunity by End-user ($ million)
- Exhibits72: Analysis of price sensitivity, lifecycle, customer purchase basket, adoption rates, and purchase criteria
- Exhibits73: Chart on Market share By Geographical Landscape 2023-2028 (%)
- Exhibits74: Data Table on Market share By Geographical Landscape 2023-2028 (%)
- Exhibits75: Chart on Geographic comparison
- Exhibits76: Data Table on Geographic comparison
- Exhibits77: Chart on North America - Market size and forecast 2023-2028 ($ million)
- Exhibits78: Data Table on North America - Market size and forecast 2023-2028 ($ million)
- Exhibits79: Chart on North America - Year-over-year growth 2023-2028 (%)
- Exhibits80: Data Table on North America - Year-over-year growth 2023-2028 (%)
- Exhibits81: Chart on Europe - Market size and forecast 2023-2028 ($ million)
- Exhibits82: Data Table on Europe - Market size and forecast 2023-2028 ($ million)
- Exhibits83: Chart on Europe - Year-over-year growth 2023-2028 (%)
- Exhibits84: Data Table on Europe - Year-over-year growth 2023-2028 (%)
- Exhibits85: Chart on APAC - Market size and forecast 2023-2028 ($ million)
- Exhibits86: Data Table on APAC - Market size and forecast 2023-2028 ($ million)
- Exhibits87: Chart on APAC - Year-over-year growth 2023-2028 (%)
- Exhibits88: Data Table on APAC - Year-over-year growth 2023-2028 (%)
- Exhibits89: Chart on South America - Market size and forecast 2023-2028 ($ million)
- Exhibits90: Data Table on South America - Market size and forecast 2023-2028 ($ million)
- Exhibits91: Chart on South America - Year-over-year growth 2023-2028 (%)
- Exhibits92: Data Table on South America - Year-over-year growth 2023-2028 (%)
- Exhibits93: Chart on Middle East and Africa - Market size and forecast 2023-2028 ($ million)
- Exhibits94: Data Table on Middle East and Africa - Market size and forecast 2023-2028 ($ million)
- Exhibits95: Chart on Middle East and Africa - Year-over-year growth 2023-2028 (%)
- Exhibits96: Data Table on Middle East and Africa - Year-over-year growth 2023-2028 (%)
- Exhibits97: Chart on US - Market size and forecast 2023-2028 ($ million)
- Exhibits98: Data Table on US - Market size and forecast 2023-2028 ($ million)
- Exhibits99: Chart on US - Year-over-year growth 2023-2028 (%)
- Exhibits100: Data Table on US - Year-over-year growth 2023-2028 (%)
- Exhibits101: Chart on Canada - Market size and forecast 2023-2028 ($ million)
- Exhibits102: Data Table on Canada - Market size and forecast 2023-2028 ($ million)
- Exhibits103: Chart on Canada - Year-over-year growth 2023-2028 (%)
- Exhibits104: Data Table on Canada - Year-over-year growth 2023-2028 (%)
- Exhibits105: Chart on UK - Market size and forecast 2023-2028 ($ million)
- Exhibits106: Data Table on UK - Market size and forecast 2023-2028 ($ million)
- Exhibits107: Chart on UK - Year-over-year growth 2023-2028 (%)
- Exhibits108: Data Table on UK - Year-over-year growth 2023-2028 (%)
- Exhibits109: Chart on China - Market size and forecast 2023-2028 ($ million)
- Exhibits110: Data Table on China - Market size and forecast 2023-2028 ($ million)
- Exhibits111: Chart on China - Year-over-year growth 2023-2028 (%)
- Exhibits112: Data Table on China - Year-over-year growth 2023-2028 (%)
- Exhibits113: Chart on Germany - Market size and forecast 2023-2028 ($ million)
- Exhibits114: Data Table on Germany - Market size and forecast 2023-2028 ($ million)
- Exhibits115: Chart on Germany - Year-over-year growth 2023-2028 (%)
- Exhibits116: Data Table on Germany - Year-over-year growth 2023-2028 (%)
- Exhibits117: Market opportunity By Geographical Landscape ($ million)
- Exhibits118: Data Tables on Market opportunity By Geographical Landscape ($ million)
- Exhibits119: Impact of drivers and challenges in 2023 and 2028
- Exhibits120: Overview on criticality of inputs and factors of differentiation
- Exhibits121: Overview on factors of disruption
- Exhibits122: Impact of key risks on business
- Exhibits123: Companies covered
- Exhibits124: Matrix on companies position and classification
- Exhibits125: Acronis International GmbH - Overview
- Exhibits126: Acronis International GmbH - Product / Service
- Exhibits127: Acronis International GmbH - Key offerings
- Exhibits128: Actifio Inc. - Overview
- Exhibits129: Actifio Inc. - Product / Service
- Exhibits130: Actifio Inc. - Key offerings
- Exhibits131: Arcserve USA LLC - Overview
- Exhibits132: Arcserve USA LLC - Product / Service
- Exhibits133: Arcserve USA LLC - Key offerings
- Exhibits134: Asigra Inc. - Overview
- Exhibits135: Asigra Inc. - Product / Service
- Exhibits136: Asigra Inc. - Key offerings
- Exhibits137: Carbonite Inc. - Overview
- Exhibits138: Carbonite Inc. - Product / Service
- Exhibits139: Carbonite Inc. - Key offerings
- Exhibits140: Commvault Systems Inc. - Overview
- Exhibits141: Commvault Systems Inc. - Product / Service
- Exhibits142: Commvault Systems Inc. - Key news
- Exhibits143: Commvault Systems Inc. - Key offerings
- Exhibits144: Datto Holdings Corp. - Overview
- Exhibits145: Datto Holdings Corp. - Product / Service
- Exhibits146: Datto Holdings Corp. - Key offerings
- Exhibits147: Hewlett Packard Enterprise Co. - Overview
- Exhibits148: Hewlett Packard Enterprise Co. - Business segments
- Exhibits149: Hewlett Packard Enterprise Co. - Key news
- Exhibits150: Hewlett Packard Enterprise Co. - Key offerings
- Exhibits151: Hewlett Packard Enterprise Co. - Segment focus
- Exhibits152: International Business Machines Corp. - Overview
- Exhibits153: International Business Machines Corp. - Business segments
- Exhibits154: International Business Machines Corp. - Key news
- Exhibits155: International Business Machines Corp. - Key offerings
- Exhibits156: International Business Machines Corp. - Segment focus
- Exhibits157: Microsoft Corp. - Overview
- Exhibits158: Microsoft Corp. - Business segments
- Exhibits159: Microsoft Corp. - Key news
- Exhibits160: Microsoft Corp. - Key offerings
- Exhibits161: Microsoft Corp. - Segment focus
- Exhibits162: N able Solutions ULC and N able Technologies Ltd. - Overview
- Exhibits163: N able Solutions ULC and N able Technologies Ltd. - Product / Service
- Exhibits164: N able Solutions ULC and N able Technologies Ltd. - Key offerings
- Exhibits165: Rackspace Technology Inc. - Overview
- Exhibits166: Rackspace Technology Inc. - Business segments
- Exhibits167: Rackspace Technology Inc. - Key news
- Exhibits168: Rackspace Technology Inc. - Key offerings
- Exhibits169: Rackspace Technology Inc. - Segment focus
- Exhibits170: Redstor - Overview
- Exhibits171: Redstor - Product / Service
- Exhibits172: Redstor - Key offerings
- Exhibits173: Veeam Software Group GmbH - Overview
- Exhibits174: Veeam Software Group GmbH - Product / Service
- Exhibits175: Veeam Software Group GmbH - Key offerings
- Exhibits176: Veritas Technologies LLC - Overview
- Exhibits177: Veritas Technologies LLC - Product / Service
- Exhibits178: Veritas Technologies LLC - Key offerings
- Exhibits179: Inclusions checklist
- Exhibits180: Exclusions checklist
- Exhibits181: Currency conversion rates for US$
- Exhibits182: Research methodology
- Exhibits183: Information sources
- Exhibits184: Data validation
- Exhibits185: Validation techniques employed for market sizing
- Exhibits186: Data synthesis
- Exhibits187: 360 degree market analysis
- Exhibits188: List of abbreviations
The cloud backup and recovery market is forecasted to grow by USD 33820.4 mn during 2023-2028, accelerating at a CAGR of 23.31% during the forecast period. The report on the cloud backup and recovery market provides a holistic analysis, market size and forecast, trends, growth drivers, and challenges, as well as vendor analysis covering around 25 vendors.
The report offers an up-to-date analysis regarding the current market scenario, the latest trends and drivers, and the overall market environment. The market is driven by reduction in it expenditure, increasing demand for cloud-based applications, and stringent security rules and regulations to secure customer data.
Technavio's cloud backup and recovery market is segmented as below:
| Market Scope | |
|---|---|
| Base Year | 2024 |
| End Year | 2028 |
| Series Year | 2024-2028 |
| Growth Momentum | Accelerate |
| YOY 2024 | 18.59% |
| CAGR | 23.31% |
| Incremental Value | $33820.4mn |
BySector
- ICT
- Manufacturing
- BFSI
- Healthcare
- Others
ByEnd-user
- Large enterprises
- SMEs
ByGeography
- North America
- Europe
- APAC
- South America
- Middle East and Africa
This study identifies the rise in cloud security applications as one of the prime reasons driving the cloud backup and recovery market growth during the next few years. Also, expansion of cloud computing models and multi-cloud services gaining traction will lead to sizable demand in the market.
The report on the cloud backup and recovery market covers the following areas:
- Cloud backup and recovery market sizing
- Cloud backup and recovery market forecast
- Cloud backup and recovery market industry analysis
The robust vendor analysis is designed to help clients improve their market position, and in line with this, this report provides a detailed analysis of several leading cloud backup and recovery market vendors that include Acronis International GmbH, Actifio Inc., Alphabet Inc., Arcserve USA LLC, Asigra Inc., Carbonite Inc., Cohesity Inc., Commvault Systems Inc., Datto Holdings Corp., Hewlett Packard Enterprise Co., International Business Machines Corp., Microsoft Corp., N able Solutions ULC and N able Technologies Ltd., NetApp Inc., Oracle Corp., Quest Technology Management, Rackspace Technology Inc., Redstor, Unitrends Inc., Veeam Software Group GmbH, and Veritas Technologies LLC. Also, the cloud backup and recovery market analysis report includes information on upcoming trends and challenges that will influence market growth. This is to help companies strategize and leverage all forthcoming growth opportunities.
The study was conducted using an objective combination of primary and secondary information including inputs from key participants in the industry. The report contains a comprehensive market and vendor landscape in addition to an analysis of the key vendors.
The publisher presents a detailed picture of the market by the way of study, synthesis, and summation of data from multiple sources by an analysis of key parameters such as profit, pricing, competition, and promotions. It presents various market facets by identifying the key industry influencers. The data presented is comprehensive, reliable, and a result of extensive research - both primary and secondary. The market research reports provide a complete competitive landscape and an in-depth vendor selection methodology and analysis using qualitative and quantitative research to forecast the accurate market growth.
Table of Contents
1 Executive Summary
- 1.1 Market overview
- Executive Summary - Chart on Market Overview
- Executive Summary - Data Table on Market Overview
- Executive Summary - Chart on Global Market Characteristics
- Executive Summary - Chart on Market By Geographical Landscape
- Executive Summary - Chart on Market Segmentation by Sector
- Executive Summary - Chart on Market Segmentation by End-user
- Executive Summary - Chart on Incremental Growth
- Executive Summary - Data Table on Incremental Growth
- Executive Summary - Chart on Company Market Positioning
2 Market Landscape
- 2.1 Market ecosystem
- Parent Market
- Data Table on - Parent Market
- 2.2 Market characteristics
- Market characteristics analysis
- 2.3 Value chain analysis
- Value Chain Analysis
3 Market Sizing
- 3.1 Market definition
- Offerings of companies included in the market definition
- 3.2 Market segment analysis
- Market segments
- 3.3 Market size 2023
- 3.4 Market outlook: Forecast for 2023-2028
- Chart on Global - Market size and forecast 2023-2028 ($ million)
- Data Table on Global - Market size and forecast 2023-2028 ($ million)
- Chart on Global Market: Year-over-year growth 2023-2028 (%)
- Data Table on Global Market: Year-over-year growth 2023-2028 (%)
4 Historic Market Size
- 4.1 Global Cloud Backup And Recovery Market 2018 - 2022
- Historic Market Size - Data Table on Global Cloud Backup And Recovery Market 2018 - 2022 ($ million)
- 4.2 Sector segment analysis 2018 - 2022
- Historic Market Size - Sector Segment 2018 - 2022 ($ million)
- 4.3 End-user segment analysis 2018 - 2022
- Historic Market Size - End-user Segment 2018 - 2022 ($ million)
- 4.4 Geography segment analysis 2018 - 2022
- Historic Market Size - Geography Segment 2018 - 2022 ($ million)
- 4.5 Country segment analysis 2018 - 2022
- Historic Market Size - Country Segment 2018 - 2022 ($ million)
5 Five Forces Analysis
- 5.1 Five forces summary
- Five forces analysis - Comparison between 2023 and 2028
- 5.2 Bargaining power of buyers
- Bargaining power of buyers - Impact of key factors 2023 and 2028
- 5.3 Bargaining power of suppliers
- Bargaining power of suppliers - Impact of key factors in 2023 and 2028
- 5.4 Threat of new entrants
- Threat of new entrants - Impact of key factors in 2023 and 2028
- 5.5 Threat of substitutes
- Threat of substitutes - Impact of key factors in 2023 and 2028
- 5.6 Threat of rivalry
- Threat of rivalry - Impact of key factors in 2023 and 2028
- 5.7 Market condition
- Chart on Market condition - Five forces 2023 and 2028
6 Market Segmentation by Sector
- 6.1 Market segments
- Chart on Sector - Market share 2023-2028 (%)
- Data Table on Sector - Market share 2023-2028 (%)
- 6.2 Comparison by Sector
- Chart on Comparison by Sector
- Data Table on Comparison by Sector
- 6.3 ICT - Market size and forecast 2023-2028
- Chart on ICT - Market size and forecast 2023-2028 ($ million)
- Data Table on ICT - Market size and forecast 2023-2028 ($ million)
- Chart on ICT - Year-over-year growth 2023-2028 (%)
- Data Table on ICT - Year-over-year growth 2023-2028 (%)
- 6.4 Manufacturing - Market size and forecast 2023-2028
- Chart on Manufacturing - Market size and forecast 2023-2028 ($ million)
- Data Table on Manufacturing - Market size and forecast 2023-2028 ($ million)
- Chart on Manufacturing - Year-over-year growth 2023-2028 (%)
- Data Table on Manufacturing - Year-over-year growth 2023-2028 (%)
- 6.5 BFSI - Market size and forecast 2023-2028
- Chart on BFSI - Market size and forecast 2023-2028 ($ million)
- Data Table on BFSI - Market size and forecast 2023-2028 ($ million)
- Chart on BFSI - Year-over-year growth 2023-2028 (%)
- Data Table on BFSI - Year-over-year growth 2023-2028 (%)
- 6.6 Healthcare - Market size and forecast 2023-2028
- Chart on Healthcare - Market size and forecast 2023-2028 ($ million)
- Data Table on Healthcare - Market size and forecast 2023-2028 ($ million)
- Chart on Healthcare - Year-over-year growth 2023-2028 (%)
- Data Table on Healthcare - Year-over-year growth 2023-2028 (%)
- 6.7 Others - Market size and forecast 2023-2028
- Chart on Others - Market size and forecast 2023-2028 ($ million)
- Data Table on Others - Market size and forecast 2023-2028 ($ million)
- Chart on Others - Year-over-year growth 2023-2028 (%)
- Data Table on Others - Year-over-year growth 2023-2028 (%)
- 6.8 Market opportunity by Sector
- Market opportunity by Sector ($ million)
- Data Table on Market opportunity by Sector ($ million)
7 Market Segmentation by End-user
- 7.1 Market segments
- Chart on End-user - Market share 2023-2028 (%)
- Data Table on End-user - Market share 2023-2028 (%)
- 7.2 Comparison by End-user
- Chart on Comparison by End-user
- Data Table on Comparison by End-user
- 7.3 Large enterprises - Market size and forecast 2023-2028
- Chart on Large enterprises - Market size and forecast 2023-2028 ($ million)
- Data Table on Large enterprises - Market size and forecast 2023-2028 ($ million)
- Chart on Large enterprises - Year-over-year growth 2023-2028 (%)
- Data Table on Large enterprises - Year-over-year growth 2023-2028 (%)
- 7.4 SMEs - Market size and forecast 2023-2028
- Chart on SMEs - Market size and forecast 2023-2028 ($ million)
- Data Table on SMEs - Market size and forecast 2023-2028 ($ million)
- Chart on SMEs - Year-over-year growth 2023-2028 (%)
- Data Table on SMEs - Year-over-year growth 2023-2028 (%)
- 7.5 Market opportunity by End-user
- Market opportunity by End-user ($ million)
- Data Table on Market opportunity by End-user ($ million)
8 Customer Landscape
- 8.1 Customer landscape overview
- Analysis of price sensitivity, lifecycle, customer purchase basket, adoption rates, and purchase criteria
9 Geographic Landscape
- 9.1 Geographic segmentation
- Chart on Market share By Geographical Landscape 2023-2028 (%)
- Data Table on Market share By Geographical Landscape 2023-2028 (%)
- 9.2 Geographic comparison
- Chart on Geographic comparison
- Data Table on Geographic comparison
- 9.3 North America - Market size and forecast 2023-2028
- Chart on North America - Market size and forecast 2023-2028 ($ million)
- Data Table on North America - Market size and forecast 2023-2028 ($ million)
- Chart on North America - Year-over-year growth 2023-2028 (%)
- Data Table on North America - Year-over-year growth 2023-2028 (%)
- 9.4 Europe - Market size and forecast 2023-2028
- Chart on Europe - Market size and forecast 2023-2028 ($ million)
- Data Table on Europe - Market size and forecast 2023-2028 ($ million)
- Chart on Europe - Year-over-year growth 2023-2028 (%)
- Data Table on Europe - Year-over-year growth 2023-2028 (%)
- 9.5 APAC - Market size and forecast 2023-2028
- Chart on APAC - Market size and forecast 2023-2028 ($ million)
- Data Table on APAC - Market size and forecast 2023-2028 ($ million)
- Chart on APAC - Year-over-year growth 2023-2028 (%)
- Data Table on APAC - Year-over-year growth 2023-2028 (%)
- 9.6 South America - Market size and forecast 2023-2028
- Chart on South America - Market size and forecast 2023-2028 ($ million)
- Data Table on South America - Market size and forecast 2023-2028 ($ million)
- Chart on South America - Year-over-year growth 2023-2028 (%)
- Data Table on South America - Year-over-year growth 2023-2028 (%)
- 9.7 Middle East and Africa - Market size and forecast 2023-2028
- Chart on Middle East and Africa - Market size and forecast 2023-2028 ($ million)
- Data Table on Middle East and Africa - Market size and forecast 2023-2028 ($ million)
- Chart on Middle East and Africa - Year-over-year growth 2023-2028 (%)
- Data Table on Middle East and Africa - Year-over-year growth 2023-2028 (%)
- 9.8 US - Market size and forecast 2023-2028
- Chart on US - Market size and forecast 2023-2028 ($ million)
- Data Table on US - Market size and forecast 2023-2028 ($ million)
- Chart on US - Year-over-year growth 2023-2028 (%)
- Data Table on US - Year-over-year growth 2023-2028 (%)
- 9.9 Canada - Market size and forecast 2023-2028
- Chart on Canada - Market size and forecast 2023-2028 ($ million)
- Data Table on Canada - Market size and forecast 2023-2028 ($ million)
- Chart on Canada - Year-over-year growth 2023-2028 (%)
- Data Table on Canada - Year-over-year growth 2023-2028 (%)
- 9.10 UK - Market size and forecast 2023-2028
- Chart on UK - Market size and forecast 2023-2028 ($ million)
- Data Table on UK - Market size and forecast 2023-2028 ($ million)
- Chart on UK - Year-over-year growth 2023-2028 (%)
- Data Table on UK - Year-over-year growth 2023-2028 (%)
- 9.11 China - Market size and forecast 2023-2028
- Chart on China - Market size and forecast 2023-2028 ($ million)
- Data Table on China - Market size and forecast 2023-2028 ($ million)
- Chart on China - Year-over-year growth 2023-2028 (%)
- Data Table on China - Year-over-year growth 2023-2028 (%)
- 9.12 Germany - Market size and forecast 2023-2028
- Chart on Germany - Market size and forecast 2023-2028 ($ million)
- Data Table on Germany - Market size and forecast 2023-2028 ($ million)
- Chart on Germany - Year-over-year growth 2023-2028 (%)
- Data Table on Germany - Year-over-year growth 2023-2028 (%)
- 9.13 Market opportunity By Geographical Landscape
- Market opportunity By Geographical Landscape ($ million)
- Data Tables on Market opportunity By Geographical Landscape ($ million)
10 Drivers, Challenges, and Opportunity/Restraints
- 10.1 Market drivers
- 10.2 Market challenges
- 10.3 Impact of drivers and challenges
- Impact of drivers and challenges in 2023 and 2028
- 10.4 Market opportunities/restraints
11 Competitive Landscape
- 11.1 Overview
- 11.2 Competitive Landscape
- Overview on criticality of inputs and factors of differentiation
- 11.3 Landscape disruption
- Overview on factors of disruption
- 11.4 Industry risks
- Impact of key risks on business
12 Competitive Analysis
- 12.1 Companies profiled
- Companies covered
- 12.2 Market positioning of companies
- Matrix on companies position and classification
- 12.3 Acronis International GmbH
- Acronis International GmbH - Overview
- Acronis International GmbH - Product / Service
- Acronis International GmbH - Key offerings
- 12.4 Actifio Inc.
- Actifio Inc. - Overview
- Actifio Inc. - Product / Service
- Actifio Inc. - Key offerings
- 12.5 Arcserve USA LLC
- Arcserve USA LLC - Overview
- Arcserve USA LLC - Product / Service
- Arcserve USA LLC - Key offerings
- 12.6 Asigra Inc.
- Asigra Inc. - Overview
- Asigra Inc. - Product / Service
- Asigra Inc. - Key offerings
- 12.7 Carbonite Inc.
- Carbonite Inc. - Overview
- Carbonite Inc. - Product / Service
- Carbonite Inc. - Key offerings
- 12.8 Commvault Systems Inc.
- Commvault Systems Inc. - Overview
- Commvault Systems Inc. - Product / Service
- Commvault Systems Inc. - Key news
- Commvault Systems Inc. - Key offerings
- 12.9 Datto Holdings Corp.
- Datto Holdings Corp. - Overview
- Datto Holdings Corp. - Product / Service
- Datto Holdings Corp. - Key offerings
- 12.10 Hewlett Packard Enterprise Co.
- Hewlett Packard Enterprise Co. - Overview
- Hewlett Packard Enterprise Co. - Business segments
- Hewlett Packard Enterprise Co. - Key news
- Hewlett Packard Enterprise Co. - Key offerings
- Hewlett Packard Enterprise Co. - Segment focus
- 12.11 International Business Machines Corp.
- International Business Machines Corp. - Overview
- International Business Machines Corp. - Business segments
- International Business Machines Corp. - Key news
- International Business Machines Corp. - Key offerings
- International Business Machines Corp. - Segment focus
- 12.12 Microsoft Corp.
- Microsoft Corp. - Overview
- Microsoft Corp. - Business segments
- Microsoft Corp. - Key news
- Microsoft Corp. - Key offerings
- Microsoft Corp. - Segment focus
- 12.13 N able Solutions ULC and N able Technologies Ltd.
- N able Solutions ULC and N able Technologies Ltd. - Overview
- N able Solutions ULC and N able Technologies Ltd. - Product / Service
- N able Solutions ULC and N able Technologies Ltd. - Key offerings
- 12.14 Rackspace Technology Inc.
- Rackspace Technology Inc. - Overview
- Rackspace Technology Inc. - Business segments
- Rackspace Technology Inc. - Key news
- Rackspace Technology Inc. - Key offerings
- Rackspace Technology Inc. - Segment focus
- 12.15 Redstor
- Redstor - Overview
- Redstor - Product / Service
- Redstor - Key offerings
- 12.16 Veeam Software Group GmbH
- Veeam Software Group GmbH - Overview
- Veeam Software Group GmbH - Product / Service
- Veeam Software Group GmbH - Key offerings
- 12.17 Veritas Technologies LLC
- Veritas Technologies LLC - Overview
- Veritas Technologies LLC - Product / Service
- Veritas Technologies LLC - Key offerings
13 Appendix
- 13.1 Scope of the report
- 13.2 Inclusions and exclusions checklist
- Inclusions checklist
- Exclusions checklist
- 13.3 Currency conversion rates for US$
- Currency conversion rates for US$
- 13.4 Research methodology
- Research methodology
- 13.5 Data procurement
- Information sources
- 13.6 Data validation
- Data validation
- 13.7 Validation techniques employed for market sizing
- Validation techniques employed for market sizing
- 13.8 Data synthesis
- Data synthesis
- 13.9 360 degree market analysis
- 360 degree market analysis
- 13.10 List of abbreviations
- List of abbreviations

