|
|
市場調査レポート
商品コード
1657128
通信産業におけるバッテリーの世界市場 2025~2029年Global Battery Market in Telecommunication Industry 2025-2029 |
||||||

|
|||||||
カスタマイズ可能
|
|||||||

| 通信産業におけるバッテリーの世界市場 2025~2029年 |
|
出版日: 2025年02月12日
発行: TechNavio
ページ情報: 英文 266 Pages
納期: 即納可能
|

全表示
- 概要
- 目次
通信産業におけるバッテリーの世界市場 2025~2029年
通信産業におけるバッテリーは2024~2029年に238億7,430万米ドル、予測期間中のCAGRは21.3%で成長すると予測されています。当レポートでは、通信産業におけるバッテリーの全体的な分析、市場規模・予測、動向、成長促進要因、課題、約25のベンダーを網羅したベンダー分析などを掲載しています。
現在の市場シナリオ、最新動向と促進要因、市場環境全体に関する最新分析を提供しています。電力消費の増加、環境に優しい通信塔への注目の高まり、データ利用の増加などが市場を牽引しています。
| 市場範囲 | |
|---|---|
| 基準年 | 2025年 |
| 終了年 | 2029年 |
| 予測期間 | 2025~2029年 |
| 成長モメンタム | 加速 |
| 前年比[2025年] | 17.3% |
| CAGR | 21.3% |
| 増分額 | 238億7,430万米ドル |
本調査は、産業の主要参加者からのインプットを含め、一次情報と二次情報を客観的に組み合わせて実施しました。レポートには、主要企業の分析に加え、包括的な市場規模データ、地域別分析によるセグメント、ベンダー情勢が含まれています。レポートには過去データと予測データがあります。
本調査では、今後数年間の通信産業におけるバッテリーの成長を促進する主要要因の1つとして、リチウムイオンバッテリー価格の下落を挙げています。また、地方電化のニーズの高まりと通信タワーの運営コストの高さが市場の大きな需要につながります。
目次
第1章 エグゼクティブサマリー
- 市場概要
第2章 Technavio分析
- 価格・ライフサイクル・顧客購入バスケット・採用率・購入基準の分析
- インプットの重要性と差別化の要因
- 混乱の要因
- 促進要因と課題の影響
第3章 市場情勢
- 市場エコシステム
- 市場の特徴
- バリューチェーン分析
第4章 市場規模
- 市場の定義
- 市場セグメント分析
- 市場規模 2024年
- 市場の展望 2024~2029年
第5章 市場規模実績
- 通信産業におけるバッテリーの世界市場 2019~2023年
- 容量セグメント分析 2019~2023年
- 製品別セグメント分析 2019~2023年
- 用途別セグメント分析 2019~2023年
- エンドユーザー別セグメント分析 2019~2023年
- 技術別セグメント分析 2019~2023年
- 地域別セグメント分析 2019~2023年
- 国別セグメント分析 2019~2023年
第6章 定性分析
- 通信産業における世界のバッテリー市場へのAIの影響
第7章 ファイブフォース分析
- ファイブフォースの要約
- 買い手の交渉力
- 供給企業の交渉力
- 新規参入業者の脅威
- 代替品の脅威
- 競争の脅威
- 市況
第8章 市場セグメンテーション:容量別
- 市場セグメント
- 比較:容量別
- 低い:市場規模と予測 2024~2029年
- 中くらい:市場規模と予測 2024~2029年
- 高い:市場規模と予測 2024~2029年
- 市場機会:容量別
第9章 市場セグメンテーション:製品別
- 市場セグメント
- 比較:製品別
- 鉛蓄バッテリー:市場規模と予測 2024~2029年
- リチウムイオンバッテリー:市場規模と予測 2024~2029年
- その他:市場規模と予測 2024~2029年
- 市場機会:製品別
第10章 市場セグメンテーション:用途別
- 市場セグメント
- 比較:用途別
- 基地局:市場規模と予測 2024~2029年
- データセンター:市場規模と予測 2024~2029年
- バックアップ電源システム:市場規模と予測 2024~2029年
- 小型セル:市場規模と予測 2024~2029年
- モバイルデバイス:市場規模と予測 2024~2029年
- 市場機会:用途別
第11章 市場セグメンテーション:エンドユーザー別
- 市場セグメント
- 比較:エンドユーザー別
- モバイルネットワーク事業者(MNO):市場規模と予測 2024~2029年
- インターネットサービスプロバイダー(ISP):市場規模と予測 2024~2029年
- データセンター運営者:市場規模と予測 2024~2029年
- 政府・企業:市場規模と予測 2024~2029年
- 市場機会:エンドユーザー別
第12章 市場セグメンテーション:技術別
- 市場セグメント
- 比較:技術別
- 伝統的:市場規模と予測 2024~2029年
- 先進的:市場規模と予測 2024~2029年
- 再生可能エネルギーの統合:市場規模と予測 2024~2029年
- 市場機会:技術別
第13章 顧客情勢
- 顧客情勢概要
第14章 地域別情勢
- 地域別セグメンテーション
- 比較:地域別
- アジア太平洋:市場規模と予測 2024~2029年
- 北米:市場規模と予測 2024~2029年
- 欧州:市場規模と予測 2024~2029年
- 中東・アフリカ:市場規模と予測 2024~2029年
- 南米:市場規模と予測 2024~2029年
- 米国:市場規模と予測 2024~2029年
- 日本:市場規模と予測 2024~2029年
- インド:市場規模と予測 2024~2029年
- 中国:市場規模と予測 2024~2029年
- ドイツ:市場規模と予測 2024~2029年
- カナダ:市場規模と予測 2024~2029年
- 英国:市場規模と予測 2024~2029年
- フランス:市場規模と予測 2024~2029年
- イタリア:市場規模と予測 2024~2029年
- ブラジル:市場規模と予測 2024~2029年
- 地域情勢による市場機会
第15章 促進要因・課題・機会・抑制要因
- 市場促進要因
- 市場課題
- 促進要因と課題の影響
- 市場機会・抑制要因
第16章 競合情勢
- 概要
- 競合情勢
- 混乱の状況
- 産業のリスク
第17章 競合分析
- 企業プロファイル
- 企業ランキング指数
- 企業の市場ポジショニング
- Accumulatorenwerke HOPPECKE Carl Zoellner and Sohn GmbH
- Amara Raja Batteries Ltd.
- C and D Technologies Inc.
- East Penn Manufacturing Co. Inc.
- EnerSys
- Exide Industries Ltd.
- GS Yuasa International Ltd.
- HBL Power Systems Ltd.
- Kabra Extrusiontechnik Ltd.
- Leoch International Technology Ltd.
- LG Corp.
- Panasonic Holdings Corp.
- Star Battery Ltd.
- Victron Energy BV
- Zhejiang Narada Power Source Co. Ltd.
第18章 付録
Battery Market In Telecommunication Industry 2025-2029
The battery market in telecommunication industry is forecasted to grow by USD 23874.3 million during 2024-2029, accelerating at a CAGR of 21.3% during the forecast period. The report on the battery market in telecommunication industry provides a holistic analysis, market size and forecast, trends, growth drivers, and challenges, as well as vendor analysis covering around 25 vendors.
The report offers an up-to-date analysis regarding the current market scenario, the latest trends and drivers, and the overall market environment. The market is driven by increase in power consumption, rising focus on green telecom towers, and rise in data usage.
| Market Scope | |
|---|---|
| Base Year | 2025 |
| End Year | 2029 |
| Series Year | 2025-2029 |
| Growth Momentum | Accelerate |
| YOY 2025 | 17.3% |
| CAGR | 21.3% |
| Incremental Value | $23874.3 mn |
The study was conducted using an objective combination of primary and secondary information including inputs from key participants in the industry. The report contains a comprehensive market size data, segment with regional analysis and vendor landscape in addition to an analysis of the key companies. Reports have historic and forecast data.
Technavio's battery market in telecommunication industry is segmented as below:
By Capacity
- Low
- Medium
- High
By Product
- Lead-acid battery
- Li-ion battery
- Others
By Application
- Base stations
- Data centers
- Backup power systems
- Small cells
- Mobile devices
By End-user
- Mobile network operators (MNOs)
- Internet service providers (ISPs)
- Data center operators
- Government/enterprises
By Technology
- Traditional
- Advanced
- Renewable integration
By Geographical Landscape
- APAC
- North America
- Europe
- Middle East and Africa
- South America
This study identifies the declining Li-ion battery prices as one of the prime reasons driving the battery market in telecommunication industry growth during the next few years. Also, increasing need for rural electrification and high operating costs of telecom towers will lead to sizable demand in the market.
The report on the battery market in telecommunication industry covers the following areas:
- Battery Market In Telecommunication Industry sizing
- Battery Market In Telecommunication Industry forecast
- Battery Market In Telecommunication Industry industry analysis
The robust vendor analysis is designed to help clients improve their market position, and in line with this, this report provides a detailed analysis of several leading battery market in telecommunication industry vendors that include Accumulatorenwerke HOPPECKE Carl Zoellner and Sohn GmbH, Amara Raja Batteries Ltd., C and D Technologies Inc., East Penn Manufacturing Co. Inc., EnerSys, Exide Industries Ltd., GS Yuasa International Ltd., HBL Power Systems Ltd., Kabra Extrusiontechnik Ltd., Leoch International Technology Ltd., LG Corp., Panasonic Holdings Corp., Star Battery Ltd., Victron Energy BV, and Zhejiang Narada Power Source Co. Ltd.. Also, the battery market in telecommunication industry analysis report includes information on upcoming trends and challenges that will influence market growth. This is to help companies strategize and leverage all forthcoming growth opportunities.
The publisher presents a detailed picture of the market by the way of study, synthesis, and summation of data from multiple sources by an analysis of key parameters such as profit, pricing, competition, and promotions. It presents various market facets by identifying the key industry influencers. The data presented is comprehensive, reliable, and a result of extensive primary and secondary research. The market research reports provide a complete competitive landscape and an in-depth vendor selection methodology and analysis using qualitative and quantitative research to forecast accurate market growth.
Table of Contents
1 Executive Summary
- 1.1 Market overview
- Executive Summary - Chart on Market Overview
- Executive Summary - Data Table on Market Overview
- Executive Summary - Chart on Global Market Characteristics
- Executive Summary - Chart on Market By Geographical Landscape
- Executive Summary - Chart on Market Segmentation by Capacity
- Executive Summary - Chart on Market Segmentation by Product
- Executive Summary - Chart on Market Segmentation by Application
- Executive Summary - Chart on Market Segmentation by End-user
- Executive Summary - Chart on Market Segmentation by Technology
- Executive Summary - Chart on Incremental Growth
- Executive Summary - Data Table on Incremental Growth
- Executive Summary - Chart on Company Market Positioning
2 Technavio Analysis
- 2.1 Analysis of price sensitivity, lifecycle, customer purchase basket, adoption rates, and purchase criteria
- Analysis of price sensitivity, lifecycle, customer purchase basket, adoption rates, and purchase criteria
- 2.2 Criticality of inputs and Factors of differentiation
- Overview on criticality of inputs and factors of differentiation
- 2.3 Factors of disruption
- Overview on factors of disruption
- 2.4 Impact of drivers and challenges
- Impact of drivers and challenges in 2024 and 2029
3 Market Landscape
- 3.1 Market ecosystem
- Parent Market
- Data Table on - Parent Market
- 3.2 Market characteristics
- Market characteristics analysis
- 3.3 Value chain analysis
- Value chain analysis
4 Market Sizing
- 4.1 Market definition
- Offerings of companies included in the market definition
- 4.2 Market segment analysis
- Market segments
- 4.3 Market size 2024
- 4.4 Market outlook: Forecast for 2024-2029
- Chart on Global - Market size and forecast 2024-2029 ($ million)
- Data Table on Global - Market size and forecast 2024-2029 ($ million)
- Chart on Global Market: Year-over-year growth 2024-2029 (%)
- Data Table on Global Market: Year-over-year growth 2024-2029 (%)
5 Historic Market Size
- 5.1 Global Battery Market In Telecommunication Industry 2019 - 2023
- Historic Market Size - Data Table on Global Battery Market In Telecommunication Industry 2019 - 2023 ($ million)
- 5.2 Capacity segment analysis 2019 - 2023
- Historic Market Size - Capacity Segment 2019 - 2023 ($ million)
- 5.3 Product segment analysis 2019 - 2023
- Historic Market Size - Product Segment 2019 - 2023 ($ million)
- 5.4 Application segment analysis 2019 - 2023
- Historic Market Size - Application Segment 2019 - 2023 ($ million)
- 5.5 End-user segment analysis 2019 - 2023
- Historic Market Size - End-user Segment 2019 - 2023 ($ million)
- 5.6 Technology segment analysis 2019 - 2023
- Historic Market Size - Technology Segment 2019 - 2023 ($ million)
- 5.7 Geography segment analysis 2019 - 2023
- Historic Market Size - Geography Segment 2019 - 2023 ($ million)
- 5.8 Country segment analysis 2019 - 2023
- Historic Market Size - Country Segment 2019 - 2023 ($ million)
6 Qualitative Analysis
- 6.1 Impact of AI in global battery market for the telecommunication industry
7 Five Forces Analysis
- 7.1 Five forces summary
- Five forces analysis - Comparison between 2024 and 2029
- 7.2 Bargaining power of buyers
- Bargaining power of buyers - Impact of key factors 2024 and 2029
- 7.3 Bargaining power of suppliers
- Bargaining power of suppliers - Impact of key factors in 2024 and 2029
- 7.4 Threat of new entrants
- Threat of new entrants - Impact of key factors in 2024 and 2029
- 7.5 Threat of substitutes
- Threat of substitutes - Impact of key factors in 2024 and 2029
- 7.6 Threat of rivalry
- Threat of rivalry - Impact of key factors in 2024 and 2029
- 7.7 Market condition
- Chart on Market condition - Five forces 2024 and 2029
8 Market Segmentation by Capacity
- 8.1 Market segments
- Chart on Capacity - Market share 2024-2029 (%)
- Data Table on Capacity - Market share 2024-2029 (%)
- 8.2 Comparison by Capacity
- Chart on Comparison by Capacity
- Data Table on Comparison by Capacity
- 8.3 Low - Market size and forecast 2024-2029
- Chart on Low - Market size and forecast 2024-2029 ($ million)
- Data Table on Low - Market size and forecast 2024-2029 ($ million)
- Chart on Low - Year-over-year growth 2024-2029 (%)
- Data Table on Low - Year-over-year growth 2024-2029 (%)
- 8.4 Medium - Market size and forecast 2024-2029
- Chart on Medium - Market size and forecast 2024-2029 ($ million)
- Data Table on Medium - Market size and forecast 2024-2029 ($ million)
- Chart on Medium - Year-over-year growth 2024-2029 (%)
- Data Table on Medium - Year-over-year growth 2024-2029 (%)
- 8.5 High - Market size and forecast 2024-2029
- Chart on High - Market size and forecast 2024-2029 ($ million)
- Data Table on High - Market size and forecast 2024-2029 ($ million)
- Chart on High - Year-over-year growth 2024-2029 (%)
- Data Table on High - Year-over-year growth 2024-2029 (%)
- 8.6 Market opportunity by Capacity
- Market opportunity by Capacity ($ million)
- Data Table on Market opportunity by Capacity ($ million)
9 Market Segmentation by Product
- 9.1 Market segments
- Chart on Product - Market share 2024-2029 (%)
- Data Table on Product - Market share 2024-2029 (%)
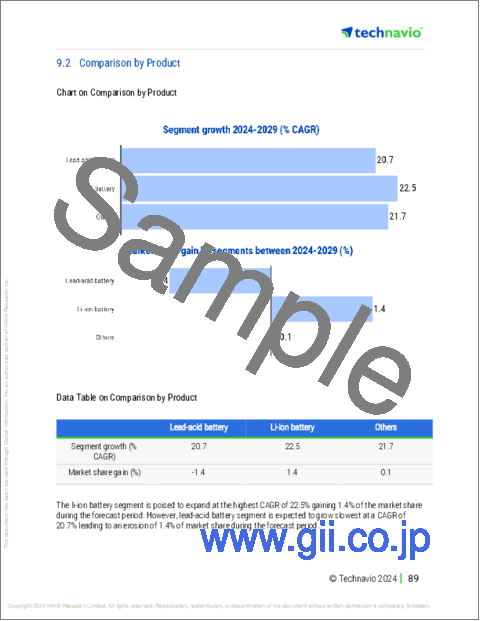
- 9.2 Comparison by Product
- Chart on Comparison by Product
- Data Table on Comparison by Product
- 9.3 Lead-acid battery - Market size and forecast 2024-2029
- Chart on Lead-acid battery - Market size and forecast 2024-2029 ($ million)
- Data Table on Lead-acid battery - Market size and forecast 2024-2029 ($ million)
- Chart on Lead-acid battery - Year-over-year growth 2024-2029 (%)
- Data Table on Lead-acid battery - Year-over-year growth 2024-2029 (%)
- 9.4 Li-ion battery - Market size and forecast 2024-2029
- Chart on Li-ion battery - Market size and forecast 2024-2029 ($ million)
- Data Table on Li-ion battery - Market size and forecast 2024-2029 ($ million)
- Chart on Li-ion battery - Year-over-year growth 2024-2029 (%)
- Data Table on Li-ion battery - Year-over-year growth 2024-2029 (%)
- 9.5 Others - Market size and forecast 2024-2029
- Chart on Others - Market size and forecast 2024-2029 ($ million)
- Data Table on Others - Market size and forecast 2024-2029 ($ million)
- Chart on Others - Year-over-year growth 2024-2029 (%)
- Data Table on Others - Year-over-year growth 2024-2029 (%)
- 9.6 Market opportunity by Product
- Market opportunity by Product ($ million)
- Data Table on Market opportunity by Product ($ million)
10 Market Segmentation by Application
- 10.1 Market segments
- Chart on Application - Market share 2024-2029 (%)
- Data Table on Application - Market share 2024-2029 (%)
- 10.2 Comparison by Application
- Chart on Comparison by Application
- Data Table on Comparison by Application
- 10.3 Base stations - Market size and forecast 2024-2029
- Chart on Base stations - Market size and forecast 2024-2029 ($ million)
- Data Table on Base stations - Market size and forecast 2024-2029 ($ million)
- Chart on Base stations - Year-over-year growth 2024-2029 (%)
- Data Table on Base stations - Year-over-year growth 2024-2029 (%)
- 10.4 Data centers - Market size and forecast 2024-2029
- Chart on Data centers - Market size and forecast 2024-2029 ($ million)
- Data Table on Data centers - Market size and forecast 2024-2029 ($ million)
- Chart on Data centers - Year-over-year growth 2024-2029 (%)
- Data Table on Data centers - Year-over-year growth 2024-2029 (%)
- 10.5 Backup power systems - Market size and forecast 2024-2029
- Chart on Backup power systems - Market size and forecast 2024-2029 ($ million)
- Data Table on Backup power systems - Market size and forecast 2024-2029 ($ million)
- Chart on Backup power systems - Year-over-year growth 2024-2029 (%)
- Data Table on Backup power systems - Year-over-year growth 2024-2029 (%)
- 10.6 Small cells - Market size and forecast 2024-2029
- Chart on Small cells - Market size and forecast 2024-2029 ($ million)
- Data Table on Small cells - Market size and forecast 2024-2029 ($ million)
- Chart on Small cells - Year-over-year growth 2024-2029 (%)
- Data Table on Small cells - Year-over-year growth 2024-2029 (%)
- 10.7 Mobile devices - Market size and forecast 2024-2029
- Chart on Mobile devices - Market size and forecast 2024-2029 ($ million)
- Data Table on Mobile devices - Market size and forecast 2024-2029 ($ million)
- Chart on Mobile devices - Year-over-year growth 2024-2029 (%)
- Data Table on Mobile devices - Year-over-year growth 2024-2029 (%)
- 10.8 Market opportunity by Application
- Market opportunity by Application ($ million)
- Data Table on Market opportunity by Application ($ million)
11 Market Segmentation by End-user
- 11.1 Market segments
- Chart on End-user - Market share 2024-2029 (%)
- Data Table on End-user - Market share 2024-2029 (%)
- 11.2 Comparison by End-user
- Chart on Comparison by End-user
- Data Table on Comparison by End-user
- 11.3 Mobile network operators (MNOs) - Market size and forecast 2024-2029
- Chart on Mobile network operators (MNOs) - Market size and forecast 2024-2029 ($ million)
- Data Table on Mobile network operators (MNOs) - Market size and forecast 2024-2029 ($ million)
- Chart on Mobile network operators (MNOs) - Year-over-year growth 2024-2029 (%)
- Data Table on Mobile network operators (MNOs) - Year-over-year growth 2024-2029 (%)
- 11.4 Internet service providers (ISPs) - Market size and forecast 2024-2029
- Chart on Internet service providers (ISPs) - Market size and forecast 2024-2029 ($ million)
- Data Table on Internet service providers (ISPs) - Market size and forecast 2024-2029 ($ million)
- Chart on Internet service providers (ISPs) - Year-over-year growth 2024-2029 (%)
- Data Table on Internet service providers (ISPs) - Year-over-year growth 2024-2029 (%)
- 11.5 Data center operators - Market size and forecast 2024-2029
- Chart on Data center operators - Market size and forecast 2024-2029 ($ million)
- Data Table on Data center operators - Market size and forecast 2024-2029 ($ million)
- Chart on Data center operators - Year-over-year growth 2024-2029 (%)
- Data Table on Data center operators - Year-over-year growth 2024-2029 (%)
- 11.6 Government/enterprises - Market size and forecast 2024-2029
- Chart on Government/enterprises - Market size and forecast 2024-2029 ($ million)
- Data Table on Government/enterprises - Market size and forecast 2024-2029 ($ million)
- Chart on Government/enterprises - Year-over-year growth 2024-2029 (%)
- Data Table on Government/enterprises - Year-over-year growth 2024-2029 (%)
- 11.7 Market opportunity by End-user
- Market opportunity by End-user ($ million)
- Data Table on Market opportunity by End-user ($ million)
12 Market Segmentation by Technology
- 12.1 Market segments
- Chart on Technology - Market share 2024-2029 (%)
- Data Table on Technology - Market share 2024-2029 (%)
- 12.2 Comparison by Technology
- Chart on Comparison by Technology
- Data Table on Comparison by Technology
- 12.3 Traditional - Market size and forecast 2024-2029
- Chart on Traditional - Market size and forecast 2024-2029 ($ million)
- Data Table on Traditional - Market size and forecast 2024-2029 ($ million)
- Chart on Traditional - Year-over-year growth 2024-2029 (%)
- Data Table on Traditional - Year-over-year growth 2024-2029 (%)
- 12.4 Advanced - Market size and forecast 2024-2029
- Chart on Advanced - Market size and forecast 2024-2029 ($ million)
- Data Table on Advanced - Market size and forecast 2024-2029 ($ million)
- Chart on Advanced - Year-over-year growth 2024-2029 (%)
- Data Table on Advanced - Year-over-year growth 2024-2029 (%)
- 12.5 Renewable integration - Market size and forecast 2024-2029
- Chart on Renewable integration - Market size and forecast 2024-2029 ($ million)
- Data Table on Renewable integration - Market size and forecast 2024-2029 ($ million)
- Chart on Renewable integration - Year-over-year growth 2024-2029 (%)
- Data Table on Renewable integration - Year-over-year growth 2024-2029 (%)
- 12.6 Market opportunity by Technology
- Market opportunity by Technology ($ million)
- Data Table on Market opportunity by Technology ($ million)
13 Customer Landscape
- 13.1 Customer landscape overview
- Analysis of price sensitivity, lifecycle, customer purchase basket, adoption rates, and purchase criteria
14 Geographic Landscape
- 14.1 Geographic segmentation
- Chart on Market share By Geographical Landscape 2024-2029 (%)
- Data Table on Market share By Geographical Landscape 2024-2029 (%)
- 14.2 Geographic comparison
- Chart on Geographic comparison
- Data Table on Geographic comparison
- 14.3 APAC - Market size and forecast 2024-2029
- Chart on APAC - Market size and forecast 2024-2029 ($ million)
- Data Table on APAC - Market size and forecast 2024-2029 ($ million)
- Chart on APAC - Year-over-year growth 2024-2029 (%)
- Data Table on APAC - Year-over-year growth 2024-2029 (%)
- 14.4 North America - Market size and forecast 2024-2029
- Chart on North America - Market size and forecast 2024-2029 ($ million)
- Data Table on North America - Market size and forecast 2024-2029 ($ million)
- Chart on North America - Year-over-year growth 2024-2029 (%)
- Data Table on North America - Year-over-year growth 2024-2029 (%)
- 14.5 Europe - Market size and forecast 2024-2029
- Chart on Europe - Market size and forecast 2024-2029 ($ million)
- Data Table on Europe - Market size and forecast 2024-2029 ($ million)
- Chart on Europe - Year-over-year growth 2024-2029 (%)
- Data Table on Europe - Year-over-year growth 2024-2029 (%)
- 14.6 Middle East and Africa - Market size and forecast 2024-2029
- Chart on Middle East and Africa - Market size and forecast 2024-2029 ($ million)
- Data Table on Middle East and Africa - Market size and forecast 2024-2029 ($ million)
- Chart on Middle East and Africa - Year-over-year growth 2024-2029 (%)
- Data Table on Middle East and Africa - Year-over-year growth 2024-2029 (%)
- 14.7 South America - Market size and forecast 2024-2029
- Chart on South America - Market size and forecast 2024-2029 ($ million)
- Data Table on South America - Market size and forecast 2024-2029 ($ million)
- Chart on South America - Year-over-year growth 2024-2029 (%)
- Data Table on South America - Year-over-year growth 2024-2029 (%)
- 14.8 US - Market size and forecast 2024-2029
- Chart on US - Market size and forecast 2024-2029 ($ million)
- Data Table on US - Market size and forecast 2024-2029 ($ million)
- Chart on US - Year-over-year growth 2024-2029 (%)
- Data Table on US - Year-over-year growth 2024-2029 (%)
- 14.9 Japan - Market size and forecast 2024-2029
- Chart on Japan - Market size and forecast 2024-2029 ($ million)
- Data Table on Japan - Market size and forecast 2024-2029 ($ million)
- Chart on Japan - Year-over-year growth 2024-2029 (%)
- Data Table on Japan - Year-over-year growth 2024-2029 (%)
- 14.10 India - Market size and forecast 2024-2029
- Chart on India - Market size and forecast 2024-2029 ($ million)
- Data Table on India - Market size and forecast 2024-2029 ($ million)
- Chart on India - Year-over-year growth 2024-2029 (%)
- Data Table on India - Year-over-year growth 2024-2029 (%)
- 14.11 China - Market size and forecast 2024-2029
- Chart on China - Market size and forecast 2024-2029 ($ million)
- Data Table on China - Market size and forecast 2024-2029 ($ million)
- Chart on China - Year-over-year growth 2024-2029 (%)
- Data Table on China - Year-over-year growth 2024-2029 (%)
- 14.12 Germany - Market size and forecast 2024-2029
- Chart on Germany - Market size and forecast 2024-2029 ($ million)
- Data Table on Germany - Market size and forecast 2024-2029 ($ million)
- Chart on Germany - Year-over-year growth 2024-2029 (%)
- Data Table on Germany - Year-over-year growth 2024-2029 (%)
- 14.13 Canada - Market size and forecast 2024-2029
- Chart on Canada - Market size and forecast 2024-2029 ($ million)
- Data Table on Canada - Market size and forecast 2024-2029 ($ million)
- Chart on Canada - Year-over-year growth 2024-2029 (%)
- Data Table on Canada - Year-over-year growth 2024-2029 (%)
- 14.14 UK - Market size and forecast 2024-2029
- Chart on UK - Market size and forecast 2024-2029 ($ million)
- Data Table on UK - Market size and forecast 2024-2029 ($ million)
- Chart on UK - Year-over-year growth 2024-2029 (%)
- Data Table on UK - Year-over-year growth 2024-2029 (%)
- 14.15 France - Market size and forecast 2024-2029
- Chart on France - Market size and forecast 2024-2029 ($ million)
- Data Table on France - Market size and forecast 2024-2029 ($ million)
- Chart on France - Year-over-year growth 2024-2029 (%)
- Data Table on France - Year-over-year growth 2024-2029 (%)
- 14.16 Italy - Market size and forecast 2024-2029
- Chart on Italy - Market size and forecast 2024-2029 ($ million)
- Data Table on Italy - Market size and forecast 2024-2029 ($ million)
- Chart on Italy - Year-over-year growth 2024-2029 (%)
- Data Table on Italy - Year-over-year growth 2024-2029 (%)
- 14.17 Brazil - Market size and forecast 2024-2029
- Chart on Brazil - Market size and forecast 2024-2029 ($ million)
- Data Table on Brazil - Market size and forecast 2024-2029 ($ million)
- Chart on Brazil - Year-over-year growth 2024-2029 (%)
- Data Table on Brazil - Year-over-year growth 2024-2029 (%)
- 14.18 Market opportunity By Geographical Landscape
- Market opportunity By Geographical Landscape ($ million)
- Data Tables on Market opportunity By Geographical Landscape ($ million)
15 Drivers, Challenges, and Opportunity/Restraints
- 15.1 Market drivers
- 15.2 Market challenges
- 15.3 Impact of drivers and challenges
- Impact of drivers and challenges in 2024 and 2029
- 15.4 Market opportunities/restraints
16 Competitive Landscape
- 16.1 Overview
- 16.2 Competitive Landscape
- Overview on criticality of inputs and factors of differentiation
- 16.3 Landscape disruption
- Overview on factors of disruption
- 16.4 Industry risks
- Impact of key risks on business
17 Competitive Analysis
- 17.1 Companies profiled
- Companies covered
- 17.2 Company ranking index
- Company ranking index
- 17.3 Market positioning of companies
- Matrix on companies position and classification
- 17.4 Accumulatorenwerke HOPPECKE Carl Zoellner and Sohn GmbH
- Accumulatorenwerke HOPPECKE Carl Zoellner and Sohn GmbH - Overview
- Accumulatorenwerke HOPPECKE Carl Zoellner and Sohn GmbH - Product / Service
- Accumulatorenwerke HOPPECKE Carl Zoellner and Sohn GmbH - Key offerings
- SWOT
- 17.5 Amara Raja Batteries Ltd.
- Amara Raja Batteries Ltd. - Overview
- Amara Raja Batteries Ltd. - Product / Service
- Amara Raja Batteries Ltd. - Key offerings
- SWOT
- 17.6 C and D Technologies Inc.
- C and D Technologies Inc. - Overview
- C and D Technologies Inc. - Product / Service
- C and D Technologies Inc. - Key offerings
- SWOT
- 17.7 East Penn Manufacturing Co. Inc.
- East Penn Manufacturing Co. Inc. - Overview
- East Penn Manufacturing Co. Inc. - Product / Service
- East Penn Manufacturing Co. Inc. - Key news
- East Penn Manufacturing Co. Inc. - Key offerings
- SWOT
- 17.8 EnerSys
- EnerSys - Overview
- EnerSys - Business segments
- EnerSys - Key news
- EnerSys - Key offerings
- EnerSys - Segment focus
- SWOT
- 17.9 Exide Industries Ltd.
- Exide Industries Ltd. - Overview
- Exide Industries Ltd. - Product / Service
- Exide Industries Ltd. - Key news
- Exide Industries Ltd. - Key offerings
- SWOT
- 17.10 GS Yuasa International Ltd.
- GS Yuasa International Ltd. - Overview
- GS Yuasa International Ltd. - Business segments
- GS Yuasa International Ltd. - Key news
- GS Yuasa International Ltd. - Key offerings
- GS Yuasa International Ltd. - Segment focus
- SWOT
- 17.11 HBL Power Systems Ltd.
- HBL Power Systems Ltd. - Overview
- HBL Power Systems Ltd. - Business segments
- HBL Power Systems Ltd. - Key offerings
- HBL Power Systems Ltd. - Segment focus
- SWOT
- 17.12 Kabra Extrusiontechnik Ltd.
- Kabra Extrusiontechnik Ltd. - Overview
- Kabra Extrusiontechnik Ltd. - Product / Service
- Kabra Extrusiontechnik Ltd. - Key offerings
- SWOT
- 17.13 Leoch International Technology Ltd.
- Leoch International Technology Ltd. - Overview
- Leoch International Technology Ltd. - Product / Service
- Leoch International Technology Ltd. - Key offerings
- SWOT
- 17.14 LG Corp.
- LG Corp. - Overview
- LG Corp. - Product / Service
- LG Corp. - Key offerings
- SWOT
- 17.15 Panasonic Holdings Corp.
- Panasonic Holdings Corp. - Overview
- Panasonic Holdings Corp. - Business segments
- Panasonic Holdings Corp. - Key news
- Panasonic Holdings Corp. - Key offerings
- Panasonic Holdings Corp. - Segment focus
- SWOT
- 17.16 Star Battery Ltd.
- Star Battery Ltd. - Overview
- Star Battery Ltd. - Product / Service
- Star Battery Ltd. - Key offerings
- SWOT
- 17.17 Victron Energy BV
- Victron Energy BV - Overview
- Victron Energy BV - Product / Service
- Victron Energy BV - Key offerings
- SWOT
- 17.18 Zhejiang Narada Power Source Co. Ltd.
- Zhejiang Narada Power Source Co. Ltd. - Overview
- Zhejiang Narada Power Source Co. Ltd. - Business segments
- Zhejiang Narada Power Source Co. Ltd. - Key offerings
- Zhejiang Narada Power Source Co. Ltd. - Segment focus
- SWOT
18 Appendix
- 18.1 Scope of the report
- 18.2 Inclusions and exclusions checklist
- Inclusions checklist
- Exclusions checklist
- 18.3 Currency conversion rates for US$
- Currency conversion rates for US$
- 18.4 Research methodology
- Research methodology
- 18.5 Data procurement
- Information sources
- 18.6 Data validation
- Data validation
- 18.7 Validation techniques employed for market sizing
- Validation techniques employed for market sizing
- 18.8 Data synthesis
- Data synthesis
- 18.9 360 degree market analysis
- 360 degree market analysis
- 18.10 List of abbreviations
- List of abbreviations
