|
|
市場調査レポート
商品コード
1502094
液状シリコーンゴムの世界市場 2024-2028Global liquid silicone rubber market 2024-2028 |
||||||
|
|||||||
カスタマイズ可能
|
|||||||

| 液状シリコーンゴムの世界市場 2024-2028 |
|
出版日: 2024年05月17日
発行: TechNavio
ページ情報: 英文 180 Pages
納期: 即納可能
|

全表示
- 概要
- 図表
- 目次
液状シリコーンゴム市場は2023-2028年に16億5,240万米ドル、予測期間中のCAGRは9.63%で成長すると予測されます。
当レポートでは、液状シリコーンゴム市場の全体的な分析、市場規模・予測、動向、成長促進要因、課題、約25のベンダーを網羅したベンダー分析などを掲載しています。
現在の市場シナリオ、最新動向と促進要因、市場環境全体に関する最新分析を提供しています。市場は、新興国におけるインフラへの高投資、軽量素材への需要の高まり、股関節および膝関節インプラントの高い普及率などが牽引しています。
| 市場範囲 | |
|---|---|
| 基準年 | 2024 |
| 終了年 | 2028 |
| 予測期間 | 2024-2028 |
| 成長モメンタム | 加速 |
| 前年比2024年 | 8.56% |
| CAGR | 9.63% |
| 増分額 | 16億5,240万米ドル |
本調査では、今後数年間の液状シリコーンゴム市場成長を牽引する主要因の1つとして、光学用途における透明LSRエラストマー需要の高さを挙げています。また、抗菌LSR-シリコーンエラストマーや医療ツーリズムの拡大も市場の大きな需要につながります。
目次
第1章 エグゼクティブサマリー
- 市場概要
第2章 市場情勢
- 市場エコシステム
- 市場の特徴
- バリューチェーン分析
第3章 市場規模の評価
- 市場の定義
- 市場セグメント分析
- 市場規模 2023
- 市場の見通し 2023-2028
第4章 市場規模実績
- 世界の液状シリコーンゴム市場 2018-2022
- グレードタイプ別セグメント分析 2018-2022
- 用途別セグメント分析 2018-2022
- 地域別セグメント分析 2018-2022
- 国別セグメント分析 2018-2022
第5章 ファイブフォース分析
- ファイブフォースの要約
- 買い手の交渉力
- 供給企業の交渉力
- 新規参入業者の脅威
- 代替品の脅威
- 競争の脅威
- 市況
第6章 市場セグメンテーション:グレードタイプ別
- 市場セグメンテーション
- 比較:グレードタイプ別
- 産業:市場規模と予測 2023-2028
- 医療:市場規模と予測 2023-2028
- 食品:市場規模と予測 2023-2028
- 市場機会:グレードタイプ別
第7章 市場セグメンテーション:用途別
- 市場セグメンテーション
- 比較:用途別
- 自動車:市場規模と予測 2023-2028
- 医療:市場規模と予測 2023-2028
- 電気・電子:市場規模と予測 2023-2028
- 消費財:市場規模と予測 2023-2028
- その他:市場規模と予測 2023-2028
- 市場機会:用途別
第8章 顧客情勢
- 顧客情勢の概要
第9章 地域別情勢
- 地域別セグメンテーション
- 地域別比較
- 北米:市場規模と予測 2023-2028
- 欧州:市場規模と予測 2023-2028
- アジア太平洋:市場規模と予測 2023-2028
- 中東・アフリカ:市場規模と予測 2023-2028
- 南米:市場規模と予測 2023-2028
- 米国:市場規模と予測 2023-2028
- 中国:市場規模と予測 2023-2028
- ドイツ:市場規模と予測 2023-2028
- カナダ:市場規模と予測 2023-2028
- 英国:市場規模と予測 2023-2028
- 市場機会:地域別
第10章 促進要因・課題・機会・抑制要因
- 市場促進要因
- 市場の課題
- 促進要因と課題の影響
- 市場の機会・抑制要因
第11章 競合情勢
- 概要
- 競合情勢
- 混乱の状況
- 業界のリスク
第12章 競合分析
- 企業プロファイル
- 企業の市場ポジショニング
- Avantor Inc.
- Dongguan New Orient Technology Co. Ltd
- Dow Chemical Co.
- Elkem ASA
- Mesgo Spa
- Momentive Performance Materials Inc.
- Newtop Silicone Manufacturer
- NTCB
- RD Rubber Technology Corp.
- REISS MANUFACTURING Inc.
- Shin Etsu Chemical Co. Ltd.
- SIMTEC Silicone Parts LLC
- Stockwell Elastomerics Inc.
- Wacker Chemie AG
- Wynca Group
第13章 付録
Exhibits:
- Exhibits1: Executive Summary - Chart on Market Overview
- Exhibits2: Executive Summary - Data Table on Market Overview
- Exhibits3: Executive Summary - Chart on Global Market Characteristics
- Exhibits4: Executive Summary - Chart on Market by Geography
- Exhibits5: Executive Summary - Chart on Market Segmentation by Grade Type
- Exhibits6: Executive Summary - Chart on Market Segmentation by Application
- Exhibits7: Executive Summary - Chart on Incremental Growth
- Exhibits8: Executive Summary - Data Table on Incremental Growth
- Exhibits9: Executive Summary - Chart on Company Market Positioning
- Exhibits10: Parent Market
- Exhibits11: Data Table on - Parent Market
- Exhibits12: Market characteristics analysis
- Exhibits13: Value Chain Analysis
- Exhibits14: Offerings of companies included in the market definition
- Exhibits15: Market segments
- Exhibits16: Chart on Global - Market size and forecast 2023-2028 ($ million)
- Exhibits17: Data Table on Global - Market size and forecast 2023-2028 ($ million)
- Exhibits18: Chart on Global Market: Year-over-year growth 2023-2028 (%)
- Exhibits19: Data Table on Global Market: Year-over-year growth 2023-2028 (%)
- Exhibits20: Historic Market Size - Data Table on Global Liquid Silicone Rubber Market 2018 - 2022 ($ million)
- Exhibits21: Historic Market Size - Grade Type Segment 2018 - 2022 ($ million)
- Exhibits22: Historic Market Size - Application Segment 2018 - 2022 ($ million)
- Exhibits23: Historic Market Size - Geography Segment 2018 - 2022 ($ million)
- Exhibits24: Historic Market Size - Country Segment 2018 - 2022 ($ million)
- Exhibits25: Five forces analysis - Comparison between 2023 and 2028
- Exhibits26: Bargaining power of buyers - Impact of key factors 2023 and 2028
- Exhibits27: Bargaining power of suppliers - Impact of key factors in 2023 and 2028
- Exhibits28: Threat of new entrants - Impact of key factors in 2023 and 2028
- Exhibits29: Threat of substitutes - Impact of key factors in 2023 and 2028
- Exhibits30: Threat of rivalry - Impact of key factors in 2023 and 2028
- Exhibits31: Chart on Market condition - Five forces 2023 and 2028
- Exhibits32: Chart on Grade Type - Market share 2023-2028 (%)
- Exhibits33: Data Table on Grade Type - Market share 2023-2028 (%)
- Exhibits34: Chart on Comparison by Grade Type
- Exhibits35: Data Table on Comparison by Grade Type
- Exhibits36: Chart on Industrial - Market size and forecast 2023-2028 ($ million)
- Exhibits37: Data Table on Industrial - Market size and forecast 2023-2028 ($ million)
- Exhibits38: Chart on Industrial - Year-over-year growth 2023-2028 (%)
- Exhibits39: Data Table on Industrial - Year-over-year growth 2023-2028 (%)
- Exhibits40: Chart on Medical - Market size and forecast 2023-2028 ($ million)
- Exhibits41: Data Table on Medical - Market size and forecast 2023-2028 ($ million)
- Exhibits42: Chart on Medical - Year-over-year growth 2023-2028 (%)
- Exhibits43: Data Table on Medical - Year-over-year growth 2023-2028 (%)
- Exhibits44: Chart on Food - Market size and forecast 2023-2028 ($ million)
- Exhibits45: Data Table on Food - Market size and forecast 2023-2028 ($ million)
- Exhibits46: Chart on Food - Year-over-year growth 2023-2028 (%)
- Exhibits47: Data Table on Food - Year-over-year growth 2023-2028 (%)
- Exhibits48: Market opportunity by Grade Type ($ million)
- Exhibits49: Data Table on Market opportunity by Grade Type ($ million)
- Exhibits50: Chart on Application - Market share 2023-2028 (%)
- Exhibits51: Data Table on Application - Market share 2023-2028 (%)
- Exhibits52: Chart on Comparison by Application
- Exhibits53: Data Table on Comparison by Application
- Exhibits54: Chart on Automotive - Market size and forecast 2023-2028 ($ million)
- Exhibits55: Data Table on Automotive - Market size and forecast 2023-2028 ($ million)
- Exhibits56: Chart on Automotive - Year-over-year growth 2023-2028 (%)
- Exhibits57: Data Table on Automotive - Year-over-year growth 2023-2028 (%)
- Exhibits58: Chart on Medical - Market size and forecast 2023-2028 ($ million)
- Exhibits59: Data Table on Medical - Market size and forecast 2023-2028 ($ million)
- Exhibits60: Chart on Medical - Year-over-year growth 2023-2028 (%)
- Exhibits61: Data Table on Medical - Year-over-year growth 2023-2028 (%)
- Exhibits62: Chart on Electricals and electronics - Market size and forecast 2023-2028 ($ million)
- Exhibits63: Data Table on Electricals and electronics - Market size and forecast 2023-2028 ($ million)
- Exhibits64: Chart on Electricals and electronics - Year-over-year growth 2023-2028 (%)
- Exhibits65: Data Table on Electricals and electronics - Year-over-year growth 2023-2028 (%)
- Exhibits66: Chart on Consumer goods - Market size and forecast 2023-2028 ($ million)
- Exhibits67: Data Table on Consumer goods - Market size and forecast 2023-2028 ($ million)
- Exhibits68: Chart on Consumer goods - Year-over-year growth 2023-2028 (%)
- Exhibits69: Data Table on Consumer goods - Year-over-year growth 2023-2028 (%)
- Exhibits70: Chart on Others - Market size and forecast 2023-2028 ($ million)
- Exhibits71: Data Table on Others - Market size and forecast 2023-2028 ($ million)
- Exhibits72: Chart on Others - Year-over-year growth 2023-2028 (%)
- Exhibits73: Data Table on Others - Year-over-year growth 2023-2028 (%)
- Exhibits74: Market opportunity by Application ($ million)
- Exhibits75: Data Table on Market opportunity by Application ($ million)
- Exhibits76: Analysis of price sensitivity, lifecycle, customer purchase basket, adoption rates, and purchase criteria
- Exhibits77: Chart on Market share By Geographical Landscape2023-2028 (%)
- Exhibits78: Data Table on Market share By Geographical Landscape2023-2028 (%)
- Exhibits79: Chart on Geographic comparison
- Exhibits80: Data Table on Geographic comparison
- Exhibits81: Chart on North America - Market size and forecast 2023-2028 ($ million)
- Exhibits82: Data Table on North America - Market size and forecast 2023-2028 ($ million)
- Exhibits83: Chart on North America - Year-over-year growth 2023-2028 (%)
- Exhibits84: Data Table on North America - Year-over-year growth 2023-2028 (%)
- Exhibits85: Chart on Europe - Market size and forecast 2023-2028 ($ million)
- Exhibits86: Data Table on Europe - Market size and forecast 2023-2028 ($ million)
- Exhibits87: Chart on Europe - Year-over-year growth 2023-2028 (%)
- Exhibits88: Data Table on Europe - Year-over-year growth 2023-2028 (%)
- Exhibits89: Chart on APAC - Market size and forecast 2023-2028 ($ million)
- Exhibits90: Data Table on APAC - Market size and forecast 2023-2028 ($ million)
- Exhibits91: Chart on APAC - Year-over-year growth 2023-2028 (%)
- Exhibits92: Data Table on APAC - Year-over-year growth 2023-2028 (%)
- Exhibits93: Chart on Middle East and Africa - Market size and forecast 2023-2028 ($ million)
- Exhibits94: Data Table on Middle East and Africa - Market size and forecast 2023-2028 ($ million)
- Exhibits95: Chart on Middle East and Africa - Year-over-year growth 2023-2028 (%)
- Exhibits96: Data Table on Middle East and Africa - Year-over-year growth 2023-2028 (%)
- Exhibits97: Chart on South America - Market size and forecast 2023-2028 ($ million)
- Exhibits98: Data Table on South America - Market size and forecast 2023-2028 ($ million)
- Exhibits99: Chart on South America - Year-over-year growth 2023-2028 (%)
- Exhibits100: Data Table on South America - Year-over-year growth 2023-2028 (%)
- Exhibits101: Chart on US - Market size and forecast 2023-2028 ($ million)
- Exhibits102: Data Table on US - Market size and forecast 2023-2028 ($ million)
- Exhibits103: Chart on US - Year-over-year growth 2023-2028 (%)
- Exhibits104: Data Table on US - Year-over-year growth 2023-2028 (%)
- Exhibits105: Chart on China - Market size and forecast 2023-2028 ($ million)
- Exhibits106: Data Table on China - Market size and forecast 2023-2028 ($ million)
- Exhibits107: Chart on China - Year-over-year growth 2023-2028 (%)
- Exhibits108: Data Table on China - Year-over-year growth 2023-2028 (%)
- Exhibits109: Chart on Germany - Market size and forecast 2023-2028 ($ million)
- Exhibits110: Data Table on Germany - Market size and forecast 2023-2028 ($ million)
- Exhibits111: Chart on Germany - Year-over-year growth 2023-2028 (%)
- Exhibits112: Data Table on Germany - Year-over-year growth 2023-2028 (%)
- Exhibits113: Chart on Canada - Market size and forecast 2023-2028 ($ million)
- Exhibits114: Data Table on Canada - Market size and forecast 2023-2028 ($ million)
- Exhibits115: Chart on Canada - Year-over-year growth 2023-2028 (%)
- Exhibits116: Data Table on Canada - Year-over-year growth 2023-2028 (%)
- Exhibits117: Chart on UK - Market size and forecast 2023-2028 ($ million)
- Exhibits118: Data Table on UK - Market size and forecast 2023-2028 ($ million)
- Exhibits119: Chart on UK - Year-over-year growth 2023-2028 (%)
- Exhibits120: Data Table on UK - Year-over-year growth 2023-2028 (%)
- Exhibits121: Market opportunity By Geographical Landscape($ million)
- Exhibits122: Data Tables on Market opportunity By Geographical Landscape($ million)
- Exhibits123: Impact of drivers and challenges in 2023 and 2028
- Exhibits124: Overview on criticality of inputs and factors of differentiation
- Exhibits125: Overview on factors of disruption
- Exhibits126: Impact of key risks on business
- Exhibits127: Companies covered
- Exhibits128: Matrix on companies position and classification
- Exhibits129: Avantor Inc. - Overview
- Exhibits130: Avantor Inc. - Business segments
- Exhibits131: Avantor Inc. - Key news
- Exhibits132: Avantor Inc. - Key offerings
- Exhibits133: Avantor Inc. - Segment focus
- Exhibits134: Dongguan New Orient Technology Co. Ltd - Overview
- Exhibits135: Dongguan New Orient Technology Co. Ltd - Product / Service
- Exhibits136: Dongguan New Orient Technology Co. Ltd - Key offerings
- Exhibits137: Dow Chemical Co. - Overview
- Exhibits138: Dow Chemical Co. - Business segments
- Exhibits139: Dow Chemical Co. - Key news
- Exhibits140: Dow Chemical Co. - Key offerings
- Exhibits141: Dow Chemical Co. - Segment focus
- Exhibits142: Elkem ASA - Overview
- Exhibits143: Elkem ASA - Business segments
- Exhibits144: Elkem ASA - Key offerings
- Exhibits145: Elkem ASA - Segment focus
- Exhibits146: Mesgo Spa - Overview
- Exhibits147: Mesgo Spa - Product / Service
- Exhibits148: Mesgo Spa - Key offerings
- Exhibits149: Momentive Performance Materials Inc. - Overview
- Exhibits150: Momentive Performance Materials Inc. - Product / Service
- Exhibits151: Momentive Performance Materials Inc. - Key offerings
- Exhibits152: Newtop Silicone Manufacturer - Overview
- Exhibits153: Newtop Silicone Manufacturer - Product / Service
- Exhibits154: Newtop Silicone Manufacturer - Key offerings
- Exhibits155: NTCB - Overview
- Exhibits156: NTCB - Product / Service
- Exhibits157: NTCB - Key offerings
- Exhibits158: RD Rubber Technology Corp. - Overview
- Exhibits159: RD Rubber Technology Corp. - Product / Service
- Exhibits160: RD Rubber Technology Corp. - Key offerings
- Exhibits161: REISS MANUFACTURING Inc. - Overview
- Exhibits162: REISS MANUFACTURING Inc. - Product / Service
- Exhibits163: REISS MANUFACTURING Inc. - Key offerings
- Exhibits164: Shin Etsu Chemical Co. Ltd. - Overview
- Exhibits165: Shin Etsu Chemical Co. Ltd. - Business segments
- Exhibits166: Shin Etsu Chemical Co. Ltd. - Key offerings
- Exhibits167: Shin Etsu Chemical Co. Ltd. - Segment focus
- Exhibits168: SIMTEC Silicone Parts LLC - Overview
- Exhibits169: SIMTEC Silicone Parts LLC - Product / Service
- Exhibits170: SIMTEC Silicone Parts LLC - Key offerings
- Exhibits171: Stockwell Elastomerics Inc. - Overview
- Exhibits172: Stockwell Elastomerics Inc. - Product / Service
- Exhibits173: Stockwell Elastomerics Inc. - Key offerings
- Exhibits174: Wacker Chemie AG - Overview
- Exhibits175: Wacker Chemie AG - Business segments
- Exhibits176: Wacker Chemie AG - Key offerings
- Exhibits177: Wacker Chemie AG - Segment focus
- Exhibits178: Wynca Group - Overview
- Exhibits179: Wynca Group - Product / Service
- Exhibits180: Wynca Group - Key offerings
- Exhibits181: Inclusions checklist
- Exhibits182: Exclusions checklist
- Exhibits183: Currency conversion rates for US$
- Exhibits184: Research methodology
- Exhibits185: Information sources
- Exhibits186: Data validation
- Exhibits187: Validation techniques employed for market sizing
- Exhibits188: Data synthesis
- Exhibits189: 360 degree market analysis
- Exhibits190: List of abbreviations
The liquid silicone rubber market is forecasted to grow by USD 1652.4 mn during 2023-2028, accelerating at a CAGR of 9.63% during the forecast period. The report on the liquid silicone rubber market provides a holistic analysis, market size and forecast, trends, growth drivers, and challenges, as well as vendor analysis covering around 25 vendors.
The report offers an up-to-date analysis regarding the current market scenario, the latest trends and drivers, and the overall market environment. The market is driven by high investment in infrastructure in emerging countries, growing demand for lightweight materials, and high rate of hip and knee implants.
Technavio's liquid silicone rubber market is segmented as below:
| Market Scope | |
|---|---|
| Base Year | 2024 |
| End Year | 2028 |
| Series Year | 2024-2028 |
| Growth Momentum | Accelerate |
| YOY 2024 | 8.56% |
| CAGR | 9.63% |
| Incremental Value | $1652.4mn |
By Grade Type
- Industrial
- Medical
- Food
By Application
- Automotive
- Medical
- Electricals and electronics
- Consumer goods
- Others
By Geography
- North America
- Europe
- APAC
- Middle East and Africa
- South America
This study identifies the high demand for transparent LSR elastomers in optical application as one of the prime reasons driving the liquid silicone rubber market growth during the next few years. Also, antimicrobial LSR-silicone elastomers and growing medical tourism will lead to sizable demand in the market.
The report on the liquid silicone rubber market covers the following areas:
- Liquid silicone rubber market sizing
- Liquid silicone rubber market forecast
- Liquid silicone rubber market industry analysis
The robust vendor analysis is designed to help clients improve their market position, and in line with this, this report provides a detailed analysis of several leading liquid silicone rubber market vendors that include Avantor Inc., Cabot Corp., CHT Germany GmbH, Dongguan New Orient Technology Co. Ltd, Dow Chemical Co., Elkem ASA, Genstar Technik, Mesgo Spa, Momentive Performance Materials Inc., Newtop Silicone Manufacturer, NTCB, RD Rubber Technology Corp., REISS MANUFACTURING Inc., Rosti Group AB, Ruijin, Shin Etsu Chemical Co. Ltd., SIMTEC Silicone Parts LLC, Stockwell Elastomerics Inc., Wacker Chemie AG, and Wynca Group. Also, the liquid silicone rubber market analysis report includes information on upcoming trends and challenges that will influence market growth. This is to help companies strategize and leverage all forthcoming growth opportunities.
The study was conducted using an objective combination of primary and secondary information including inputs from key participants in the industry. The report contains a comprehensive market and vendor landscape in addition to an analysis of the key vendors.
The publisher presents a detailed picture of the market by the way of study, synthesis, and summation of data from multiple sources by an analysis of key parameters such as profit, pricing, competition, and promotions. It presents various market facets by identifying the key industry influencers. The data presented is comprehensive, reliable, and a result of extensive research - both primary and secondary. The market research reports provide a complete competitive landscape and an in-depth vendor selection methodology and analysis using qualitative and quantitative research to forecast the accurate market growth.
Table of Contents
1 Executive Summary
- 1.1 Market overview
- Executive Summary - Chart on Market Overview
- Executive Summary - Data Table on Market Overview
- Executive Summary - Chart on Global Market Characteristics
- Executive Summary - Chart on Market by Geography
- Executive Summary - Chart on Market Segmentation by Grade Type
- Executive Summary - Chart on Market Segmentation by Application
- Executive Summary - Chart on Incremental Growth
- Executive Summary - Data Table on Incremental Growth
- Executive Summary - Chart on Company Market Positioning
2 Market Landscape
- 2.1 Market ecosystem
- Parent Market
- Data Table on - Parent Market
- 2.2 Market characteristics
- Market characteristics analysis
- 2.3 Value chain analysis
- Value Chain Analysis
3 Market Sizing
- 3.1 Market definition
- Offerings of companies included in the market definition
- 3.2 Market segment analysis
- Market segments
- 3.3 Market size 2023
- 3.4 Market outlook: Forecast for 2023-2028
- Chart on Global - Market size and forecast 2023-2028 ($ million)
- Data Table on Global - Market size and forecast 2023-2028 ($ million)
- Chart on Global Market: Year-over-year growth 2023-2028 (%)
- Data Table on Global Market: Year-over-year growth 2023-2028 (%)
4 Historic Market Size
- 4.1 Global Liquid Silicone Rubber Market 2018 - 2022
- Historic Market Size - Data Table on Global Liquid Silicone Rubber Market 2018 - 2022 ($ million)
- 4.2 Grade Type segment analysis 2018 - 2022
- Historic Market Size - Grade Type Segment 2018 - 2022 ($ million)
- 4.3 Application segment analysis 2018 - 2022
- Historic Market Size - Application Segment 2018 - 2022 ($ million)
- 4.4 Geography segment analysis 2018 - 2022
- Historic Market Size - Geography Segment 2018 - 2022 ($ million)
- 4.5 Country segment analysis 2018 - 2022
- Historic Market Size - Country Segment 2018 - 2022 ($ million)
5 Five Forces Analysis
- 5.1 Five forces summary
- Five forces analysis - Comparison between 2023 and 2028
- 5.2 Bargaining power of buyers
- Bargaining power of buyers - Impact of key factors 2023 and 2028
- 5.3 Bargaining power of suppliers
- Bargaining power of suppliers - Impact of key factors in 2023 and 2028
- 5.4 Threat of new entrants
- Threat of new entrants - Impact of key factors in 2023 and 2028
- 5.5 Threat of substitutes
- Threat of substitutes - Impact of key factors in 2023 and 2028
- 5.6 Threat of rivalry
- Threat of rivalry - Impact of key factors in 2023 and 2028
- 5.7 Market condition
- Chart on Market condition - Five forces 2023 and 2028
6 Market Segmentation by Grade Type
- 6.1 Market segments
- Chart on Grade Type - Market share 2023-2028 (%)
- Data Table on Grade Type - Market share 2023-2028 (%)
- 6.2 Comparison by Grade Type
- Chart on Comparison by Grade Type
- Data Table on Comparison by Grade Type
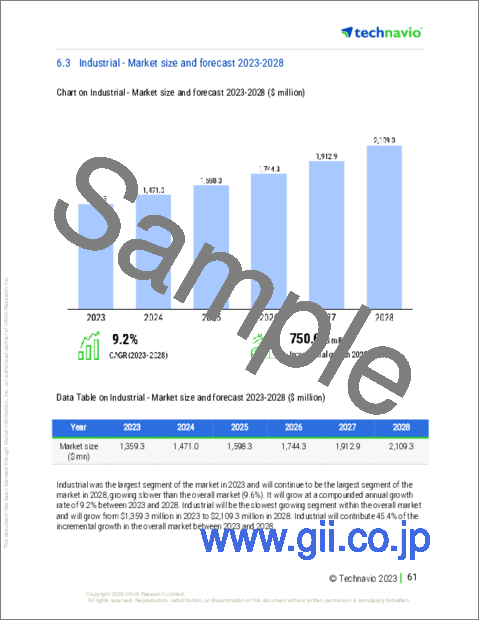
- 6.3 Industrial - Market size and forecast 2023-2028
- Chart on Industrial - Market size and forecast 2023-2028 ($ million)
- Data Table on Industrial - Market size and forecast 2023-2028 ($ million)
- Chart on Industrial - Year-over-year growth 2023-2028 (%)
- Data Table on Industrial - Year-over-year growth 2023-2028 (%)
- 6.4 Medical - Market size and forecast 2023-2028
- Chart on Medical - Market size and forecast 2023-2028 ($ million)
- Data Table on Medical - Market size and forecast 2023-2028 ($ million)
- Chart on Medical - Year-over-year growth 2023-2028 (%)
- Data Table on Medical - Year-over-year growth 2023-2028 (%)
- 6.5 Food - Market size and forecast 2023-2028
- Chart on Food - Market size and forecast 2023-2028 ($ million)
- Data Table on Food - Market size and forecast 2023-2028 ($ million)
- Chart on Food - Year-over-year growth 2023-2028 (%)
- Data Table on Food - Year-over-year growth 2023-2028 (%)
- 6.6 Market opportunity by Grade Type
- Market opportunity by Grade Type ($ million)
- Data Table on Market opportunity by Grade Type ($ million)
7 Market Segmentation by Application
- 7.1 Market segments
- Chart on Application - Market share 2023-2028 (%)
- Data Table on Application - Market share 2023-2028 (%)
- 7.2 Comparison by Application
- Chart on Comparison by Application
- Data Table on Comparison by Application
- 7.3 Automotive - Market size and forecast 2023-2028
- Chart on Automotive - Market size and forecast 2023-2028 ($ million)
- Data Table on Automotive - Market size and forecast 2023-2028 ($ million)
- Chart on Automotive - Year-over-year growth 2023-2028 (%)
- Data Table on Automotive - Year-over-year growth 2023-2028 (%)
- 7.4 Medical - Market size and forecast 2023-2028
- Chart on Medical - Market size and forecast 2023-2028 ($ million)
- Data Table on Medical - Market size and forecast 2023-2028 ($ million)
- Chart on Medical - Year-over-year growth 2023-2028 (%)
- Data Table on Medical - Year-over-year growth 2023-2028 (%)
- 7.5 Electricals and electronics - Market size and forecast 2023-2028
- Chart on Electricals and electronics - Market size and forecast 2023-2028 ($ million)
- Data Table on Electricals and electronics - Market size and forecast 2023-2028 ($ million)
- Chart on Electricals and electronics - Year-over-year growth 2023-2028 (%)
- Data Table on Electricals and electronics - Year-over-year growth 2023-2028 (%)
- 7.6 Consumer goods - Market size and forecast 2023-2028
- Chart on Consumer goods - Market size and forecast 2023-2028 ($ million)
- Data Table on Consumer goods - Market size and forecast 2023-2028 ($ million)
- Chart on Consumer goods - Year-over-year growth 2023-2028 (%)
- Data Table on Consumer goods - Year-over-year growth 2023-2028 (%)
- 7.7 Others - Market size and forecast 2023-2028
- Chart on Others - Market size and forecast 2023-2028 ($ million)
- Data Table on Others - Market size and forecast 2023-2028 ($ million)
- Chart on Others - Year-over-year growth 2023-2028 (%)
- Data Table on Others - Year-over-year growth 2023-2028 (%)
- 7.8 Market opportunity by Application
- Market opportunity by Application ($ million)
- Data Table on Market opportunity by Application ($ million)
8 Customer Landscape
- 8.1 Customer landscape overview
- Analysis of price sensitivity, lifecycle, customer purchase basket, adoption rates, and purchase criteria
9 Geographic Landscape
- 9.1 Geographic segmentation
- Chart on Market share By Geographical Landscape2023-2028 (%)
- Data Table on Market share By Geographical Landscape2023-2028 (%)
- 9.2 Geographic comparison
- Chart on Geographic comparison
- Data Table on Geographic comparison
- 9.3 North America - Market size and forecast 2023-2028
- Chart on North America - Market size and forecast 2023-2028 ($ million)
- Data Table on North America - Market size and forecast 2023-2028 ($ million)
- Chart on North America - Year-over-year growth 2023-2028 (%)
- Data Table on North America - Year-over-year growth 2023-2028 (%)
- 9.4 Europe - Market size and forecast 2023-2028
- Chart on Europe - Market size and forecast 2023-2028 ($ million)
- Data Table on Europe - Market size and forecast 2023-2028 ($ million)
- Chart on Europe - Year-over-year growth 2023-2028 (%)
- Data Table on Europe - Year-over-year growth 2023-2028 (%)
- 9.5 APAC - Market size and forecast 2023-2028
- Chart on APAC - Market size and forecast 2023-2028 ($ million)
- Data Table on APAC - Market size and forecast 2023-2028 ($ million)
- Chart on APAC - Year-over-year growth 2023-2028 (%)
- Data Table on APAC - Year-over-year growth 2023-2028 (%)
- 9.6 Middle East and Africa - Market size and forecast 2023-2028
- Chart on Middle East and Africa - Market size and forecast 2023-2028 ($ million)
- Data Table on Middle East and Africa - Market size and forecast 2023-2028 ($ million)
- Chart on Middle East and Africa - Year-over-year growth 2023-2028 (%)
- Data Table on Middle East and Africa - Year-over-year growth 2023-2028 (%)
- 9.7 South America - Market size and forecast 2023-2028
- Chart on South America - Market size and forecast 2023-2028 ($ million)
- Data Table on South America - Market size and forecast 2023-2028 ($ million)
- Chart on South America - Year-over-year growth 2023-2028 (%)
- Data Table on South America - Year-over-year growth 2023-2028 (%)
- 9.8 US - Market size and forecast 2023-2028
- Chart on US - Market size and forecast 2023-2028 ($ million)
- Data Table on US - Market size and forecast 2023-2028 ($ million)
- Chart on US - Year-over-year growth 2023-2028 (%)
- Data Table on US - Year-over-year growth 2023-2028 (%)
- 9.9 China - Market size and forecast 2023-2028
- Chart on China - Market size and forecast 2023-2028 ($ million)
- Data Table on China - Market size and forecast 2023-2028 ($ million)
- Chart on China - Year-over-year growth 2023-2028 (%)
- Data Table on China - Year-over-year growth 2023-2028 (%)
- 9.10 Germany - Market size and forecast 2023-2028
- Chart on Germany - Market size and forecast 2023-2028 ($ million)
- Data Table on Germany - Market size and forecast 2023-2028 ($ million)
- Chart on Germany - Year-over-year growth 2023-2028 (%)
- Data Table on Germany - Year-over-year growth 2023-2028 (%)
- 9.11 Canada - Market size and forecast 2023-2028
- Chart on Canada - Market size and forecast 2023-2028 ($ million)
- Data Table on Canada - Market size and forecast 2023-2028 ($ million)
- Chart on Canada - Year-over-year growth 2023-2028 (%)
- Data Table on Canada - Year-over-year growth 2023-2028 (%)
- 9.12 UK - Market size and forecast 2023-2028
- Chart on UK - Market size and forecast 2023-2028 ($ million)
- Data Table on UK - Market size and forecast 2023-2028 ($ million)
- Chart on UK - Year-over-year growth 2023-2028 (%)
- Data Table on UK - Year-over-year growth 2023-2028 (%)
- 9.13 Market opportunity by geography
- Market opportunity By Geographical Landscape($ million)
- Data Tables on Market opportunity By Geographical Landscape($ million)
10 Drivers, Challenges, and Opportunity/Restraints
- 10.1 Market drivers
- 10.2 Market challenges
- 10.3 Impact of drivers and challenges
- Impact of drivers and challenges in 2023 and 2028
- 10.4 Market opportunities/restraints
11 Competitive Landscape
- 11.1 Overview
- 11.2 Competitive Landscape
- Overview on criticality of inputs and factors of differentiation
- 11.3 Landscape disruption
- Overview on factors of disruption
- 11.4 Industry risks
- Impact of key risks on business
12 Competitive Analysis
- 12.1 Companies profiled
- Companies covered
- 12.2 Market positioning of companies
- Matrix on companies position and classification
- 12.3 Avantor Inc.
- Avantor Inc. - Overview
- Avantor Inc. - Business segments
- Avantor Inc. - Key news
- Avantor Inc. - Key offerings
- Avantor Inc. - Segment focus
- 12.4 Dongguan New Orient Technology Co. Ltd
- Dongguan New Orient Technology Co. Ltd - Overview
- Dongguan New Orient Technology Co. Ltd - Product / Service
- Dongguan New Orient Technology Co. Ltd - Key offerings
- 12.5 Dow Chemical Co.
- Dow Chemical Co. - Overview
- Dow Chemical Co. - Business segments
- Dow Chemical Co. - Key news
- Dow Chemical Co. - Key offerings
- Dow Chemical Co. - Segment focus
- 12.6 Elkem ASA
- Elkem ASA - Overview
- Elkem ASA - Business segments
- Elkem ASA - Key offerings
- Elkem ASA - Segment focus
- 12.7 Mesgo Spa
- Mesgo Spa - Overview
- Mesgo Spa - Product / Service
- Mesgo Spa - Key offerings
- 12.8 Momentive Performance Materials Inc.
- Momentive Performance Materials Inc. - Overview
- Momentive Performance Materials Inc. - Product / Service
- Momentive Performance Materials Inc. - Key offerings
- 12.9 Newtop Silicone Manufacturer
- Newtop Silicone Manufacturer - Overview
- Newtop Silicone Manufacturer - Product / Service
- Newtop Silicone Manufacturer - Key offerings
- 12.10 NTCB
- NTCB - Overview
- NTCB - Product / Service
- NTCB - Key offerings
- 12.11 RD Rubber Technology Corp.
- RD Rubber Technology Corp. - Overview
- RD Rubber Technology Corp. - Product / Service
- RD Rubber Technology Corp. - Key offerings
- 12.12 REISS MANUFACTURING Inc.
- REISS MANUFACTURING Inc. - Overview
- REISS MANUFACTURING Inc. - Product / Service
- REISS MANUFACTURING Inc. - Key offerings
- 12.13 Shin Etsu Chemical Co. Ltd.
- Shin Etsu Chemical Co. Ltd. - Overview
- Shin Etsu Chemical Co. Ltd. - Business segments
- Shin Etsu Chemical Co. Ltd. - Key offerings
- Shin Etsu Chemical Co. Ltd. - Segment focus
- 12.14 SIMTEC Silicone Parts LLC
- SIMTEC Silicone Parts LLC - Overview
- SIMTEC Silicone Parts LLC - Product / Service
- SIMTEC Silicone Parts LLC - Key offerings
- 12.15 Stockwell Elastomerics Inc.
- Stockwell Elastomerics Inc. - Overview
- Stockwell Elastomerics Inc. - Product / Service
- Stockwell Elastomerics Inc. - Key offerings
- 12.16 Wacker Chemie AG
- Wacker Chemie AG - Overview
- Wacker Chemie AG - Business segments
- Wacker Chemie AG - Key offerings
- Wacker Chemie AG - Segment focus
- 12.17 Wynca Group
- Wynca Group - Overview
- Wynca Group - Product / Service
- Wynca Group - Key offerings
13 Appendix
- 13.1 Scope of the report
- 13.2 Inclusions and exclusions checklist
- Inclusions checklist
- Exclusions checklist
- 13.3 Currency conversion rates for US$
- Currency conversion rates for US$
- 13.4 Research methodology
- Research methodology
- 13.5 Data procurement
- Information sources
- 13.6 Data validation
- Data validation
- 13.7 Validation techniques employed for market sizing
- Validation techniques employed for market sizing
- 13.8 Data synthesis
- Data synthesis
- 13.9 360 degree market analysis
- 360 degree market analysis
- 13.10 List of abbreviations
- List of abbreviations

