|
|
市場調査レポート
商品コード
2030542
デジタルテキスタイル印刷の世界市場 2026年~2030年Global Digital Textile Printing Market 2026-2030 |
||||||
|
|||||||
カスタマイズ可能
|
|||||||

| デジタルテキスタイル印刷の世界市場 2026年~2030年 |
|
出版日: 2026年05月03日
発行: TechNavio
ページ情報: 英文 306 Pages
納期: 即納可能
|

概要
世界のデジタルテキスタイル印刷市場は、2025年から2030年にかけて47億9,920万米ドル成長し、予測期間中のCAGRは16.6%になると予測されています。
本レポートでは、世界のデジタルテキスタイル印刷市場について、包括的な分析、市場規模と予測、動向、成長促進要因、課題に加え、約25社のベンダーを網羅したベンダー分析を提供しています。
本レポートでは、現在の市場状況、最新の動向と促進要因、および市場環境全般に関する最新の分析を提供しています。市場は、見本市や展示会の増加、ロール・ツー・ロール(R2R)プロセスの採用拡大、そして世界のアパレル市場の成長によって牽引されており、これらが市場の成長に影響を与えています。
本調査は、業界の主要関係者からの意見を含む一次情報と二次情報を客観的に組み合わせて実施されました。本レポートには、主要企業の分析に加え、包括的な市場規模データ、地域別分析を伴うセグメント、およびベンダー情勢が含まれています。レポートには、過去データと予測データが掲載されています。
| 市場範囲 | |
|---|---|
| 基準年 | 2025年 |
| 終了年 | 2030年 |
| 調査期間 | 2026年~2030年 |
| 成長モメンタム | 加速 |
| 2026年の前年比 | 14.3% |
| CAGR | 16.6% |
| 増分額 | 47億9,920万米ドル |
本調査では、今後数年間における世界のデジタルテキスタイル印刷市場の成長を牽引する主な要因の一つとして、UV硬化型インクの重要性が高まっていることを指摘しています。また、インクの品揃えの拡大が市場の拡大を加速させており、インクにおける有機顔料の使用増加が市場においてかなりの需要を生み出すことになるでしょう。
目次
第1章 エグゼクティブサマリー
第2章 Technavio分析
- 価格反応性・ライフサイクル・顧客購入バスケット・採用率・購入基準の分析
- インプットの重要性と差別化の要因
- ディスラプション要因
- 促進要因と課題の影響
第3章 市場情勢
- 市場エコシステム
- 市場の特徴
- バリューチェーン分析
第4章 市場規模
- 市場の定義
- 市場セグメント分析
- 市場規模、2025年
- 市場の見通し、2025年~2030年
第5章 市場規模実績
- 世界のデジタルテキスタイル印刷市場、2020年~2024年
- タイプ別セグメント分析、2020年~2024年
- 用途別セグメント分析、2020年~2024年
- 素材別セグメント分析、2020年~2024年
- 地域別セグメント分析、2020年~2024年
- 国別セグメント分析、2020年~2024年
第6章 定性分析
- AIの影響:世界のデジタルテキスタイル印刷市場
- 地政学的紛争が及ぼす影響:世界のデジタルテキスタイル印刷市場
第7章 ファイブフォース分析
第8章 市場セグメンテーション:タイプ別
- 比較:タイプ別
- 分散型インク
- 反応性インク
- 酸性インク
- 顔料インク
- 市場機会:タイプ別
第9章 市場セグメンテーション:用途別
- 比較:用途別
- 衣料品
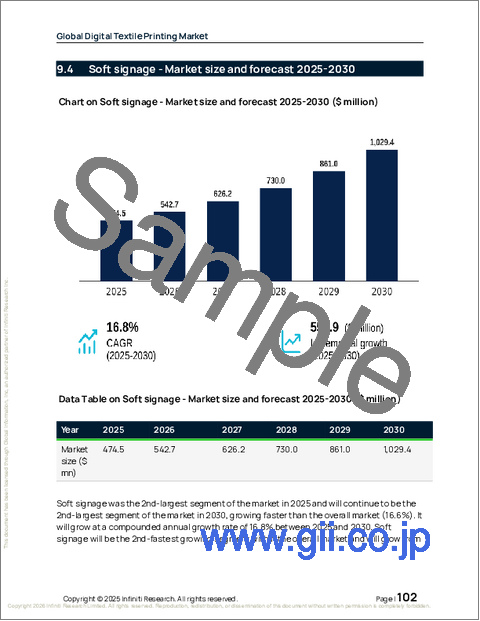
- ソフトサイネージ
- ホームテキスタイル
- テキスタイル
- その他
- 市場機会:用途別
第10章 市場セグメンテーション:素材別
- 比較:素材別
- ポリエステル
- コットン
- その他
- 市場機会:素材別
第11章 顧客情勢
第12章 地域別情勢
- 地域別セグメンテーション
- 地域別比較
- 欧州
- ドイツ
- 英国
- フランス
- イタリア
- スペイン
- オランダ
- アジア太平洋地域
- 中国
- 日本
- インド
- 韓国
- オーストラリア
- インドネシア
- 北米
- 米国
- カナダ
- メキシコ
- 南アメリカ
- ブラジル
- アルゼンチン
- チリ
- 中東・アフリカ
- サウジアラビア
- UAE
- 南アフリカ
- イスラエル
- トルコ
- 市場機会:地域別
第13章 促進要因・課題・機会
- 市場促進要因
- 市場の課題
- 促進要因と課題の影響
- 市場機会
第14章 競合情勢
- 概要
- 競合情勢
- ディスラプション情勢
- 業界のリスク
第15章 競合分析
- 企業プロファイル
- 企業ランキング指標
- 企業の市場ポジショニング
- aeoon technologies GmbH
- Agfa Gevaert NV
- Brother Industries Ltd.
- Colorjet Group
- Durst Group AG
- Electronics For Imaging Inc.
- Kornit Digital Ltd.
- Mimaki Engineering Co. Ltd.
- MS Printing Solutions S.r.l.
- Papilio Prints
- Ricoh Co. Ltd.
- Roland DG Corp.
- Seiko Epson Corp.
- SPGPrints
- The M and R Co
